Debugging the native-activity project with Visual Studio
This tutorial shows how to build and debug the Native-activity sample provided with Android NDK.
Before you begin, please install VisualGDB 2.0 or later (ensure that “Android Edition” is checked in the installer). If you are not familiar with VisualGDB, please first go through the Android Quickstart tutorial.
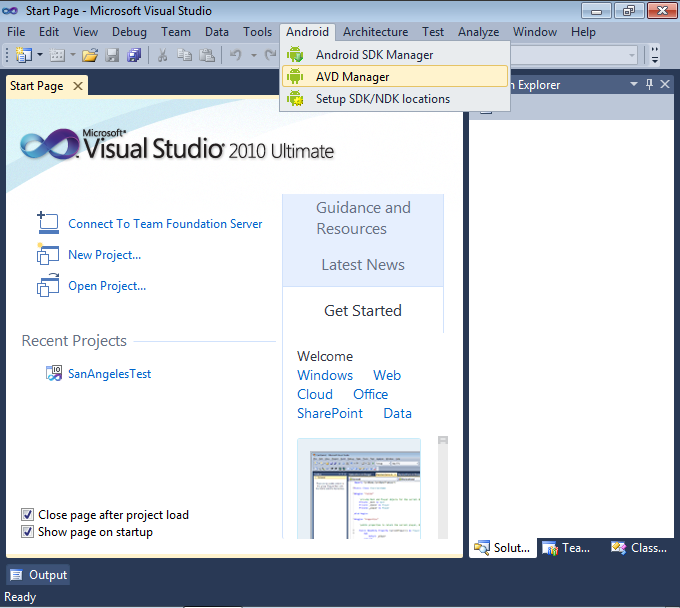
- Start Visual Studio. Select Android->AVD Manager to start Android Emulator.
- If you already have a virtual Android device based on version 2.3.3 or later, start it. Otherwise, create a new virtual device (versions before 2.3.3 do not support native activities!).
- Go back to Visual Studio. Select File->New project->VisualGDB->Android Project Wizard.
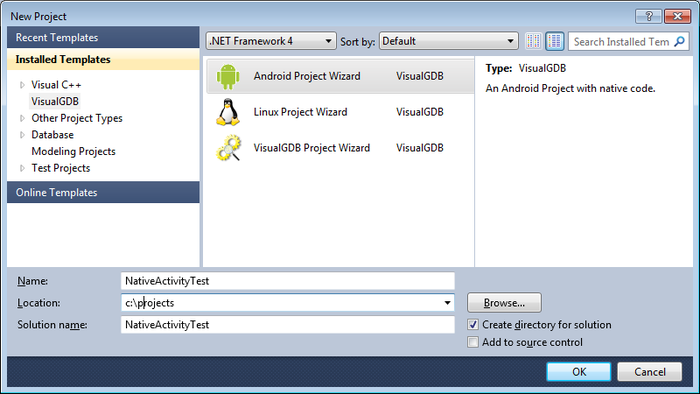
- Enter a path for the new project and specify an arbitrary project name. Press “OK”.
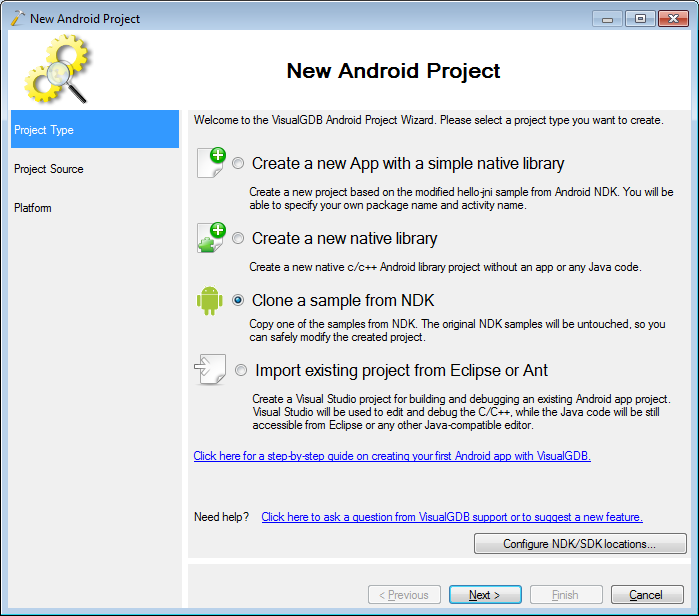
- Select “Clone a sample from NDK” and press “Next”.
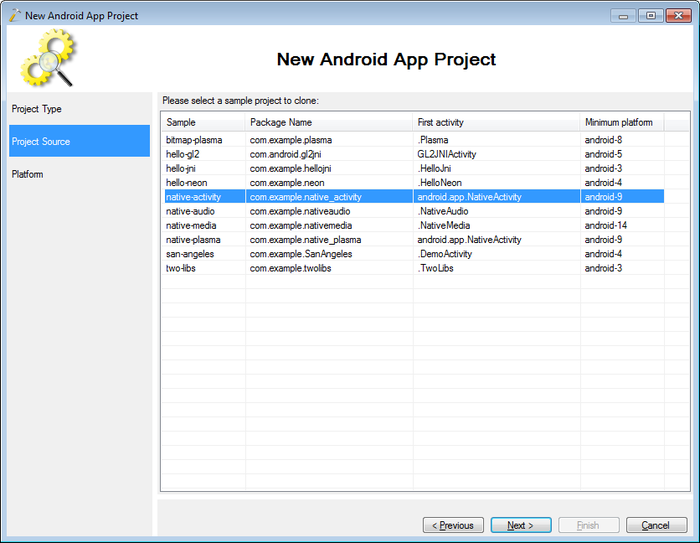
- Select “native-activity” from the sample list. Press “next”.
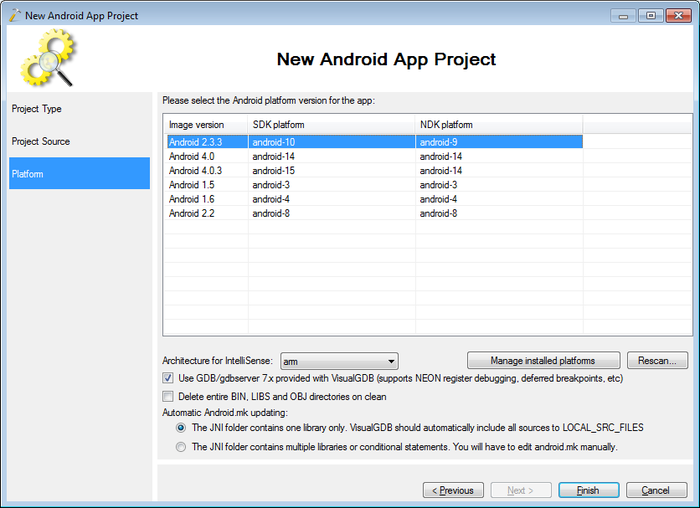
- Select “Android 2.3.3” from the platform list. Press “next”.
- Build your project by selecting “Build->Build Solution”.
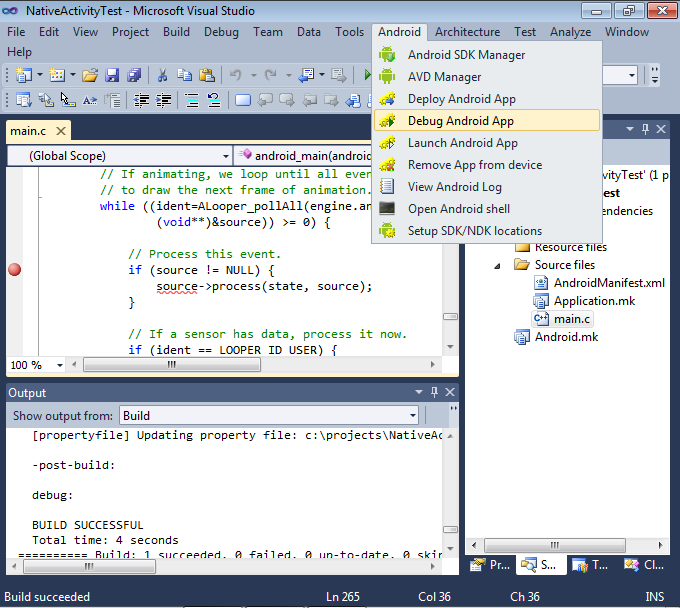
- Open the main.c file and set a breakpoint after the “Process the event” comment.
- Start debugging by selecting Android -> Debug Android App.
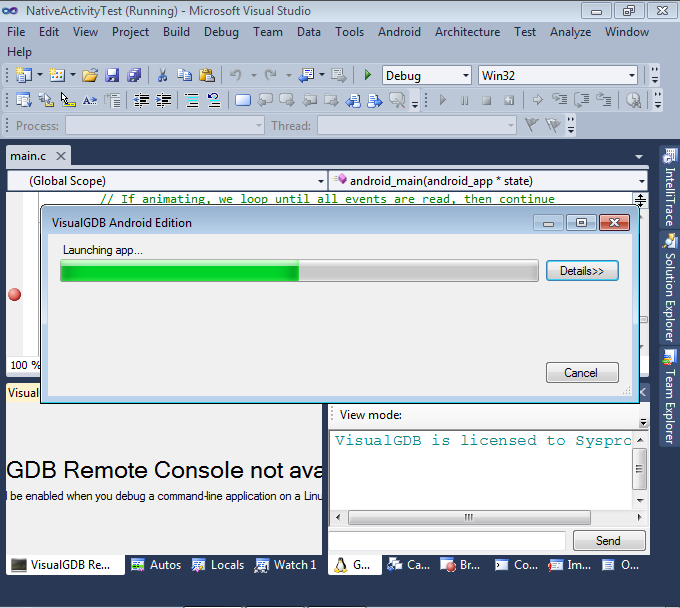
- Wait until VisualGDB deploys the app, launches it and attaches to it.
- After VisualGDB attaches to the app, the breakpoint should hit. If this does not happen, go to the emulator and click on the screen. Then go back to Visual Studio.
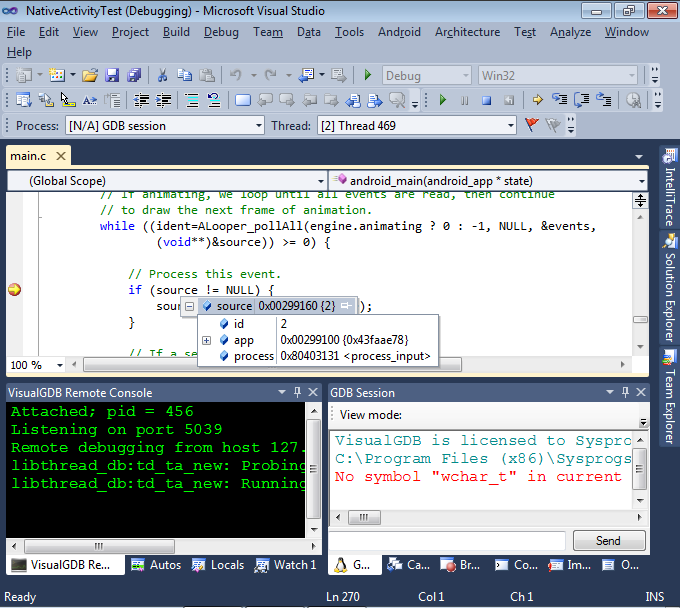
- You can now use the usual Visual Studio windows (e.g. call stack or watch) and commands (e.g. step over) to debug your program.
- To finish debugging, press Shift+F5.


