Developing STM32 projects with Visual Studio
This tutorial shows how to create a simple ‘Blinking LED’ project for the STM32100B-EVAL board using Visual Studio.
Before we begin, ensure that VisualGDB is installed.
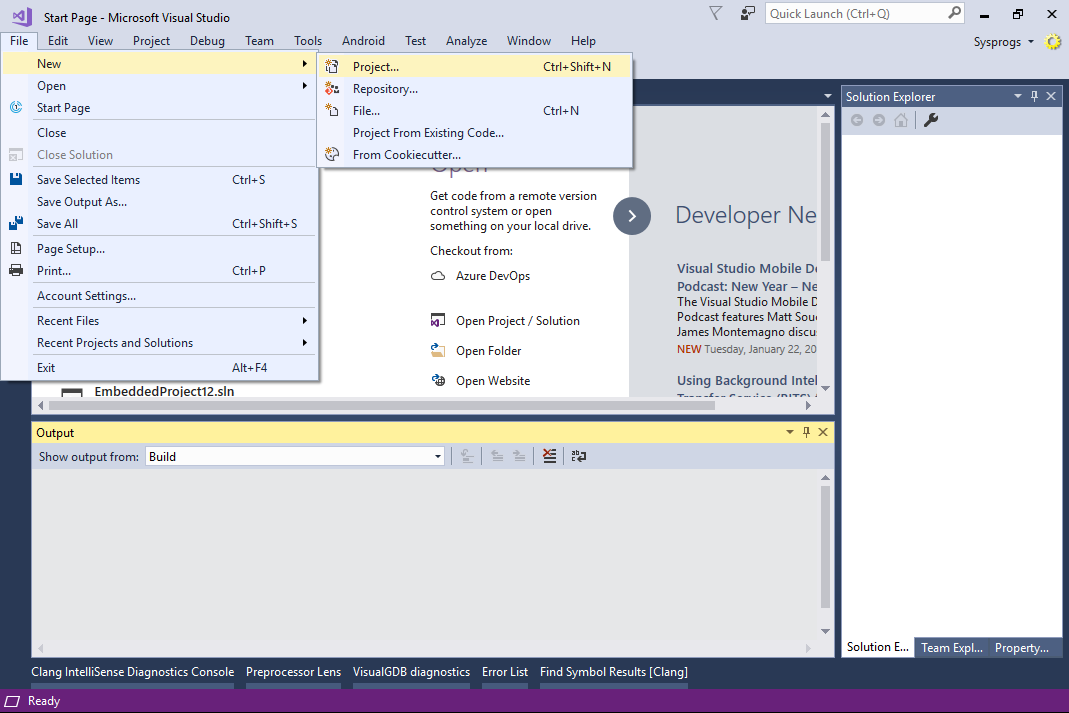
- Start Visual Studio. Go to File->New->Project:
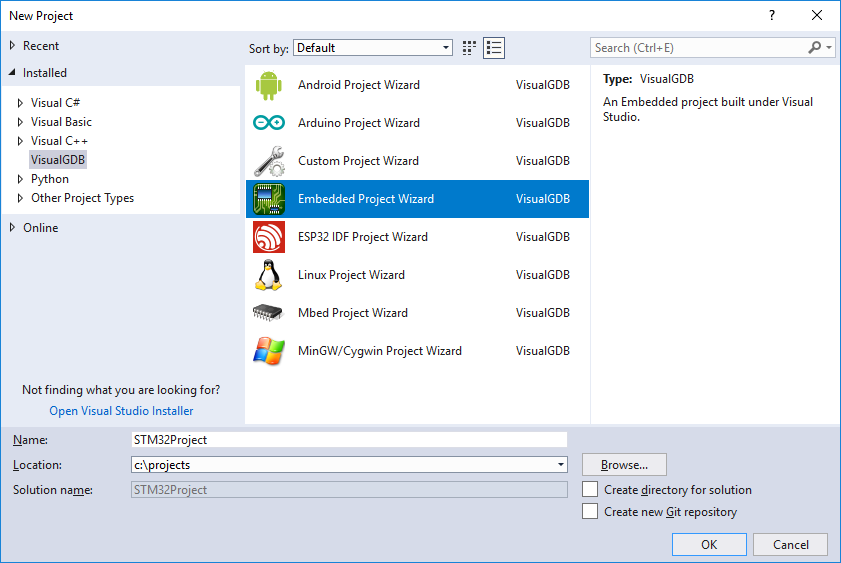
- Select VisualGDB -> Embedded Project Wizard. Specify project directory and enter project name:
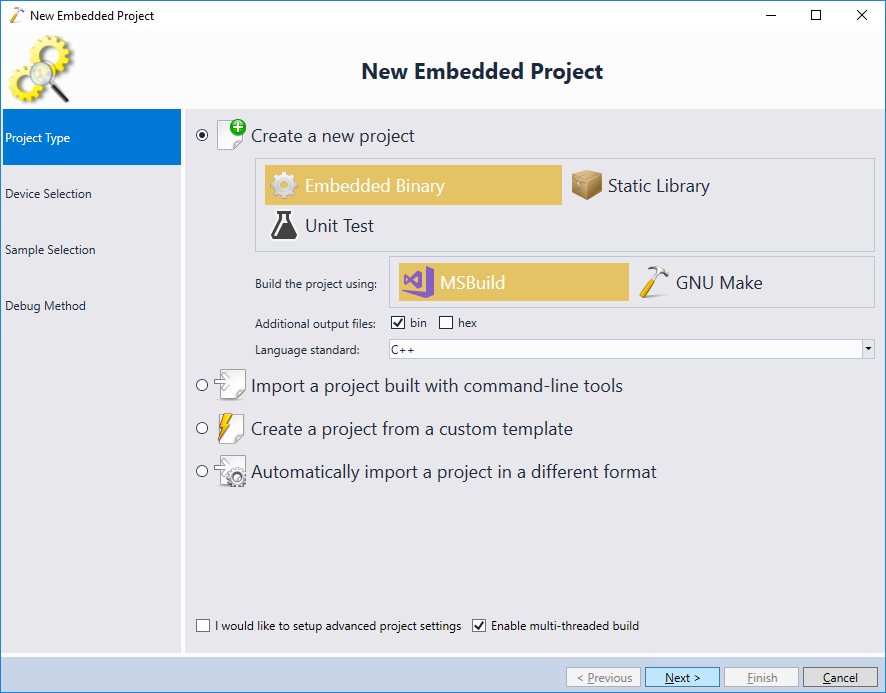
- Select “Embedded binary”. If you want VisualGDB to generate a .bin file additionally to an .elf file, ensure that the corresponding checkbox is checked.
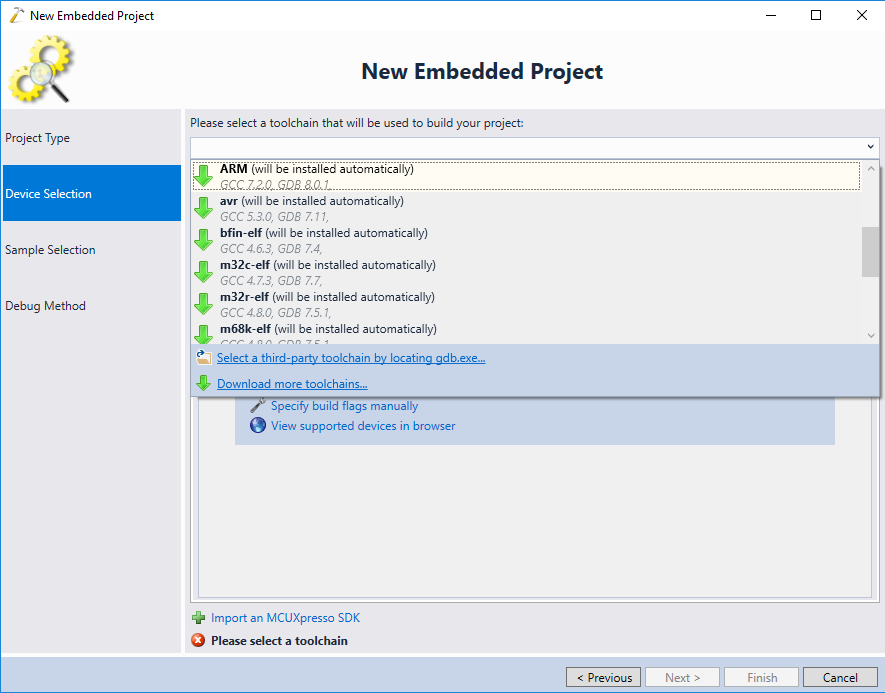
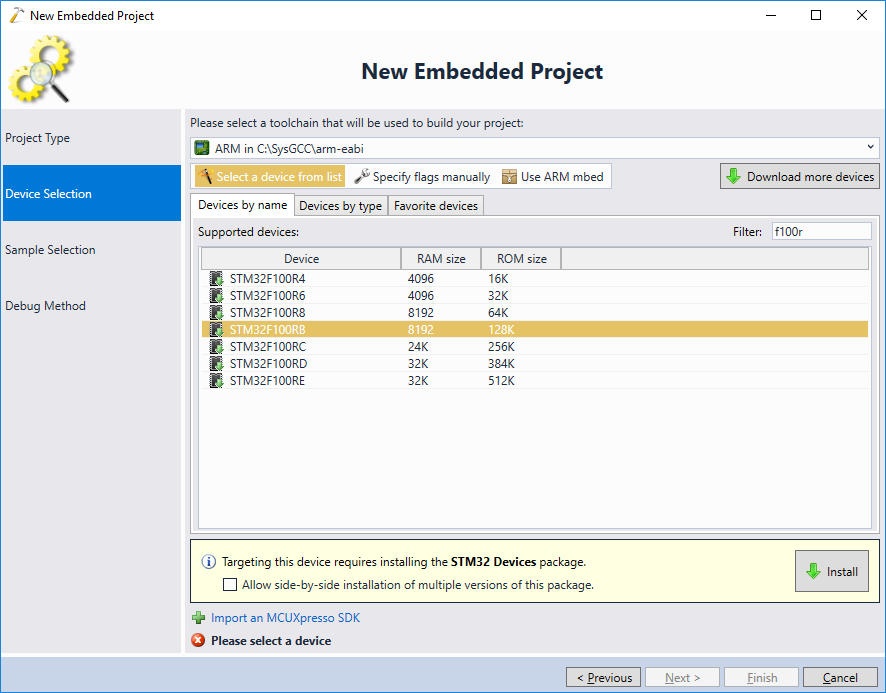
- On the next page select the arm-eabi toolchain. If it is not installed, VisualGDB will install it automatically:
- Once the ARM toolchain is selected, VisualGDB will show a list of the compatible targets. If you have not created STM32-based projects with VisualGDB before, click “Install” to automatically download and install the necessary files:
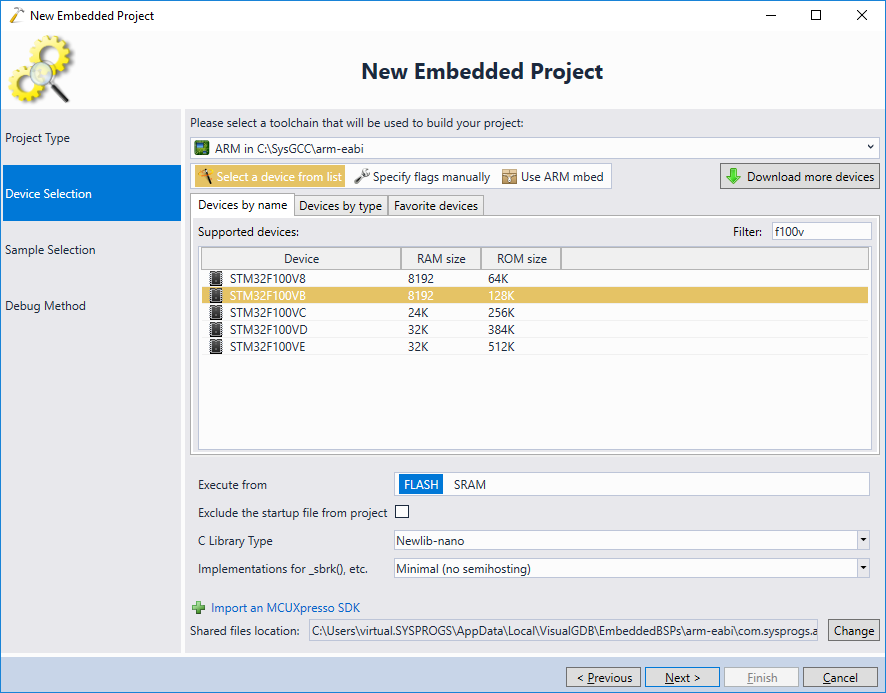
- Once the STM32 package is installed, you will be able to configure various device-specific properties (e.g. whether to run from FLASH or SRAM):
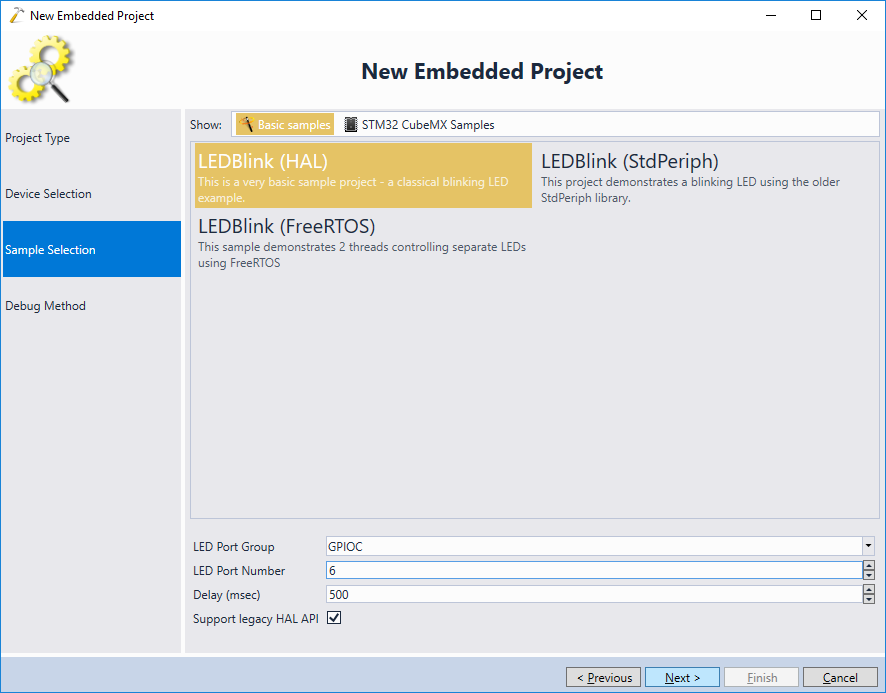
- VisualGDB will generate the default ‘Blinking LED’ sample project. You can select the port number and the blinking delay on the next page:
- On the last wizard page you can select a debug method. VisualGDB will automatically detect and configure most of the JTAG/SWD adapters. Simply plug it into the USB port and select it in the list:
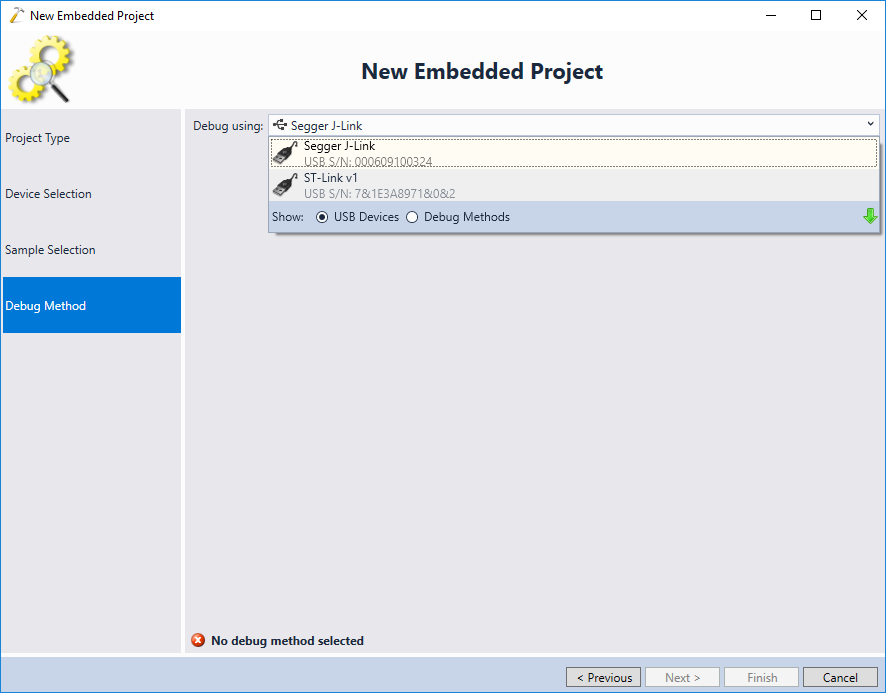
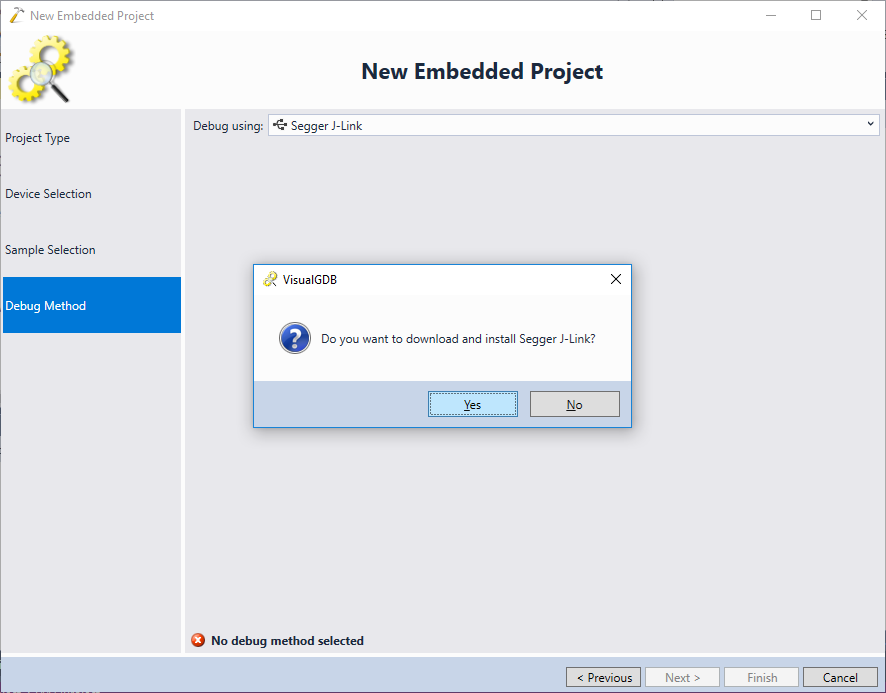
- In this tutorial we will show how to use VisualGDB with Segger J-Link using the Segger Software package. If you want to use ST-Link or another JTAG/SWD debugger, simply select it from the list instead. VisualGDB will let you automatically download the debug method package if it is missing:
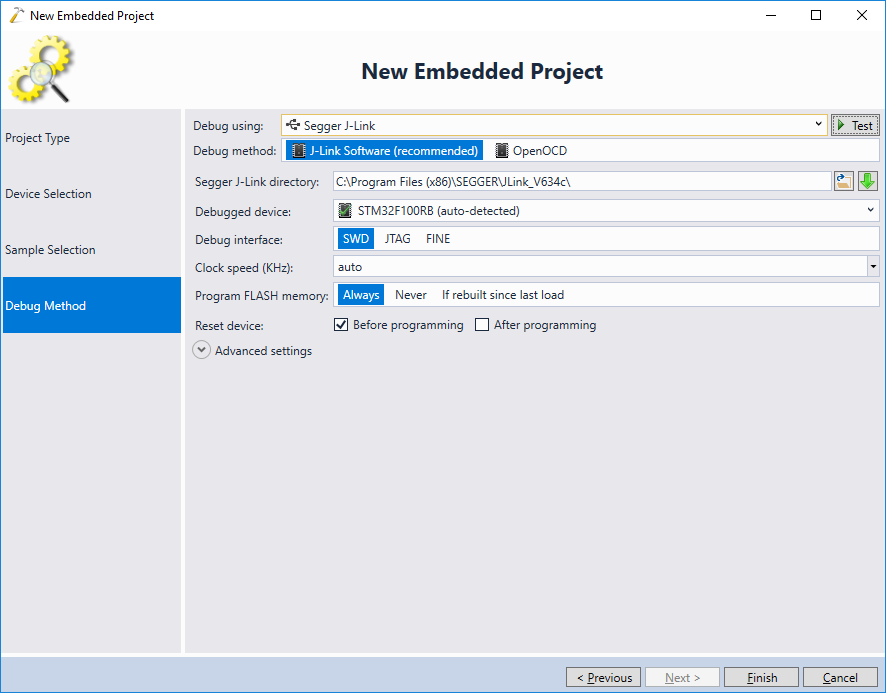
- If you have not installed the Segger software package yet, follow the link in VisualGDB wizard to install it. Once installed, specify its location in the “Segger J-Link directory” field:
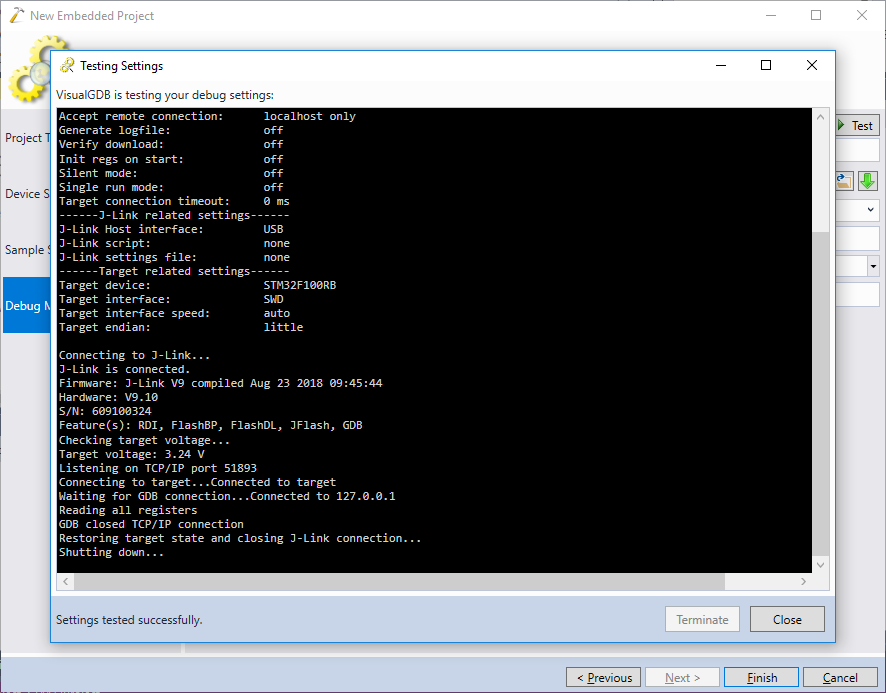
- Use the “Test” button to automatically test the connection to the device:
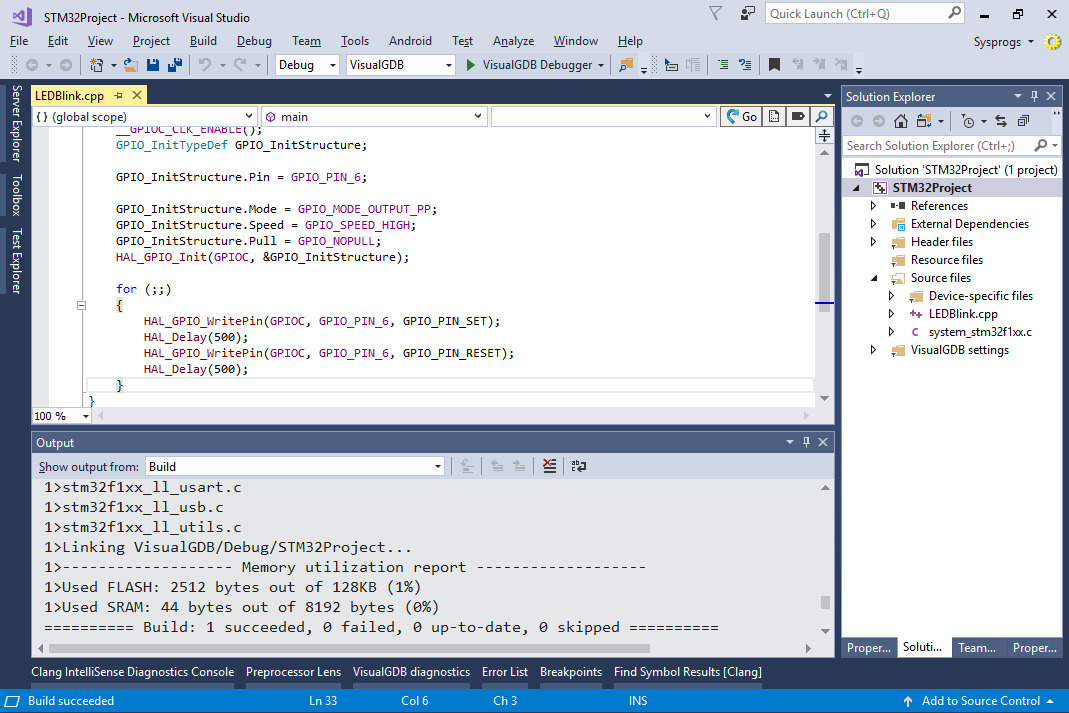
- Press Finish to complete the wizard. VisualGDB will generate a Visual Studio project for your STM32 device. Press Ctrl-Shift-B to build it:
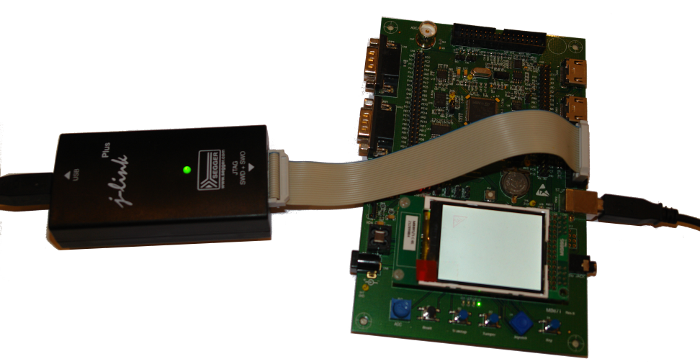
- To start debugging it simply power on your board and connect the JTAG debugger to it. Ensure that Windows recognizes the device and loads the appropriate drivers. Set a breakpoint inside the loop and press F5 to start debugging. You can debug your firmware just like an ordinary Windows program:

- Press F10 to step over the line that turns on the LED. You will see the LED turning on:
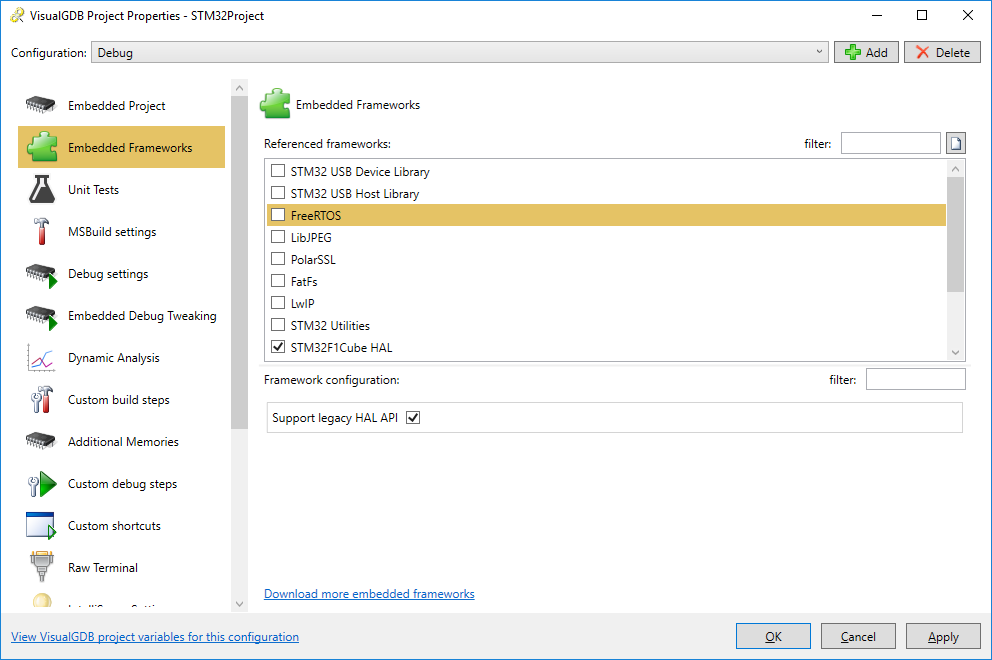
- You can customize various project settings by right-clicking on the project node in Solution Explorer and selecting “VisualGDB Project Properties”. E.g. you can reference various frameworks included in the STM32 package via the Embedded Frameworks page. VisualGDB will automatically update your makefile and synchronize IntelliSense settings:
- VisualGDB will automatically index your sources (and the STM32 package sources) and will let you navigate through them using CodeJumps. Simply click the CodeJumps labels near the function declarations to view references, call trees, functions “implementing” specific function pointers and so on:

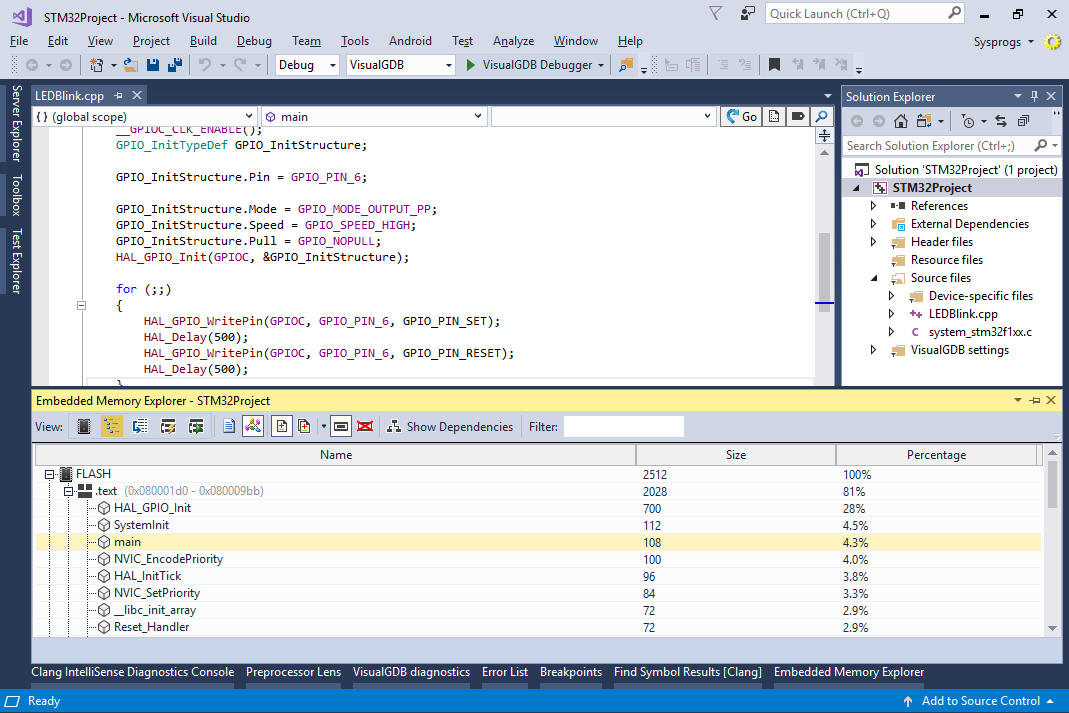
- Use the View->Embedded Memory Explorer to get a detailed report about the structure of your embedded binary, including the locations of sections in memory, sizes of individual functions, their disassembly view and worst-case stack analysis:

You can also use OpenOCD to debug your STM32 projects. Follow the corresponding tutorials for more details.