Debugging Linux Core Dumps with VisualGDB
This tutorial shows how to debug core dumps created by Linux systems when an application crashes. We will first create a program that causes SIGSEGV at a certain point in time, then run it without debugger to let it crash and produce a dump, and finally open the dump file with VisualGDB to analyze the crash.
Note that you don’t have to build an application with VisualGDB in order to debug its core dumps. If you already have a core dump, you can skip the steps 1-7.
Warning: the core debug functionality relies on the Quick Debug command and requires VisualGDB Custom Edition and higher.
- Follow this tutorial to create a simple ‘Hello, World’ application for Linux. We will use CrashDumpTest as the project name.
- Replace the contents of the main cpp file with the following:
#include <stdlib.h>

int main(int argc, char *argv[])
{
    srand(123);
    for (;;)
    {
        int randomVar = rand();
        if ((randomVar % 10) == 0)
            *((int *)0) = 1;
    }
    return 0;
}
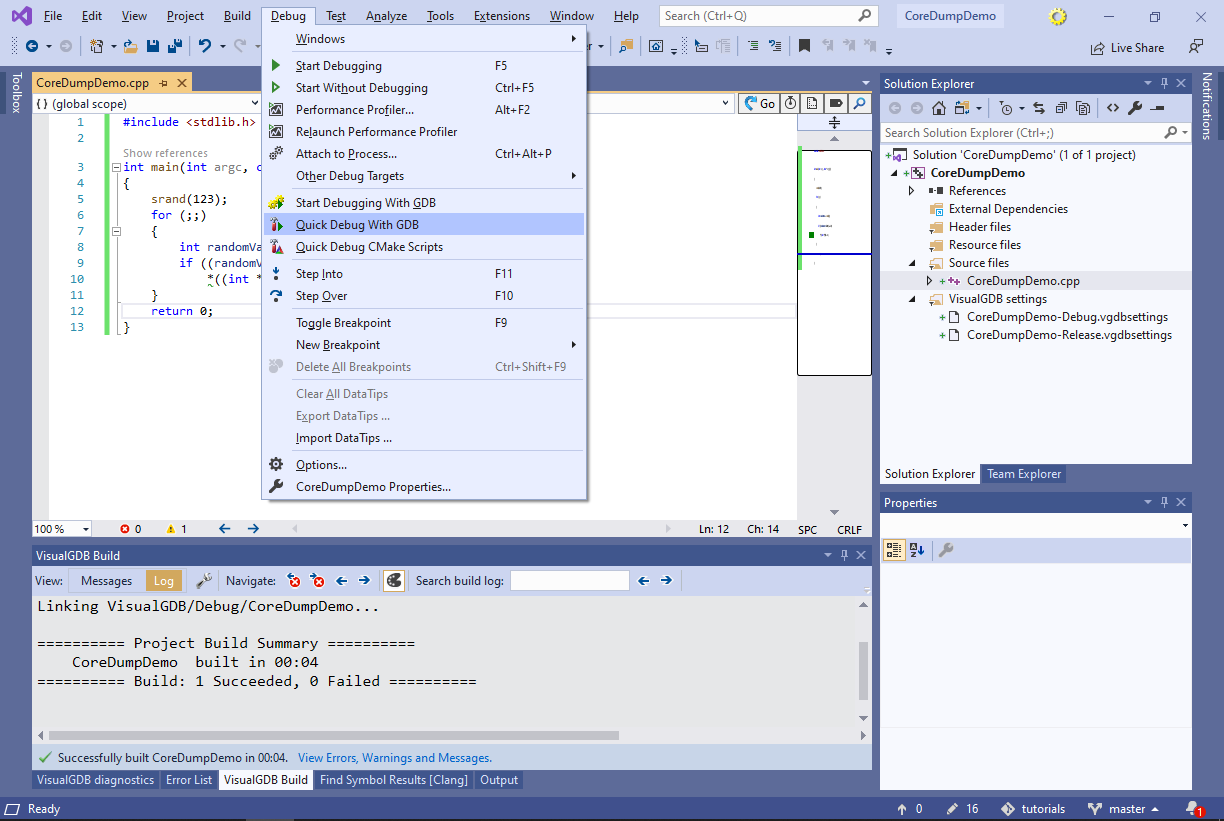
- Build the project by selecting Build->Build Solution:

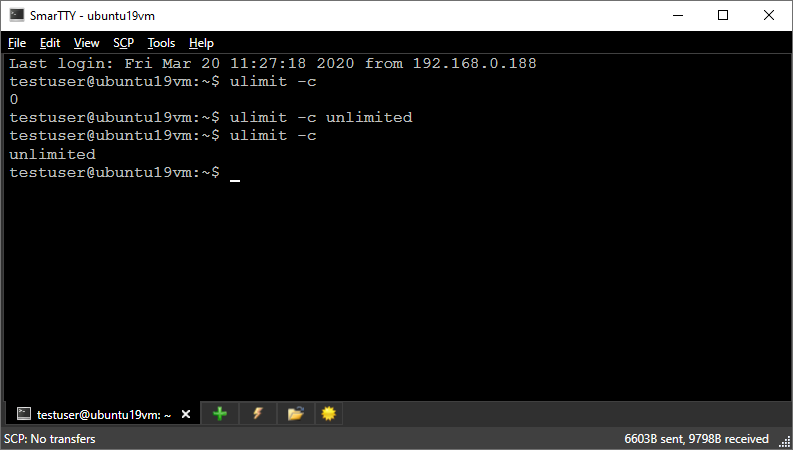
- Open a shell on your Linux computer. Before we can test debugging the core dumps, we need to ensure that they are enabled. Run the ‘ulimit -c‘ command. If the reply is not ‘unlimited’, the core dumps are disabled or limited. Run ‘ulimit -c unlimited‘ to enable creation of core dumps from the current shell session:
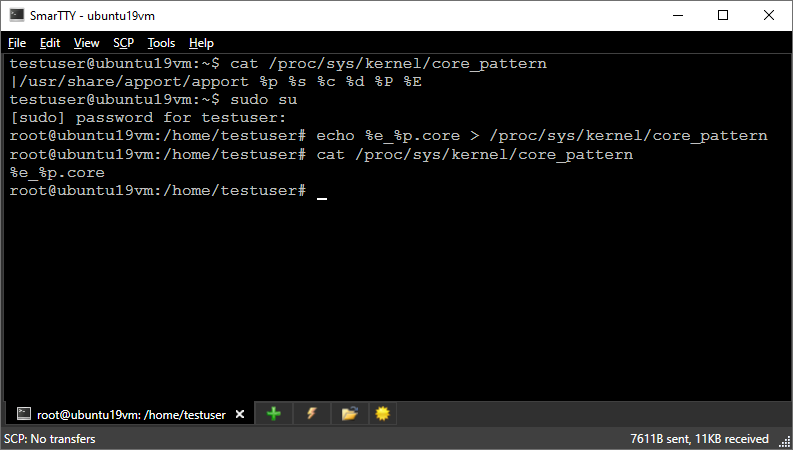
- Now we need to figure out the location where your Linux system will save the core dumps. Run the following command:
cat /proc/sys/kernel/core_pattern
- If the output starts with a ‘|’, the core dumps will be redirected to the specified program instead of being saved to the disk. In that case you need to modify the core file pattern. E.g. to write core dumps to files called <binary name>_<PID>.core in the directory where the binary was launched, run the following commands:
sudo su
echo %e_%p.core > /proc/sys/kernel/core_pattern
You can verify that the changes have been accepted by viewing the contents of core_pattern pseudofile:
- Now we will run our program and let it crash. Go to the directory containing the program binary and run it:
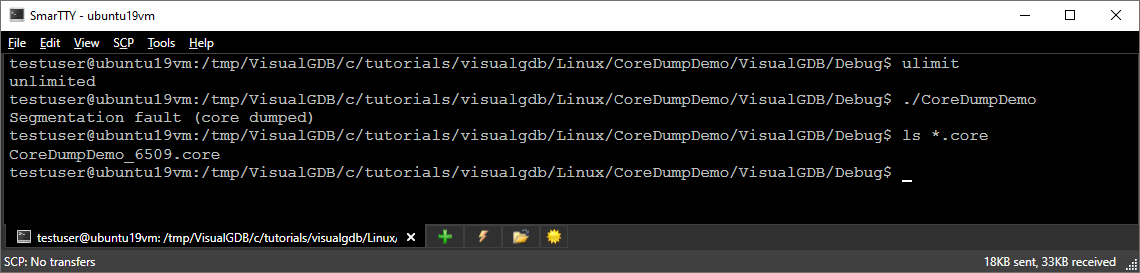 Verify that the dump file has been created by running the ‘ls’ command. In this tutorial we used the ‘%e_%p.core’ pattern, so the core dump file is called ‘CoreDumpDemo_6509.core’. If the file is missing, ensure that the ‘ulimit -c’ is set to ‘unlimited’ and double-check the core pattern setting.
 - Now we will open the Linux core dump file with VisualGDB. In any Visual Studio window (your project does not have to be open) select Debug->Quick Debug with GDB:
- In the Quick Debug dialog click at ‘Linux System’, select your Linux computer and specify program to debug (the main binary) and the core dump path (located in the same directory in this example):
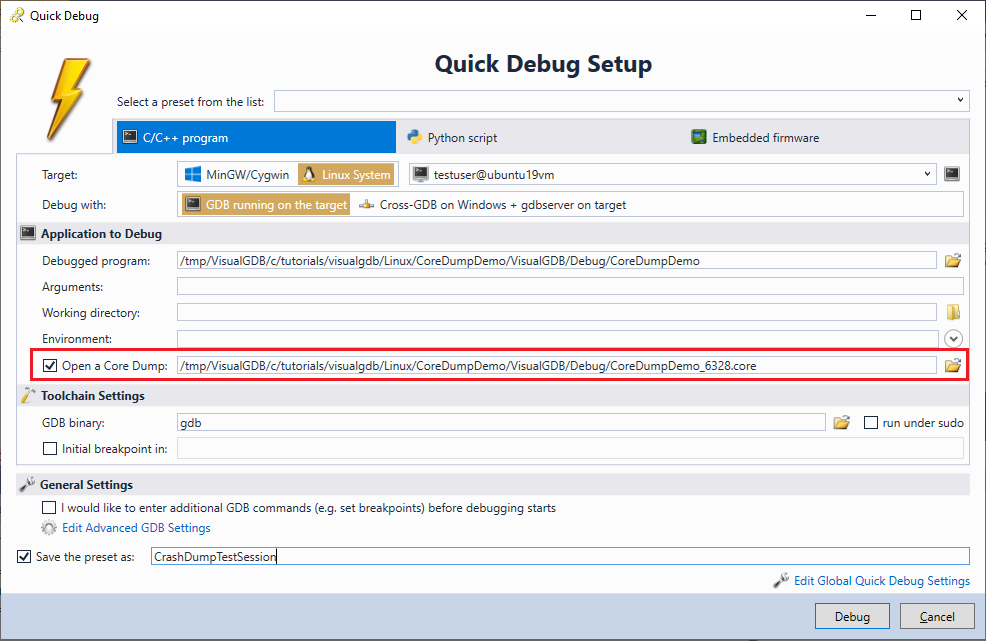
- If you want to reopen this core file (or similarly named files) later, enable the “Save the preset as” checkbox and specify a name. You will be able to quickly load your previous settings next time you open the Quick Debug window by selecting the preset from the list above. Click “Debug” when done.
- VisualGDB will start a debugging session you can hover the mouse over the variables to see their values, see the call stack, use memory, locals and watch windows:
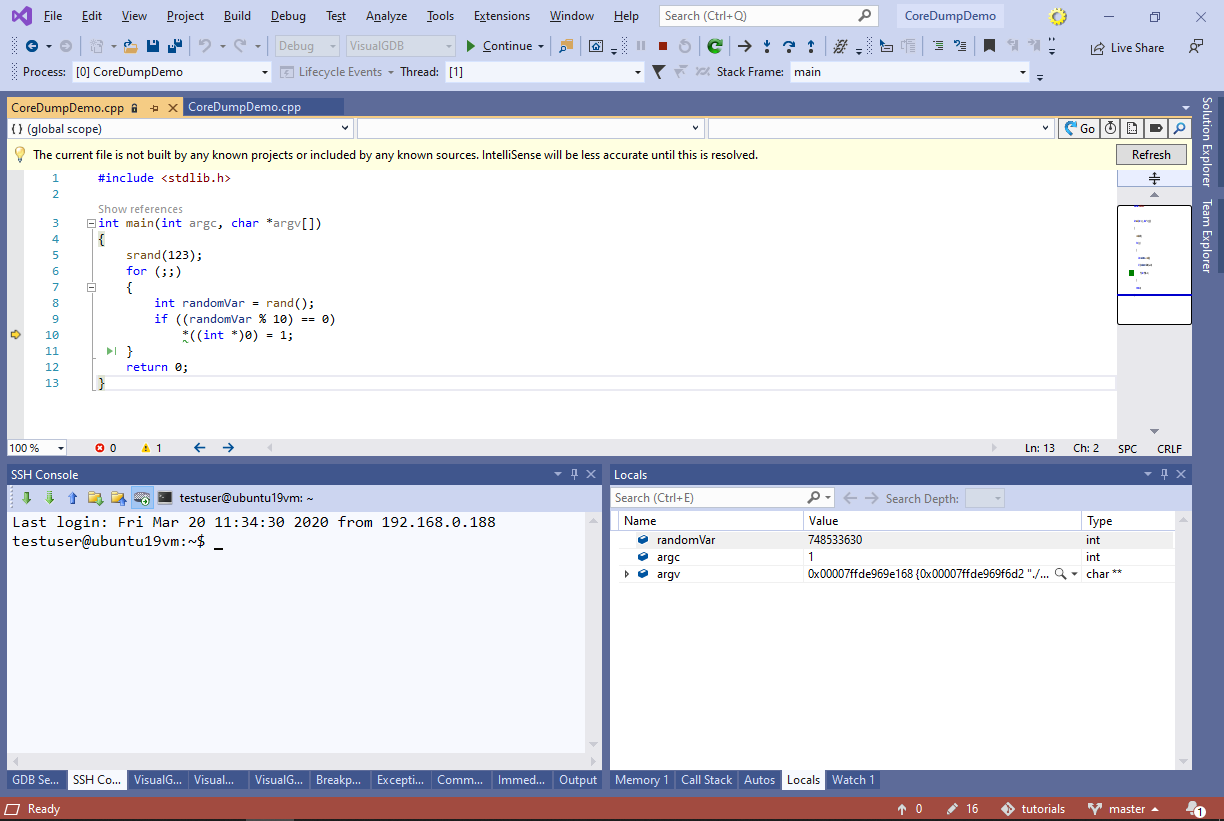 Note that as the dump was loaded independently from the project, VisualGDB would not automatically map the Linux source paths mentioned in the dump file to the corresponding Windows paths, so IntelliSense will not be very precise inside those files.
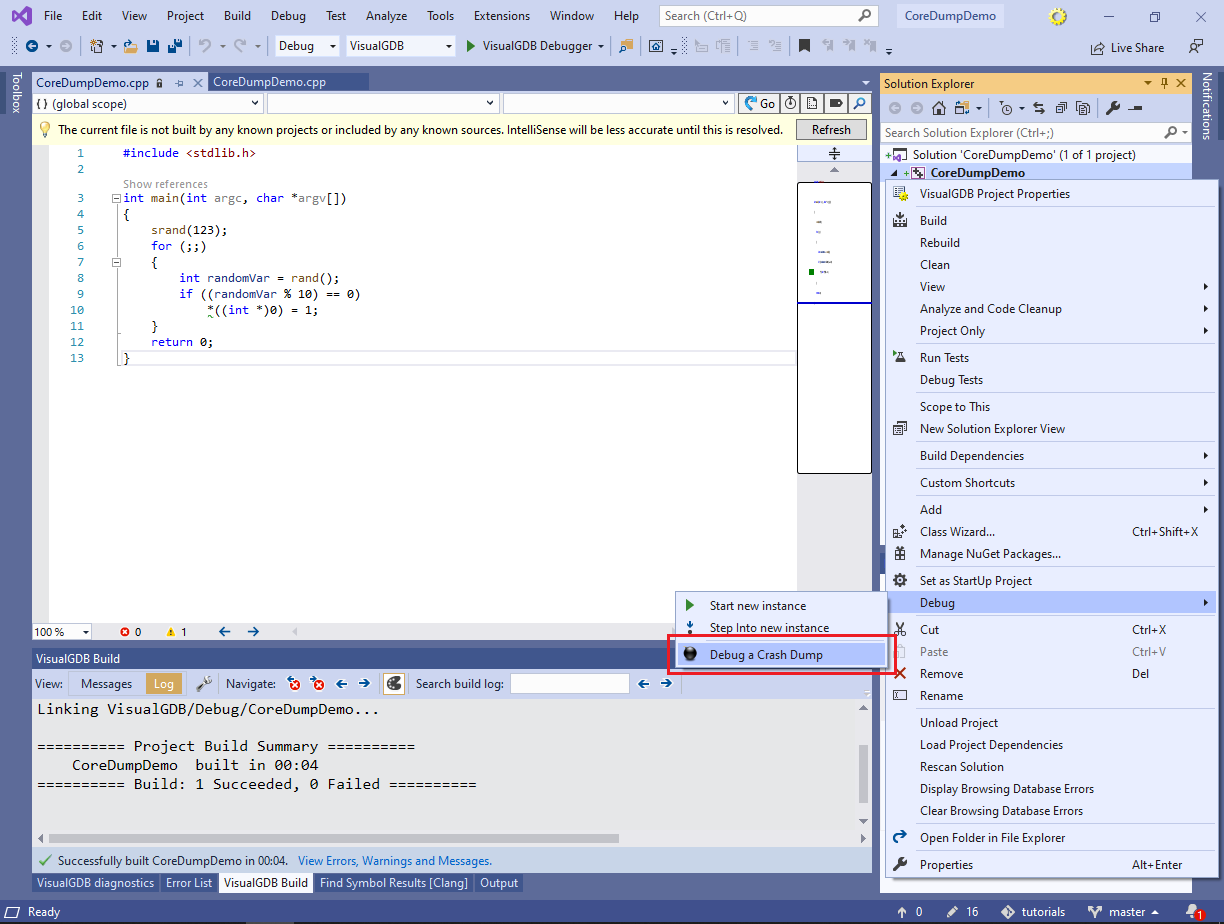
 - If the dump file you are debugging belongs to a project built with VisualGDB, you can avoid using the Quick Debug command and instead use the Debug->Debug a Crash Dump command in Solution Explorer:
- VisualGDB will ask for the location of a dump file on the remote machine and will then open the dump file in the debugger:
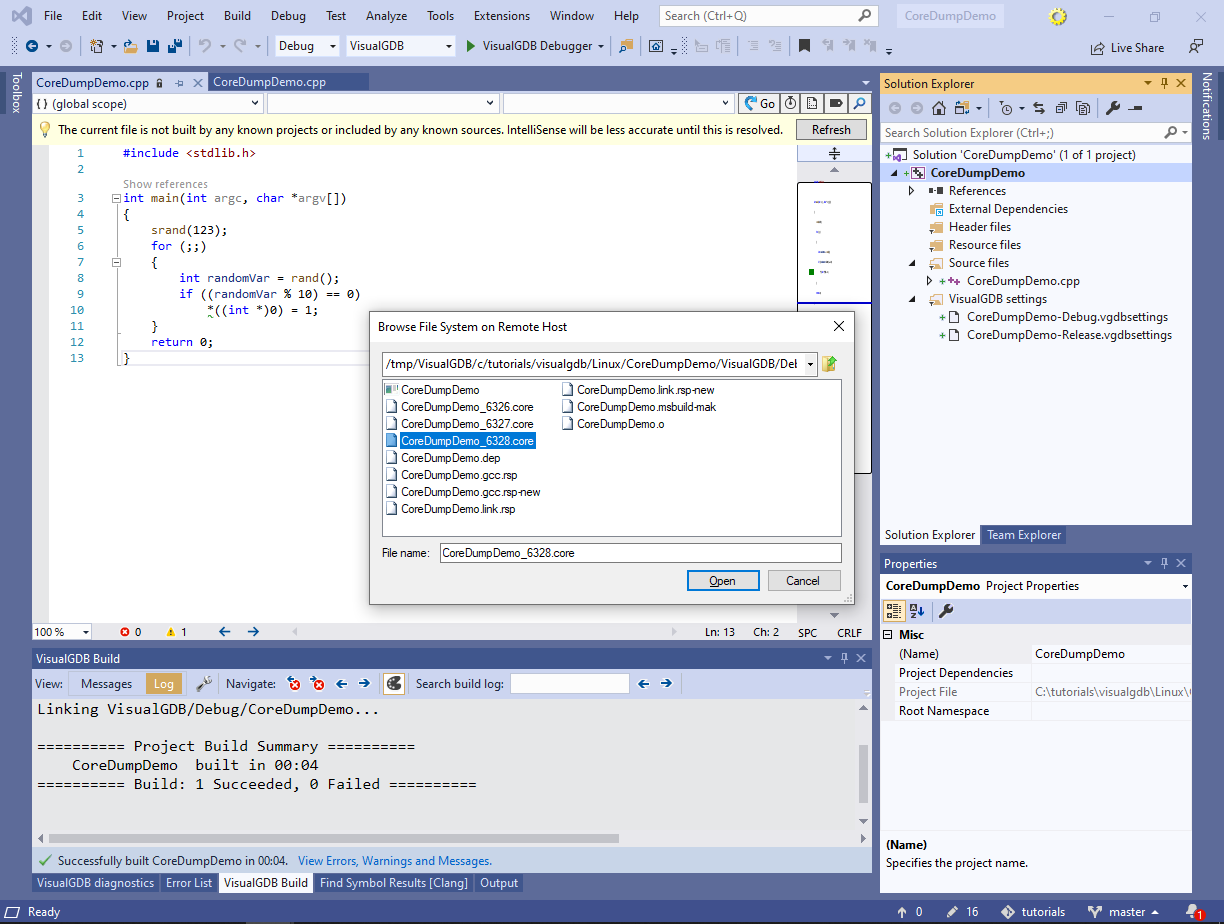
- As VisualGDB will now use the path mappings from the project settings, it will correctly locate all source files inside the project and IntelliSense will work in them as expected:
 Note that the “Debug a Crash Dump” command will only work as long as the project has not been rebuilt after the dump file was created. Otherwise, the dump file will not match the symbols in the project output and the debugger will not be able to interpret it correctly.