Adding support for more platforms to the Embedded Profiler
This tutorial shows how to add support for more platforms to the VisualGDB Embedded Profiler. We will create a project for the Freescale Kinetis FRDM-K64F board and modify the STM32 profiler driver to support the Kinetis board. As of VisualGDB 5.1 Preview 1, the profiler framework contains drivers for STM32, Freescale Kinetis and Nordic nRF51 devices. We use Freescale devices in this tutorial to explain the structure of a driver and explain how to create one.
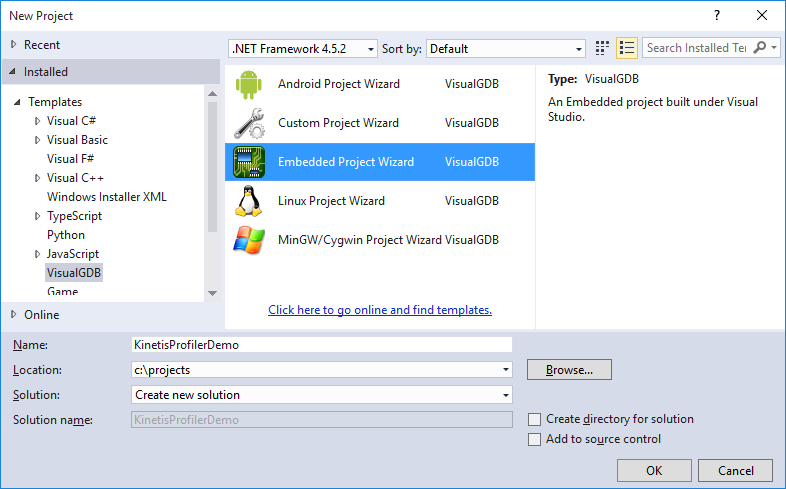
- Create a normal LEDBlink project for your board using the VisualGDB Embedded Project Wizard:
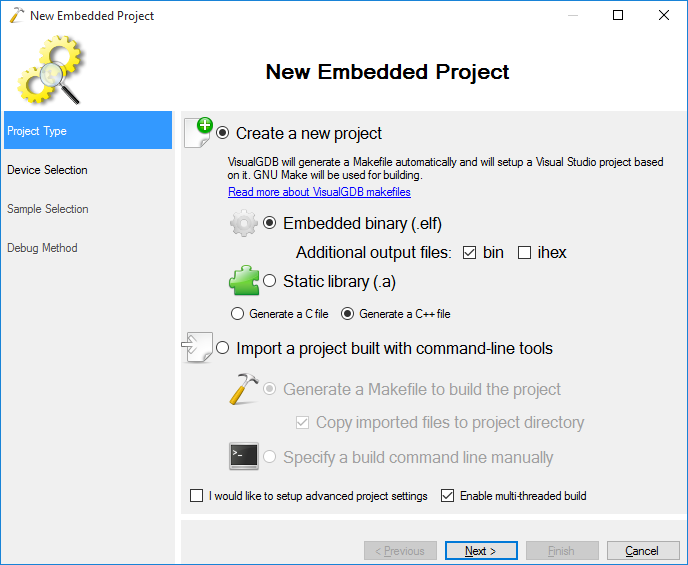
- Use the default “Embedded binary” setting:
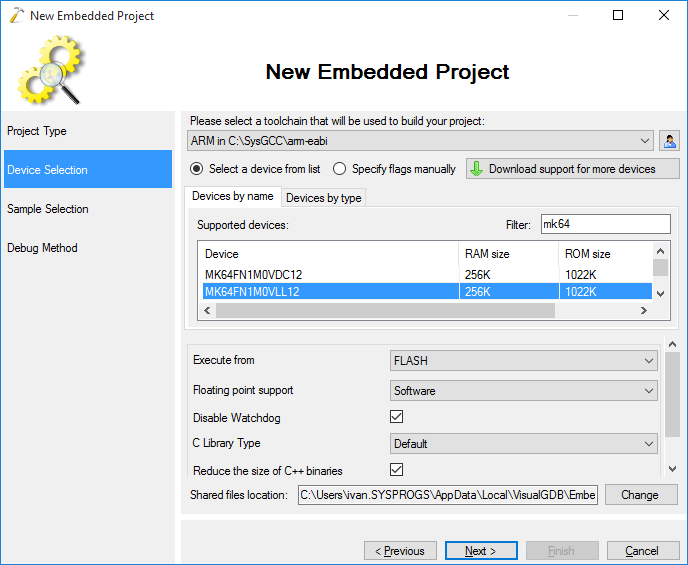
- Select your device and proceed with the default settings for it:
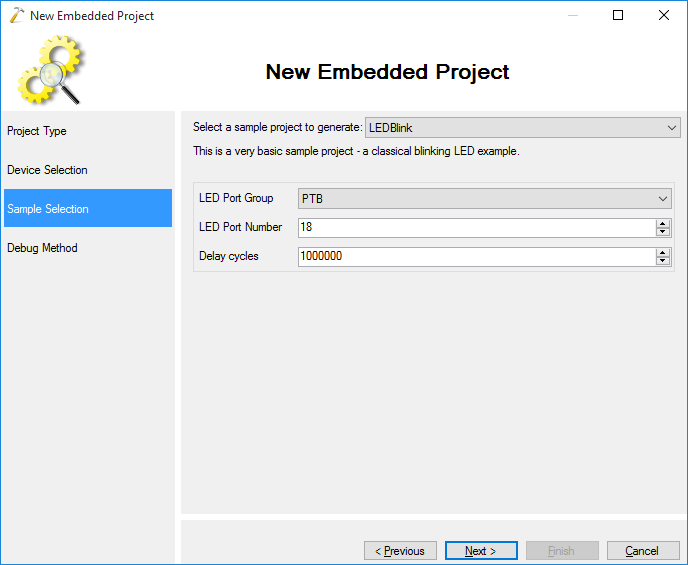
- Select any sample, such as “LEDBlink”:
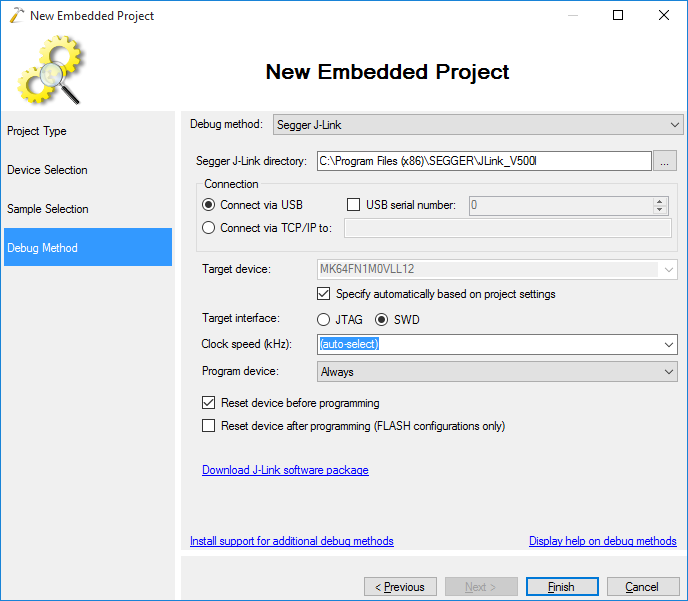
- Select your usual debug method. Note that the profiler will only work with OpenOCD or Segger J-Link:
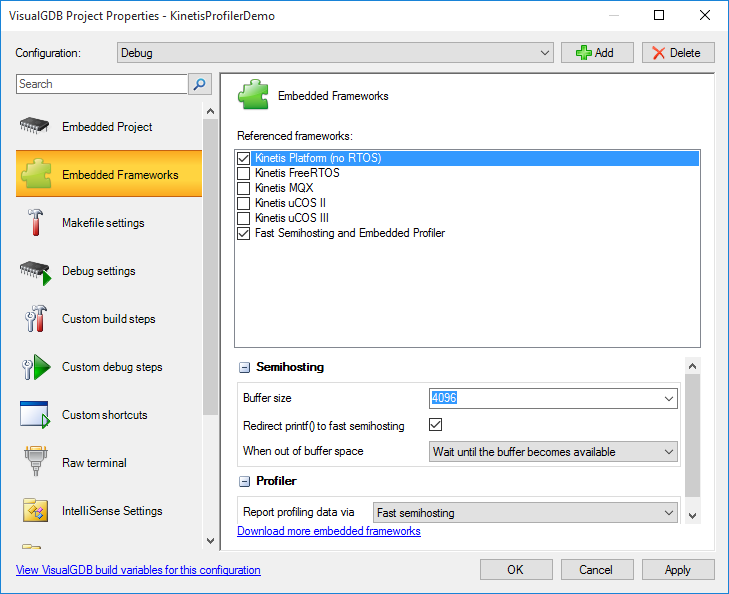
- Press Finish to create your project. Then open VisualGDB Project Properties, go to the Embedded Frameworks page and reference the Fast Semihosting and Embedded Profiler framework. For Kinetis devices also reference the Kinetis Platform framework as it actually contains the drivers for the timers the profiler uses:
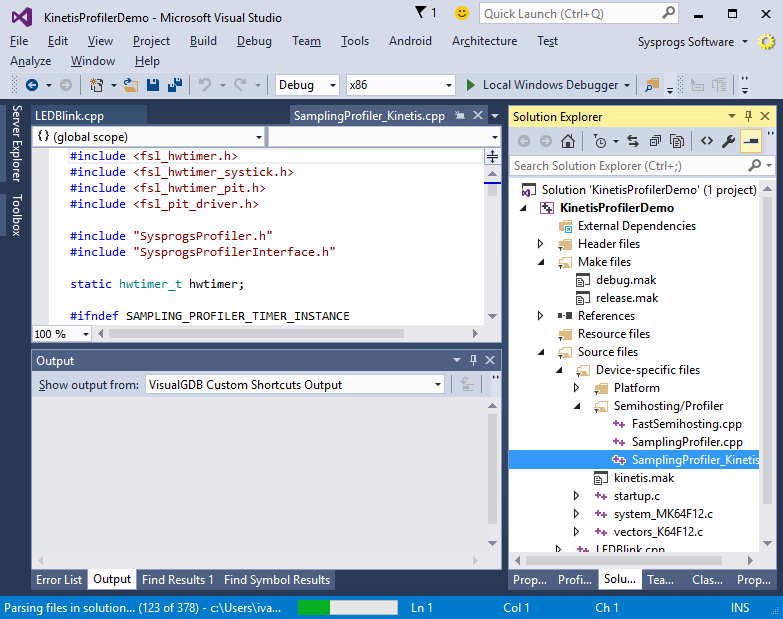
- The profiler framework already contains a driver for the Kinetis devices, however in this tutorial we will delete it and create one by modifying the STM32 driver to show all the necessary steps. Remove the SamplingProfiler_Kinetis.cpp file from your project:
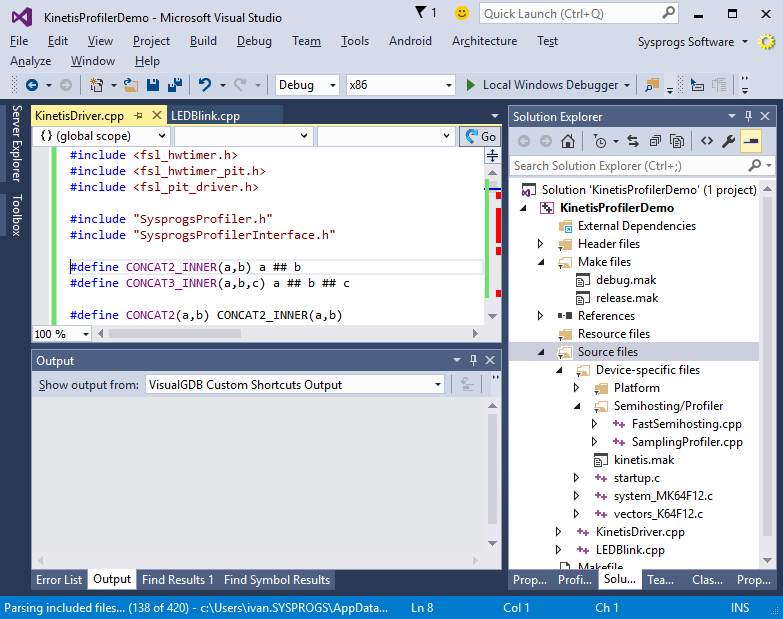
- Then create a new source file and copy the contents of the %LOCALAPPDATA%\VisualGDB\EmbeddedEFPs\Profiler\SamplingProfiler_STM32_HAL.cpp file there. Replace the #include<> statements with the statements for your platform. For Kinetis devices we will need to include fsl_hwtimer.h, fsl_hwtimer_pit.h and fsl_pit_driver.h:
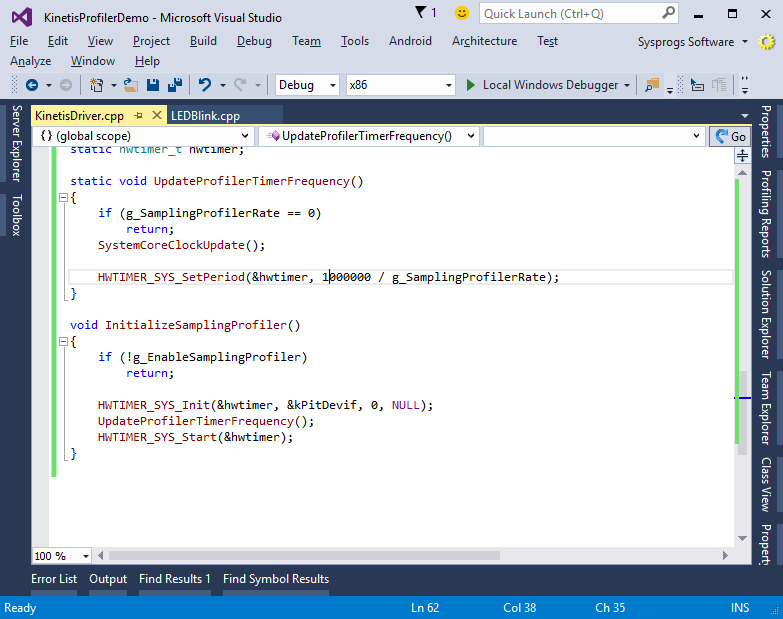
- The first step in creating the driver is providing an initialization function that configures a hardware timer to fire periodic interrupts. You should also provide a function to change the timer frequency during runtime, as the automatic rate logic uses it. In this example we will use the channel 0 of the periodic interrupt timer (PIT0):
static hwtimer_t hwtimer;

static void UpdateProfilerTimerFrequency()
{
    if (g_SamplingProfilerRate == 0)
        return;
    SystemCoreClockUpdate();

    HWTIMER_SYS_SetPeriod(&hwtimer, 1000000 / g_SamplingProfilerRate);
}

void InitializeSamplingProfiler()
{
    if (!g_EnableSamplingProfiler)
        return;

    HWTIMER_SYS_Init(&hwtimer, &kPitDevif, 0, NULL);
    UpdateProfilerTimerFrequency();
    HWTIMER_SYS_Start(&hwtimer);
}
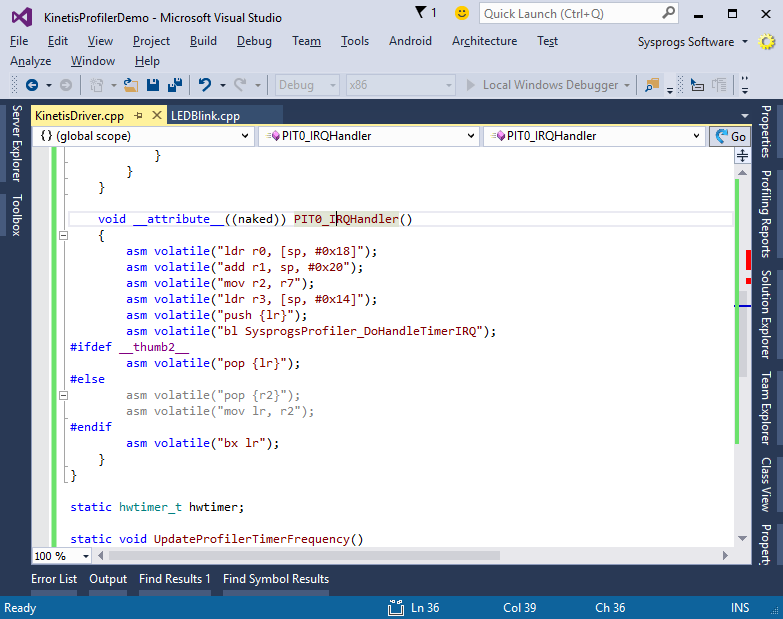
- The second step of writing a profiler driver is handling the interrupts fired by the timer and extracting the PC, SP, FP and LR register. Thankfully, all ARM Cortex cores share the same interrupt handling mechanism that stores those registers in a common pattern, so you can simply reuse the handler from the STM32 driver. Rename it accordingly and don’t forget to put extern “C” around it:
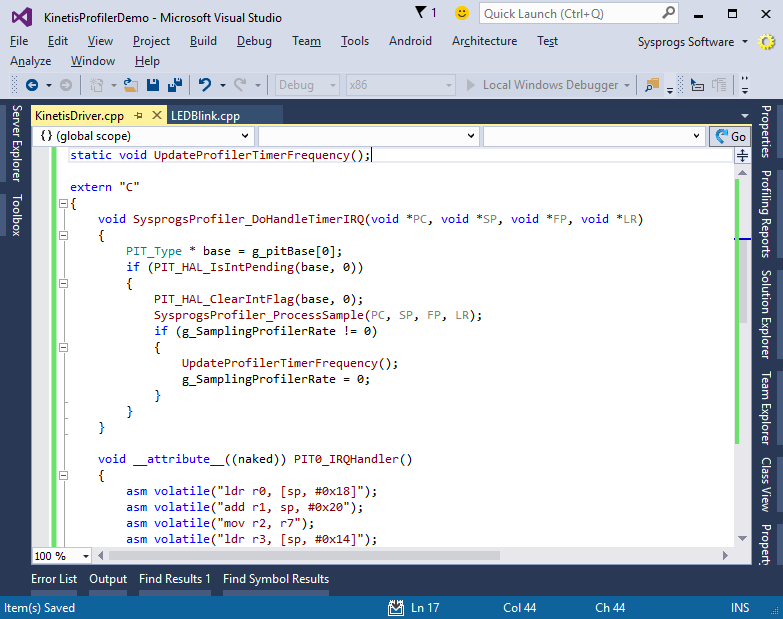
- The third and the final step is to tell the timer that the interrupt is being handled and invoke the SysprogsProfiler_ProcessSample() function with the PC, SP, FP and LR register values extracted from the stack:
    void SysprogsProfiler_DoHandleTimerIRQ(void *PC, void *SP, void *FP, void *LR)
    {
        PIT_Type * base = g_pitBase[0];
        if (PIT_HAL_IsIntPending(base, 0))
        {
            PIT_HAL_ClearIntFlag(base, 0);
            SysprogsProfiler_ProcessSample(PC, SP, FP, LR);
            if (g_SamplingProfilerRate != 0)
            {
                UpdateProfilerTimerFrequency();
                g_SamplingProfilerRate = 0;
            }
        }
    }
 Note the code checking the g_SamplingProfilerRate variable. If the automatic rate adjustment is enabled, the logic inside SysprogsProfiler_ProcessSample() may decide to adjust the timer frequency. If it does that, the g_SamplingProfilerRate will be set and your driver is responsible for applying it.
 - Do not forget to call InitializeSamplingProfiler() from your main() function and you are good to go. Build your project and select Analyze->Analyzer Performance with VisualGDB to start profiling:
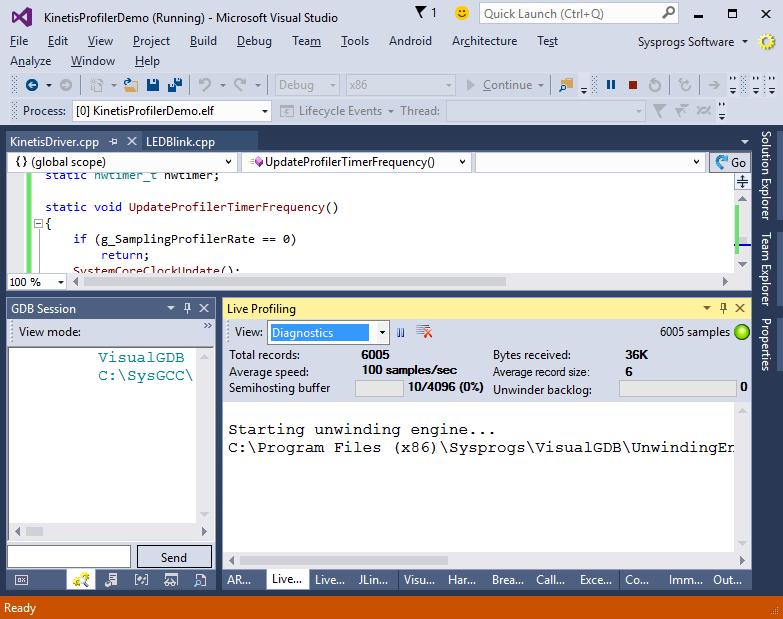
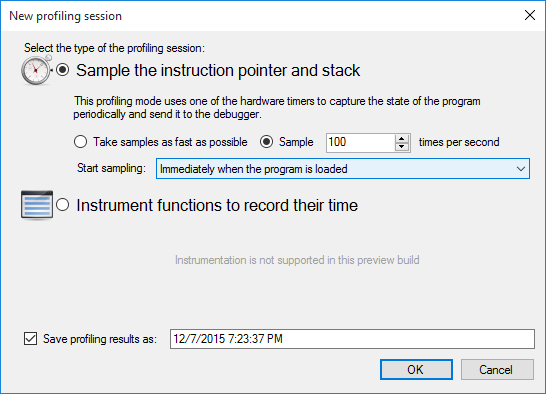 In this example we will select a fixed rate of 100 samples/second to check that the rate is set correctly.
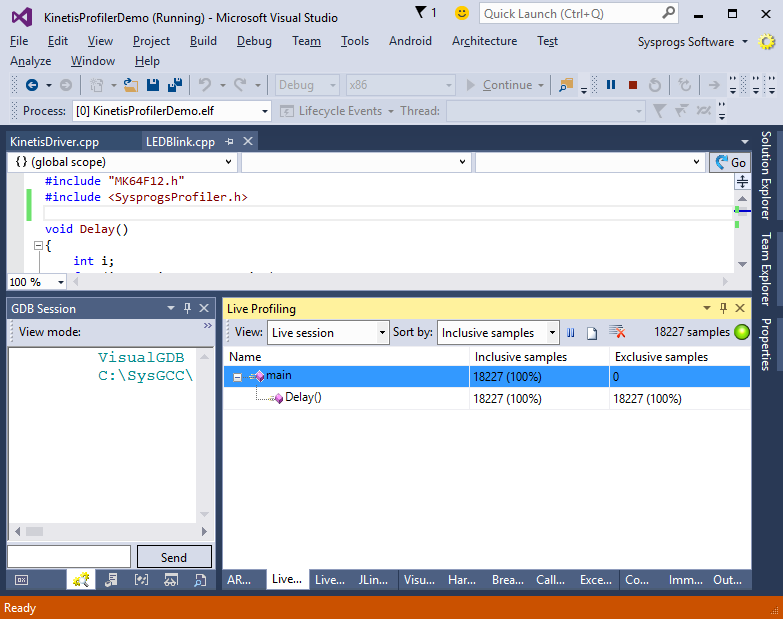
 - Observe the Live Profiling window to see that the samples are arriving and that the stack trace matches the expected one:
- You can switch the view to the Diagnostics mode to see various information about the profiling session. Verify that the speed matches the one selected when you started the session. If not, modify your driver to do the necessary adjustments to match the requested speed: