Creating Freescale Kinetis projects with Visual Studio
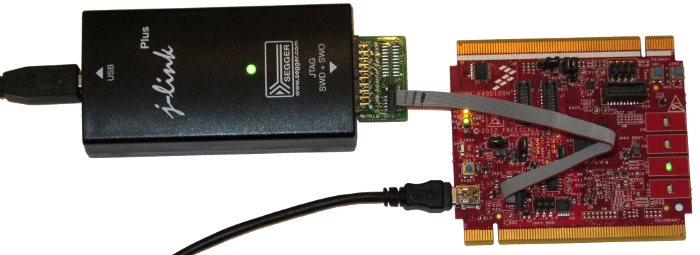
This tutorial shows how to develop a basic project for a Freescale Kinetis microcontroller (we will use TWR-KD40D100M module here) using Visual Studio, the built-in OSBDM/OSJTAG circuit and an external JTAG/SWD programmer.
Before we begin, ensure that VisualGDB 4.1 or later is installed.
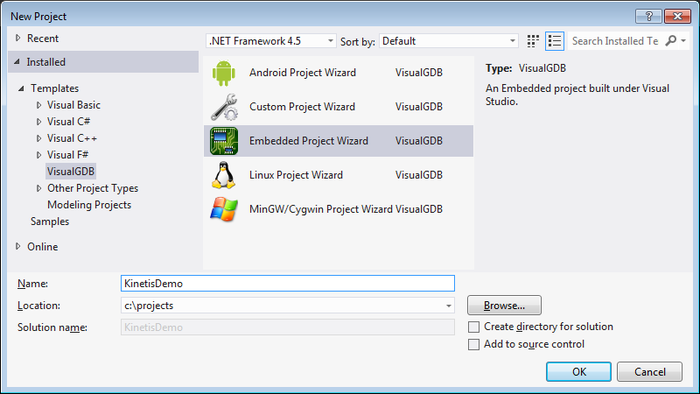
- Start Visual Studio. Open File->New->Project. Select VisualGDB Embedded Project Wizard and enter your project name and location:
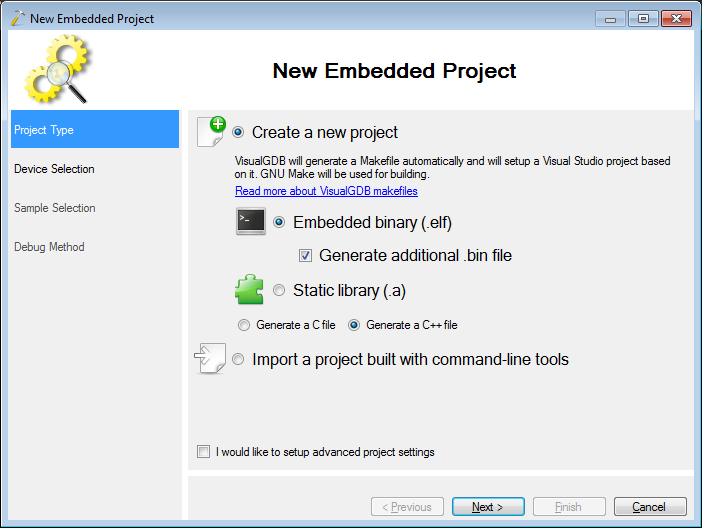
- The first page allows selecting project type. We do not need to change anything here now:
- On the second page select the arm-eabi toolchain. If it’s not installed, VisualGDB will allow downloading and installing it automatically. Select the MK40DX256xxx10 device (TWR-K40D100M uses PK10DX256VMD10 MCU that is equivalent to MK10DX256VMD10):
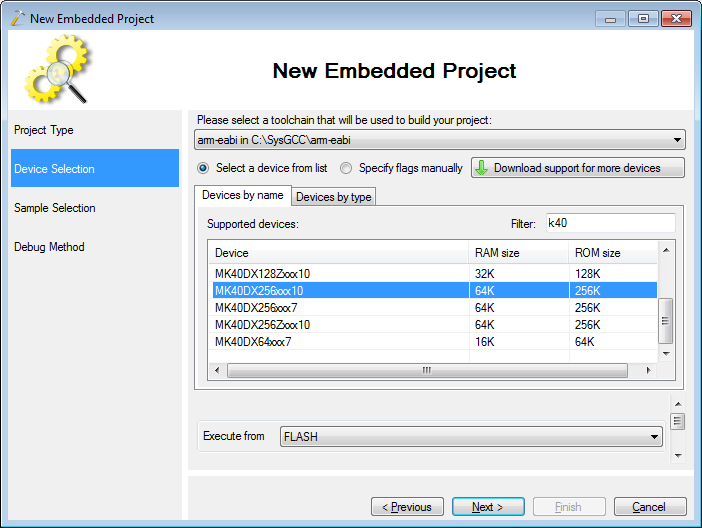
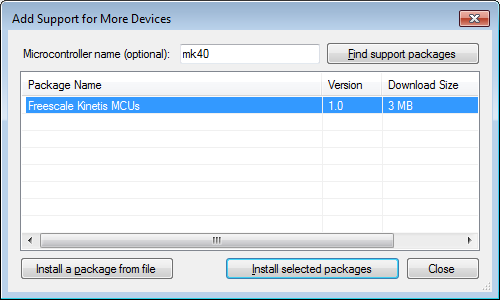
- If you don’t see Freescale devices in the list, click “Download support for more devices” and select “Freescale Kinetis” from the list:
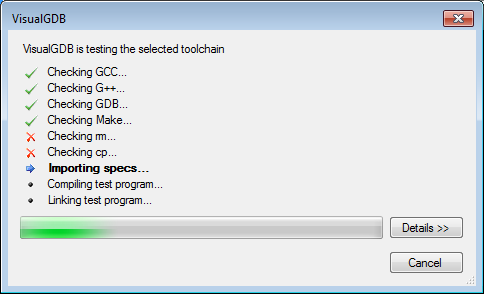
- Once you continue to the next page VisualGDB will test the ARM toolchain to ensure that it can build valid projects for the selected device:
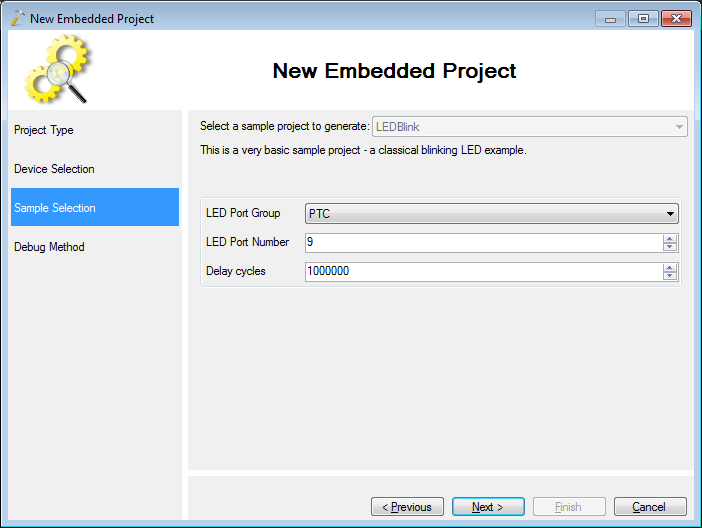
- The next page allows customizing the generated project. As the TWR-K40D100M board has a green LED connected to PTC9, select “PTC” and “9” as the LED port group and port number:
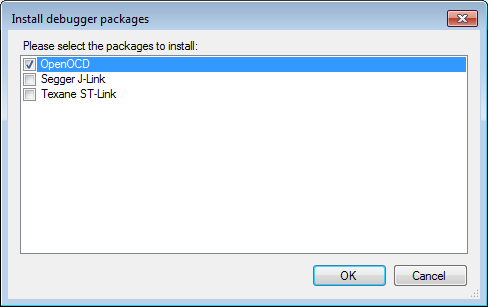
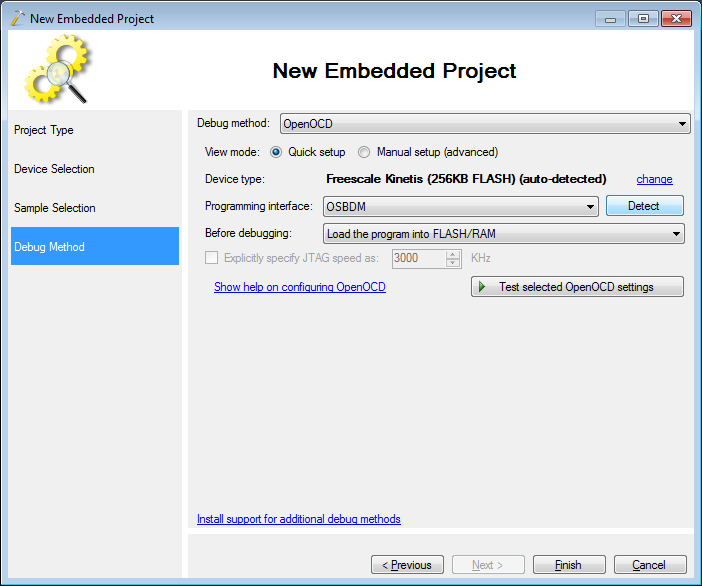
- The last page allows selecting the debug method. We will use the OpenOCD tool to debug our board using on-board OSJTAG/OSBDM interface. Click “Install support for additional debug methods” and select OpenOCD:
- Select “OSBDM” as the interface and press “Test selected OpenOCD settings”:
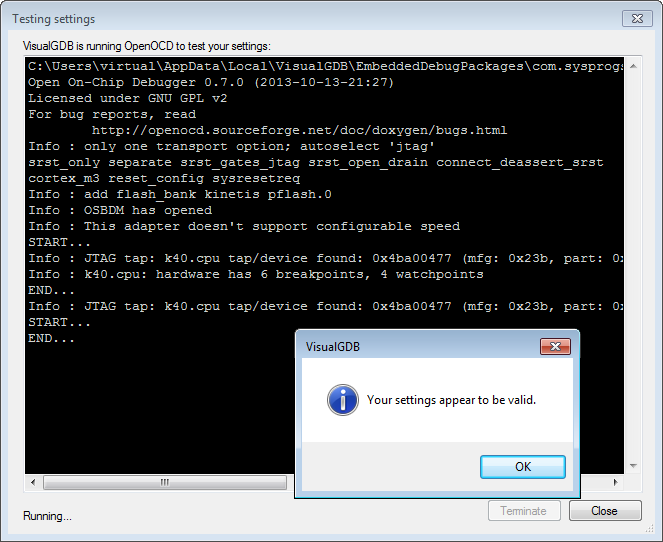
- VisualGDB will run OpenOCD and ensure that it can find your device:
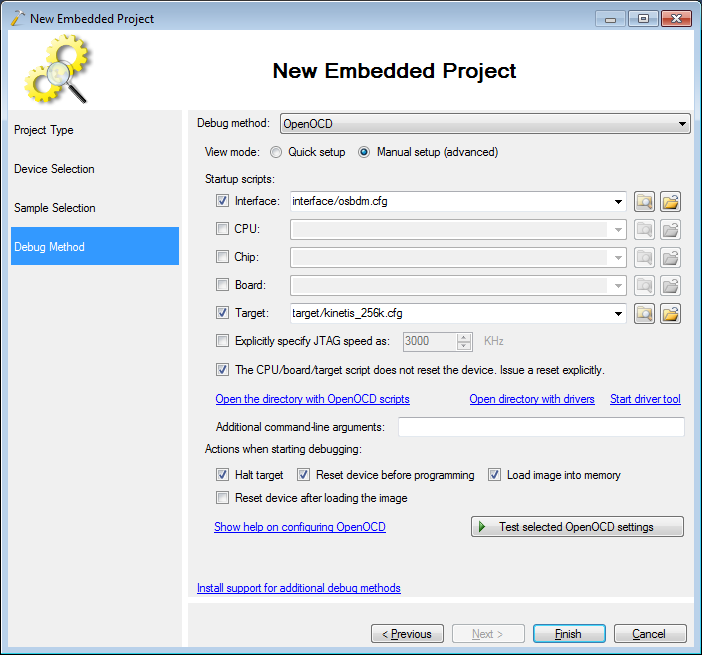
- You can also switch to the manual mode and change OpenOCD scripts explicitly:
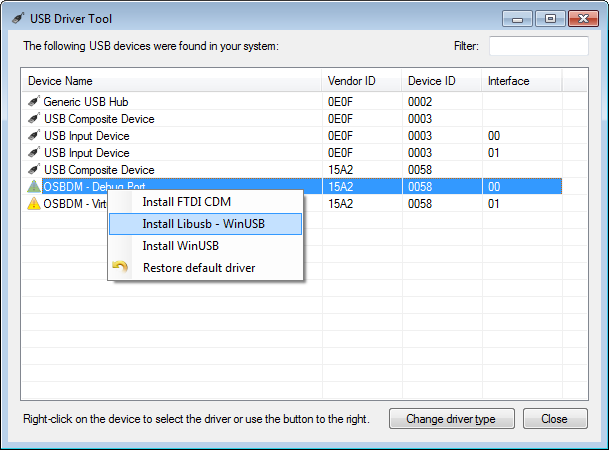
- If OpenOCD refuses to find your device, you may need to install the LibUSB driver for it manually:
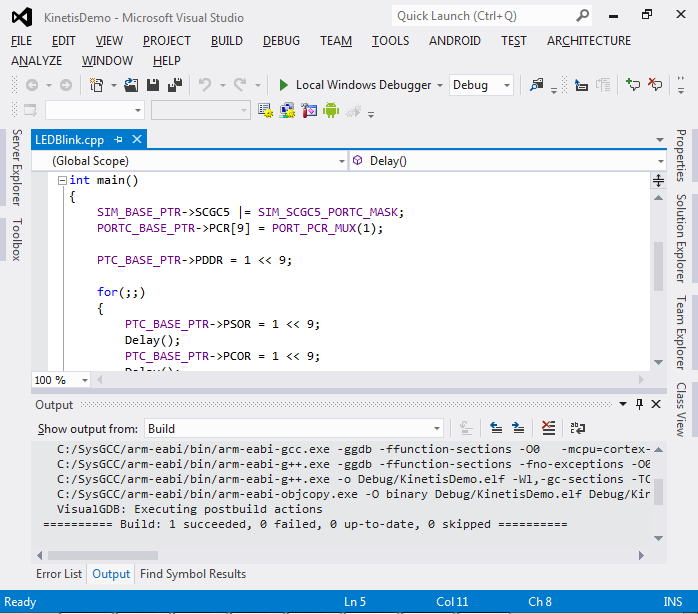
- Press “Finish” to complete the wizard. VisualGDB will generate a basic Visual Studio project. Press Ctrl-Shift-B to build it:
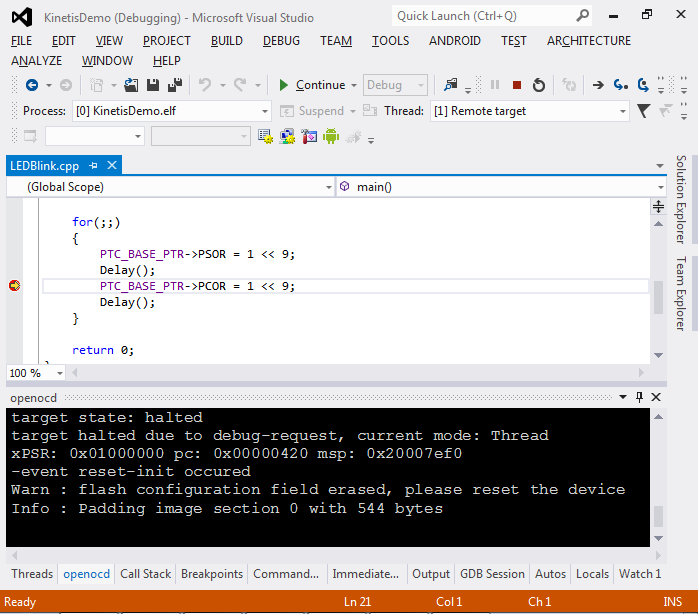
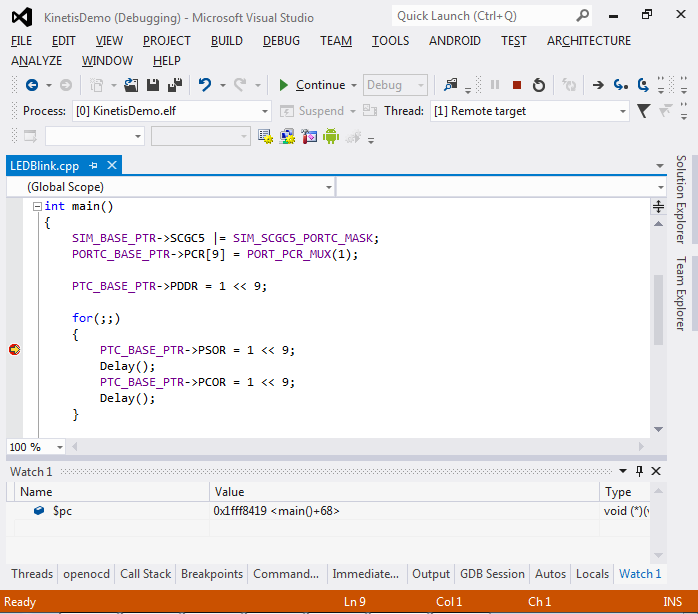
- Press F5 to start debugging. The green LED will start blinking slowly. Put a breakpoint on the PCOR line and wait until it is hit:
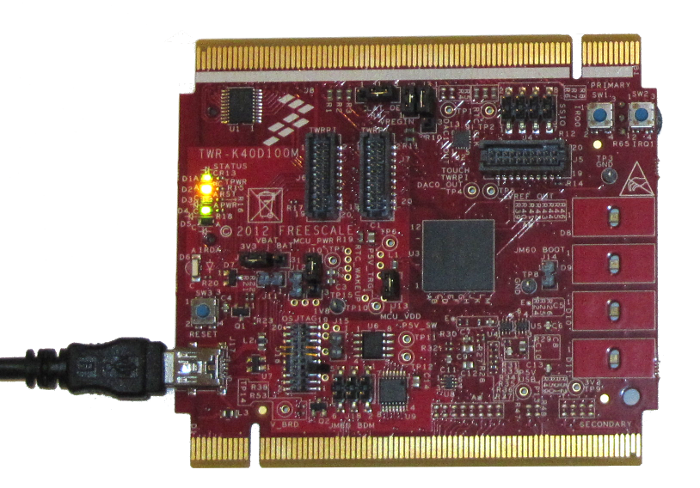
- See how the green LED on the right side of the board is currently off:
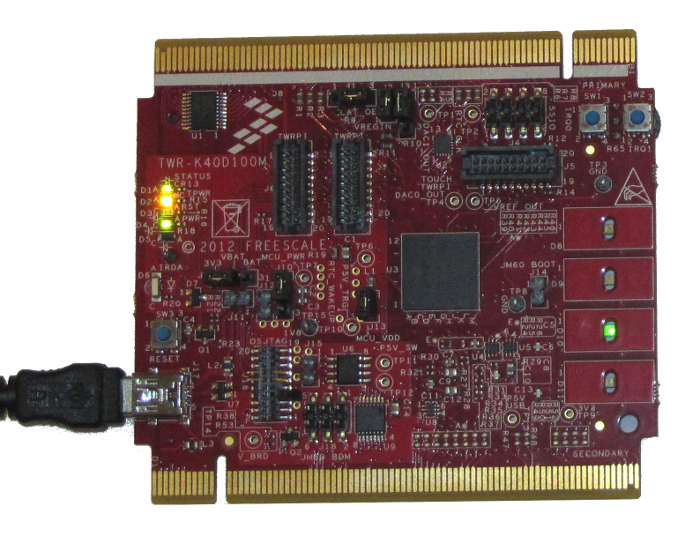
- Press F10 to step over the line. See how the green LED turns on:
- Currently we have built our project to go into the
FLASH memory. It means that the previous FLASH contents were
replaced by our test program, taking some time and consuming
rewrite cycles. We can avoid it by making the program run
from SRAM. Stop debugging by pressing Shift-F5, right-click
on the project in Solution Explorer and select VisualGDB
Project Properties. Click “Change settings” and select
“SRAM” in the bottom of the page: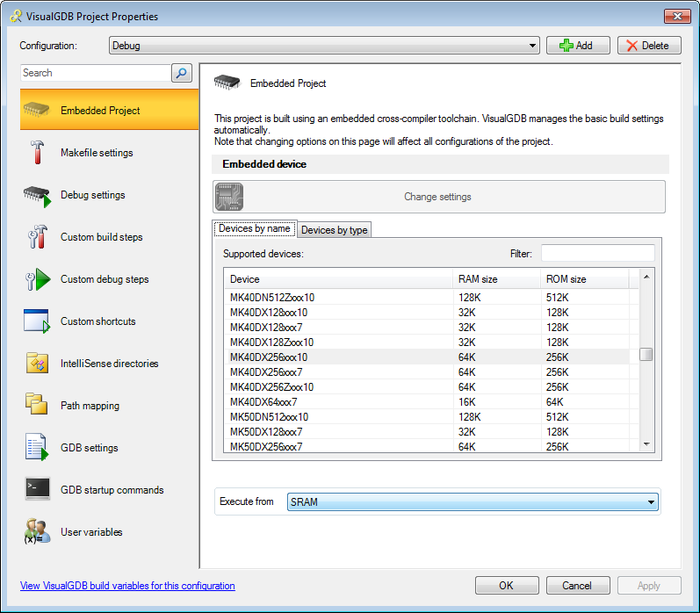
- Press OK, rebuild your project and start debugging it. Put a breakpoint somewhere and examine the $pc value ($pc is the program counter register that holds the address of the current instruction). You will see that it points inside the SRAM region as our program is now running from SRAM:
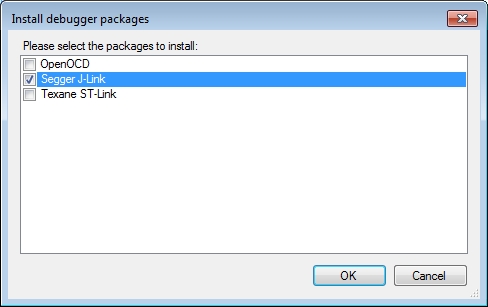
- Using OpenOCD with the built-in OSJTAG/OSBDM interface can be slow and instable. As an alternative you can use a third-party JTAG/SWD programmer/debugger. In this tutorial we will show how to use Segger J-Link to debug your firmware. Open VisualGDB Project Properties, go to Debug Settings page, click “Install Support for additional debug methods” and select Segger J-Link:
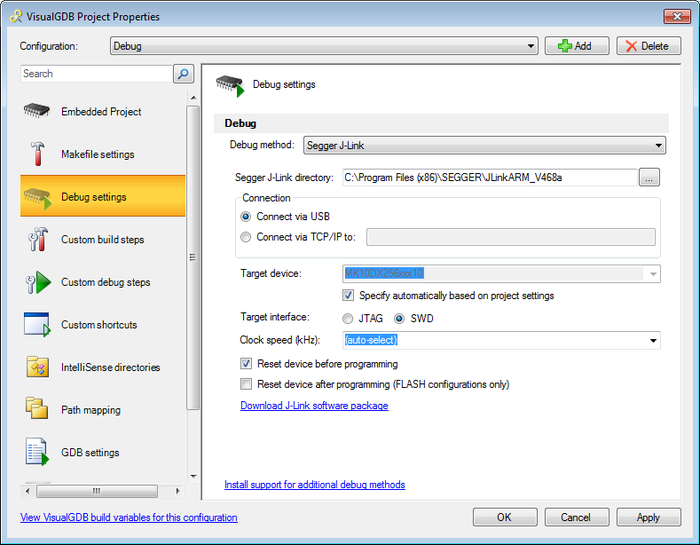
- Specify the path to your Segger tools and select the SWD interface:
- Connect the debugger to the OSJTAG port on the board using the Cortex adapter. Press F5 to start your debugging session: