Debugging Arduino AVR boards with Visual Studio
This tutorial shows how to debug the AVR-based Arduino boards using Visual Studio and the Advanced Arduino Project Subsystem of VisualGDB. Before you begin, install VisualGDB 5.4 Preview 4 or later, get an AVR debug probe (e.g. AVR Dragon) and follow our basic Arduino tutorial to create a simple project.
Warning: due to the limitations of the AVR architecture, the AVR devices need to be explicitly switched between the production mode (DWEN fuse not set) and the debug mode (DWEN fuse set). Enabling the debug mode makes regular FLASH programming via bootloader unusable; disabling it makes the debugging impossible. For all new designs, we recommend using ARM-based or ESP32-based devices that don’t have this limitation. If you are already using an AVR-based Arduino board, follow the instructions in this tutorial to enable and disable the debug mode.
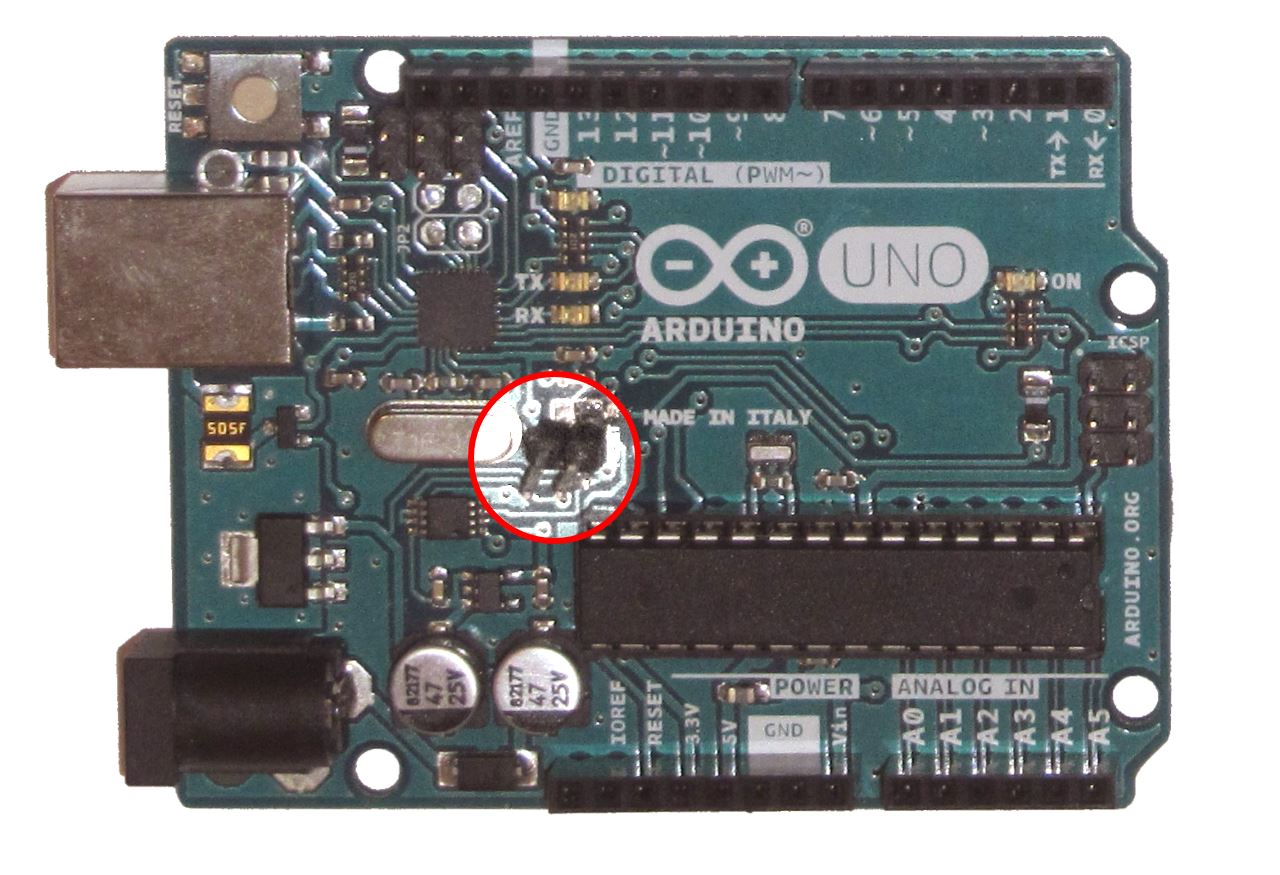
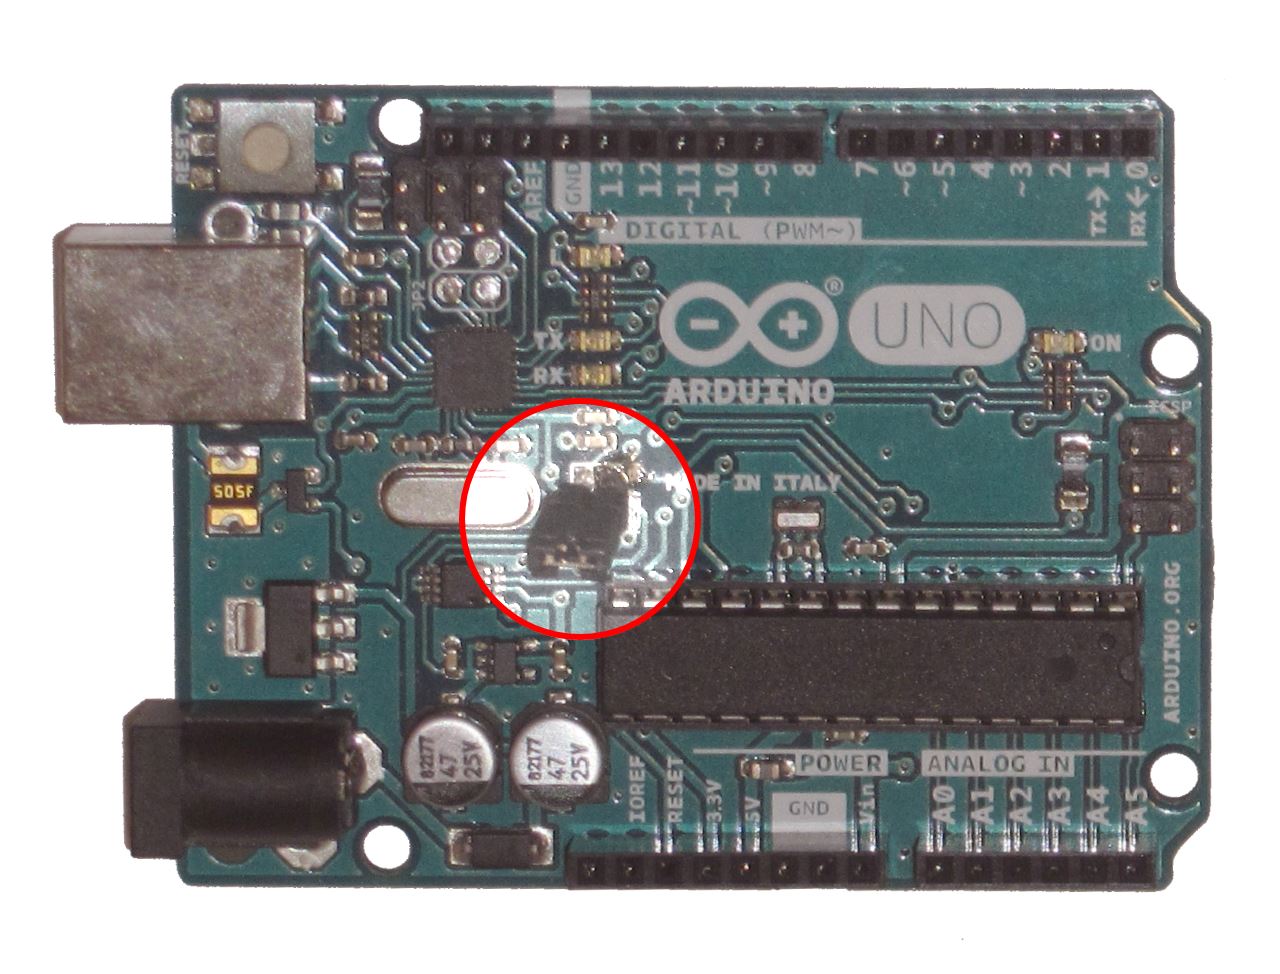
- The original Arduino Uno board contains a capacitor that facilitates resetting the board into bootloader programmatically, however this capacitor prevents the AVR debug probes from debugging the board properly. Before we proceed with debugging, we need to modify the board to allow disconnecting the capacitor. Locate the “RESET-EN” pad on the board (see the schematic) and cut the line between the 2 pads. Then solder a pair of jumper terminals to the pads:
 As long as the jumper is not installed, the board can be debugged using an AVR debug probe, however programming FLASH memory via a bootloder won’t work. Installing the jumper will prevent debugging, but will restore the original bootloader functionality.
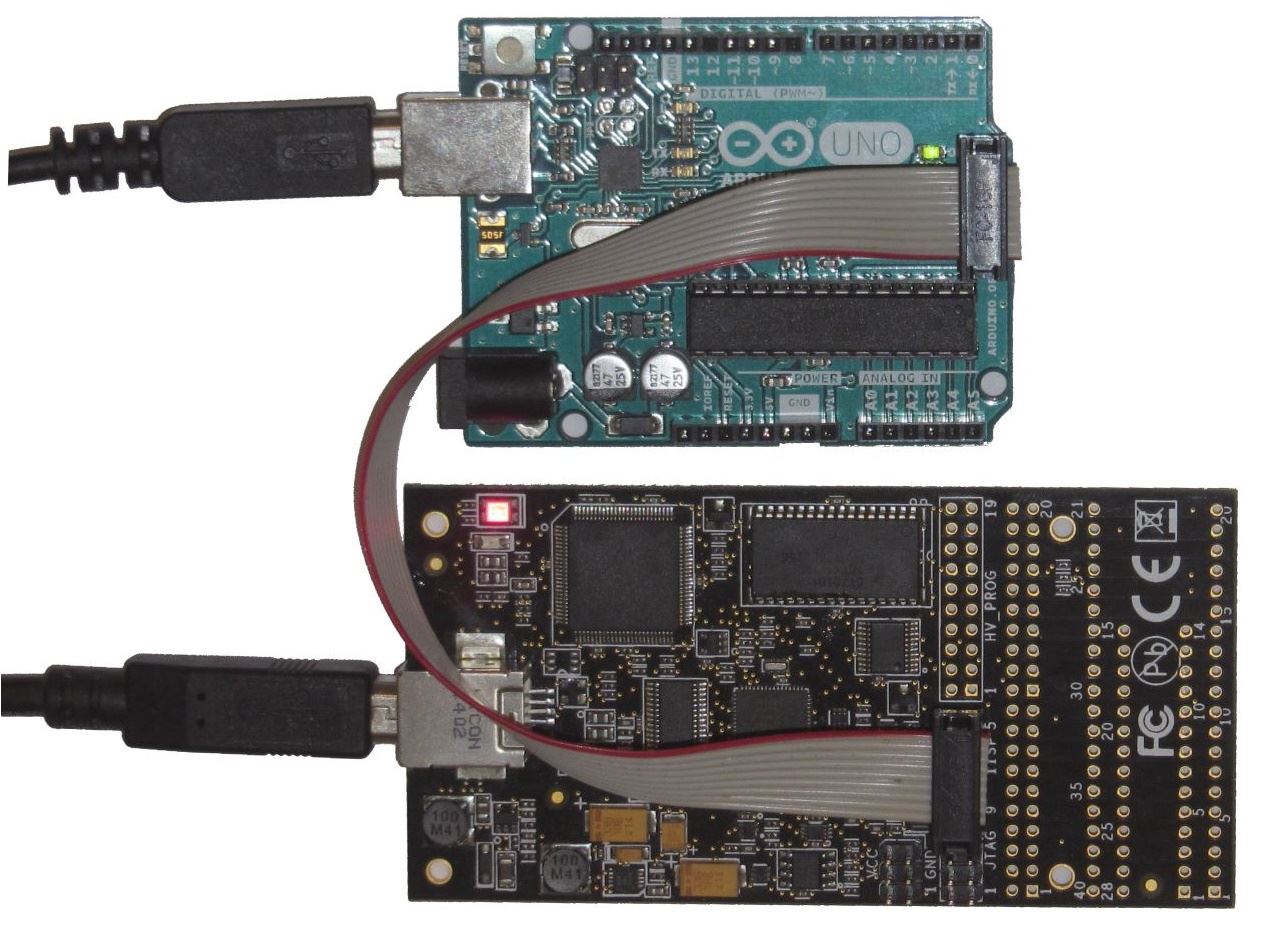
 - Connect your AVR debug probe to the ICSP connector on the Arduino Uno board:
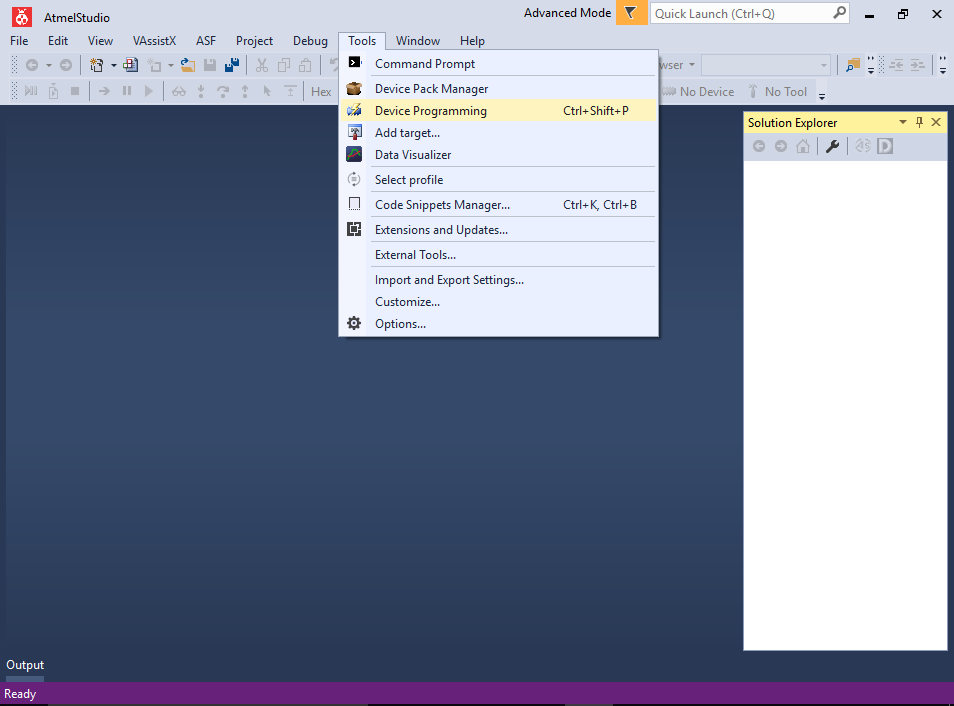
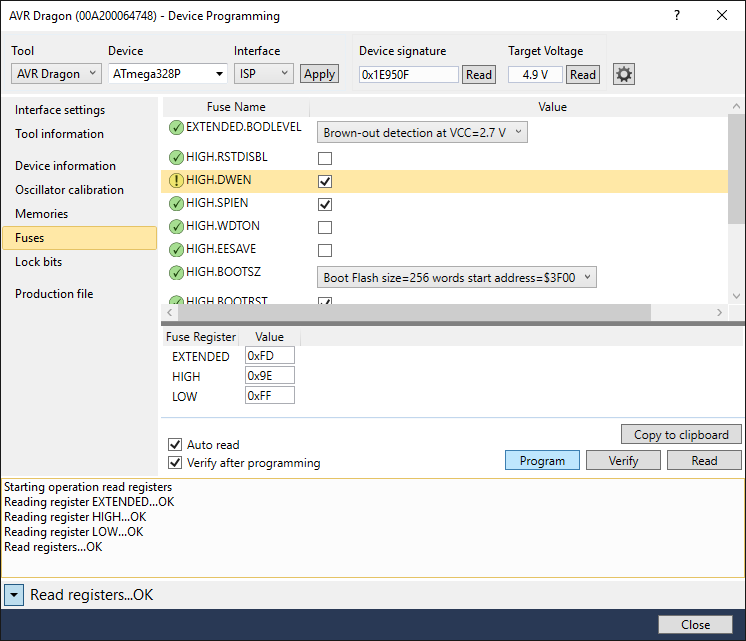
- The last step required before we can proceed with debugging is to program the DWEN fuse on the device. The easiest way to do this is via the Tools->Device Programming command in Atmel Studio:
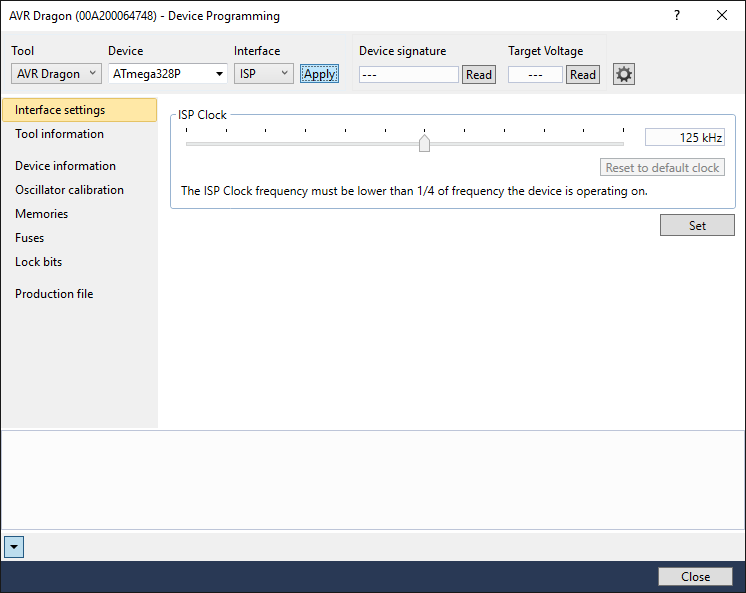
- Select your AVR probe and the device (ATmega328P for AVR Uno) and click “Apply”:
- Then set the “HIGH.DWEN” fuse and click “Program”:
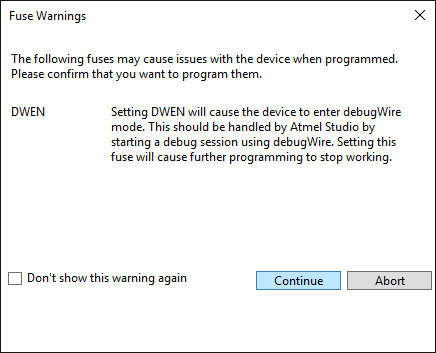
- Click “Continue” to confirm programming:
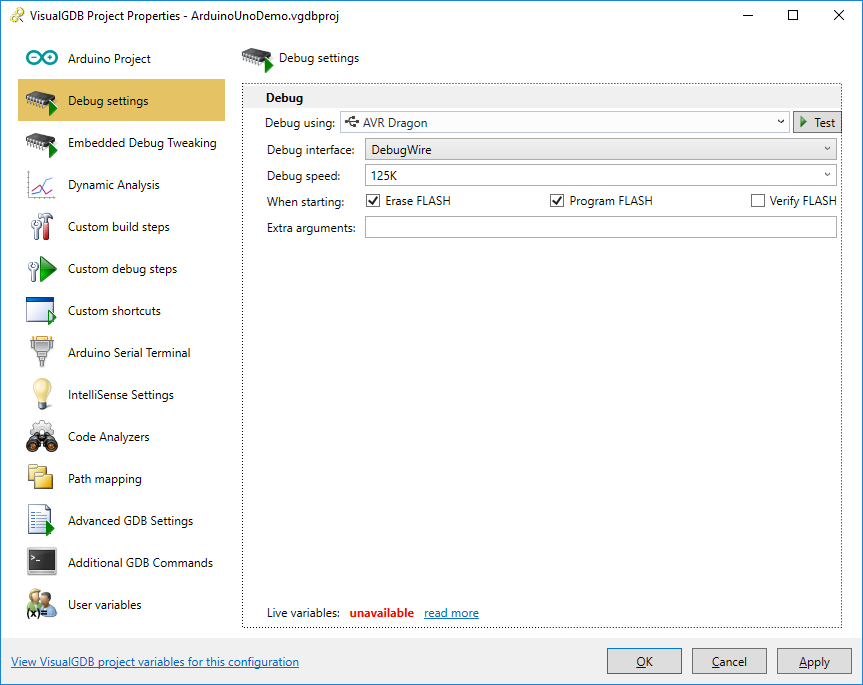
- Once the Arduino Uno board is configured for programming, open your VisualGDB project from the basic AVR tutorial. Then open VisualGDB Project Properties, go to the Debug Settings page and select your debug probe. Ensure you set Debug Interface to DebugWire:
- Set a breakpoint in the loop() function and press F5 to begin debugging:
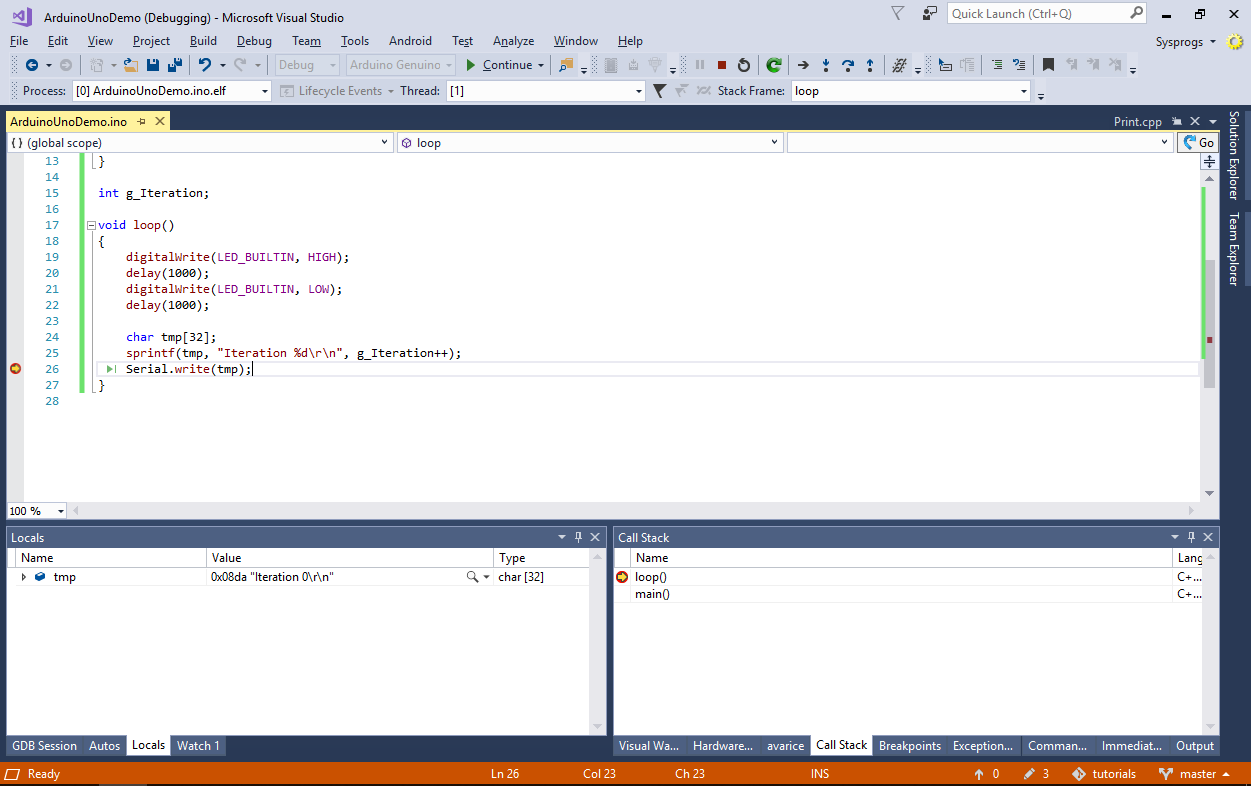 As long as the AVR board is properly setup for debugging, VisualGDB will provide the same debugging experience as with any other supported target. The FLASH memory will be automatically programmed and VisualGDB will let you set breakpoints and step through your code. However, while the AVR chip is in the debugging mode, it will only run with a debugger connected and won’t let you use the bootloader for programming the FLASH memory.
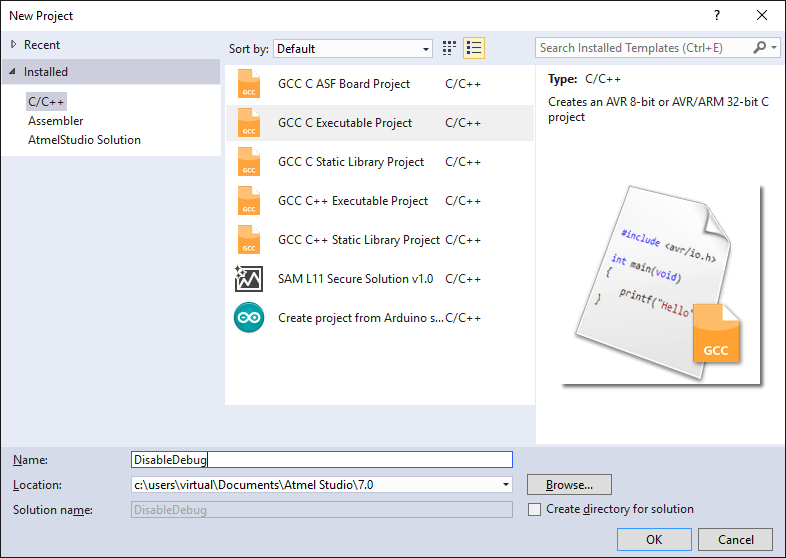
 - To turn the debug mode off, go back to Atmel Studio and create an empty project:
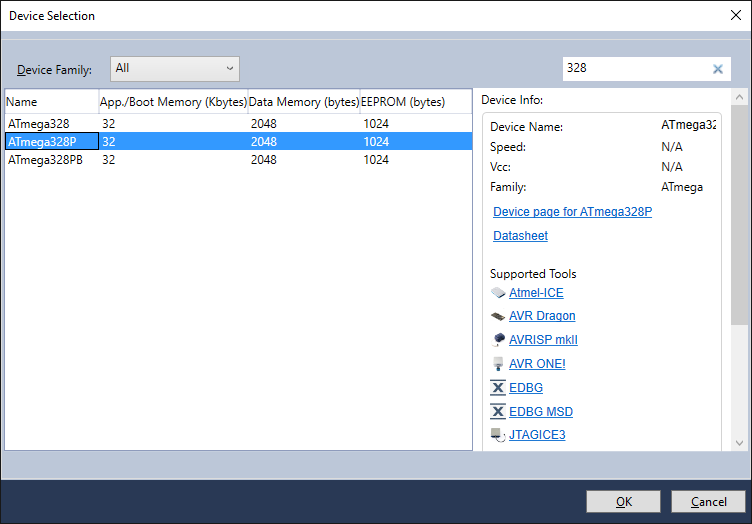
- Select your AVR chip in the Device Selection dialog:
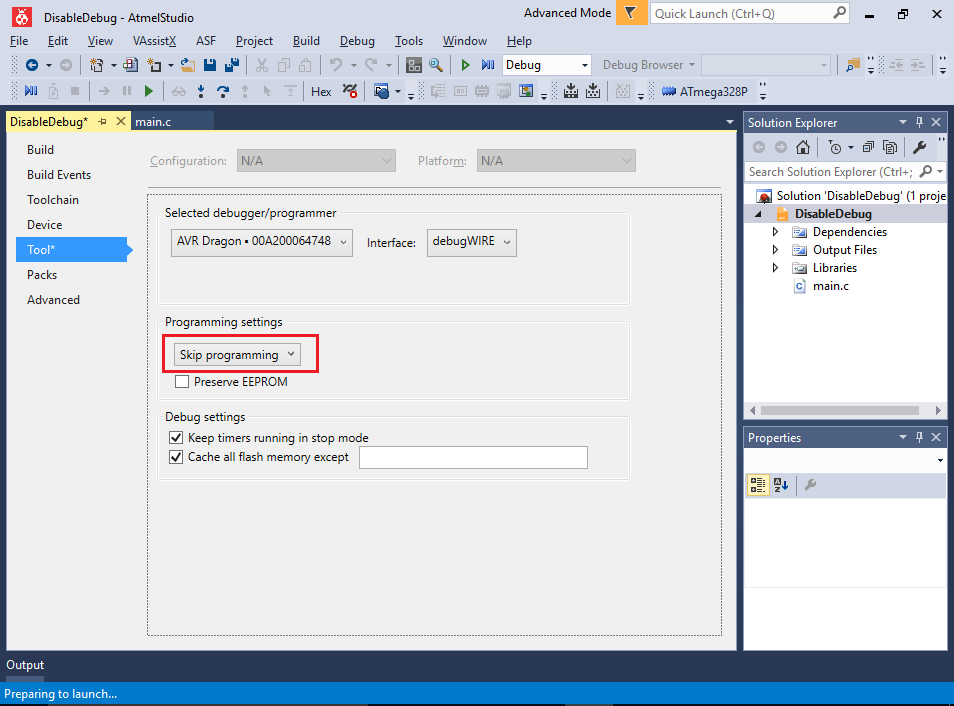
- Open Debug Settings, pick your debug probe and ensure “Skip programming” is selected:
- Start a debugging session, then click “Debug->Disable debugWIRE and Close”:
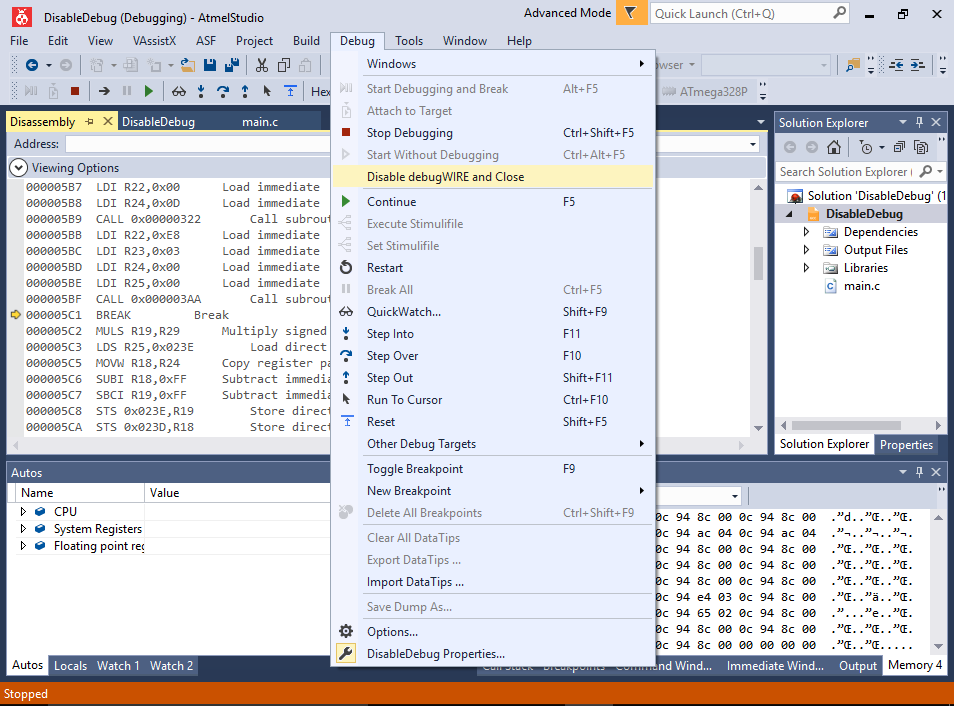
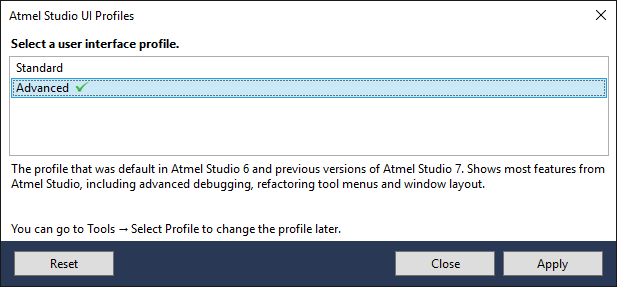
- If the “Disable debugWIRE and Close” command doesn’t appear, ensure you have the advanced profile enabled via Tools->Select Profile:
- Finally, set the jumper between the “RESET-EN” terminals to restore the bootloader functionality:
- Now Arduino Uno will run normally without the debugger and you will be able to use the regular “Program FLASH” memory command again to program the memory using the bootloader.