Developing firmware for AVR devices with Visual Studio
This tutorial shows how to develop and debug firmware for AVR devices with Visual Studio using VisualGDB.
Before you begin, install VisualGDB.
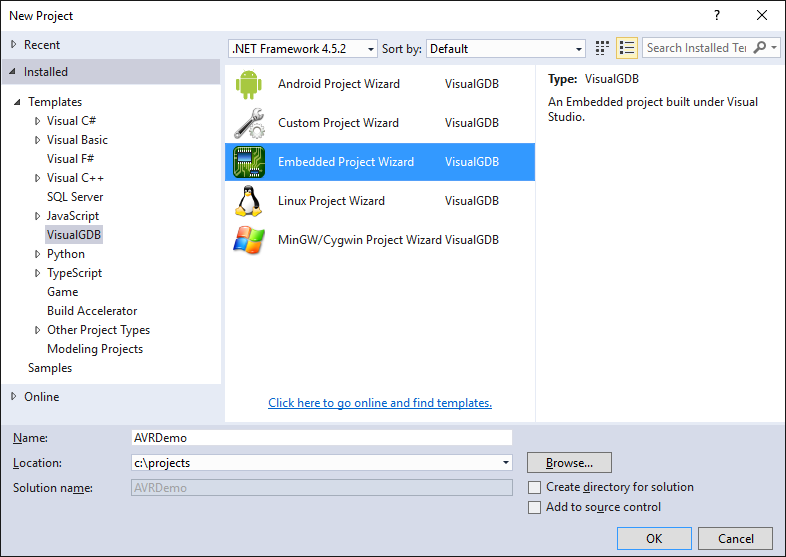
- Start Visual Studio and open the VisualGDB Embedded Project Wizard:
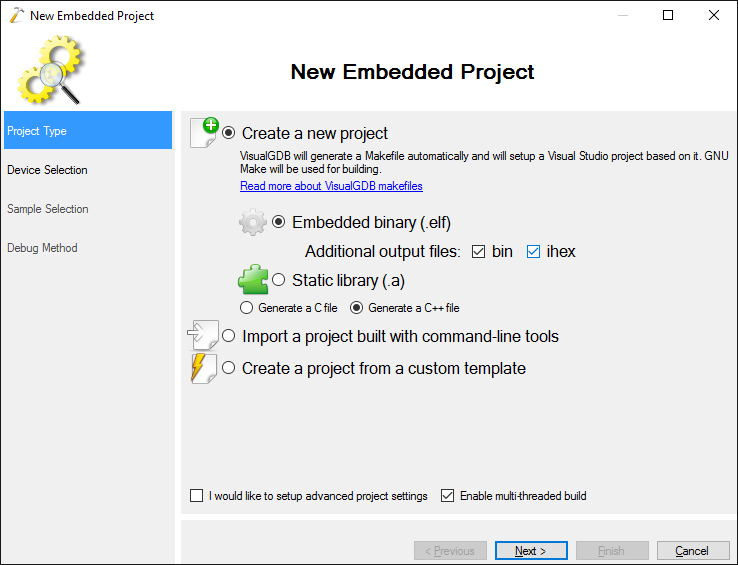
- Proceed with the default “Create new project -> Embedded Binary” setting. If you want VisualGDB to create a .hex file additionally to the .bin and .elf files, check the “ihex” checkbox:
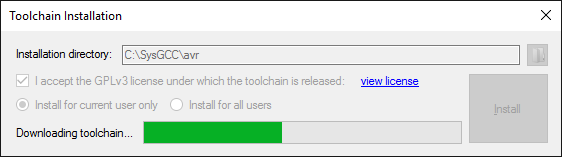
- On the next page select the AVR toolchain. If it is not installed, VisualGDB will offer installing it automatically:
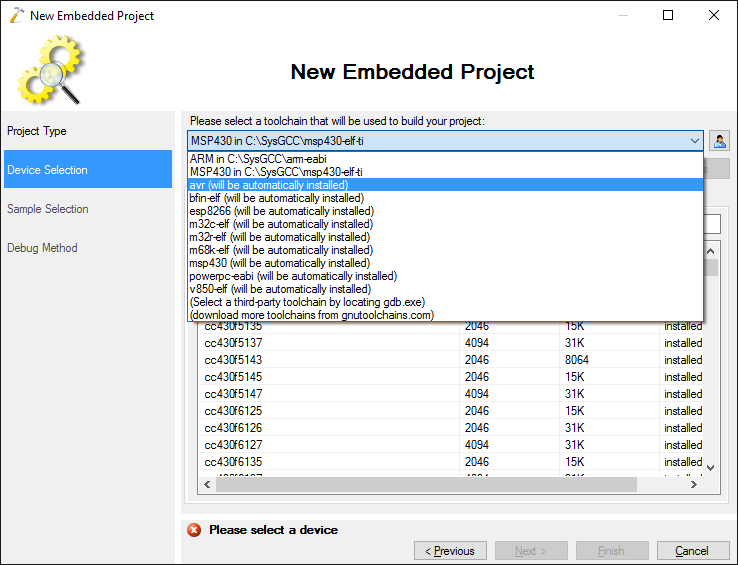 You can also download the toolchain manually from the gnutoolchains.com site.
 - Simply specify a directory where you want to install the toolchain and click “Install” to begin installation:
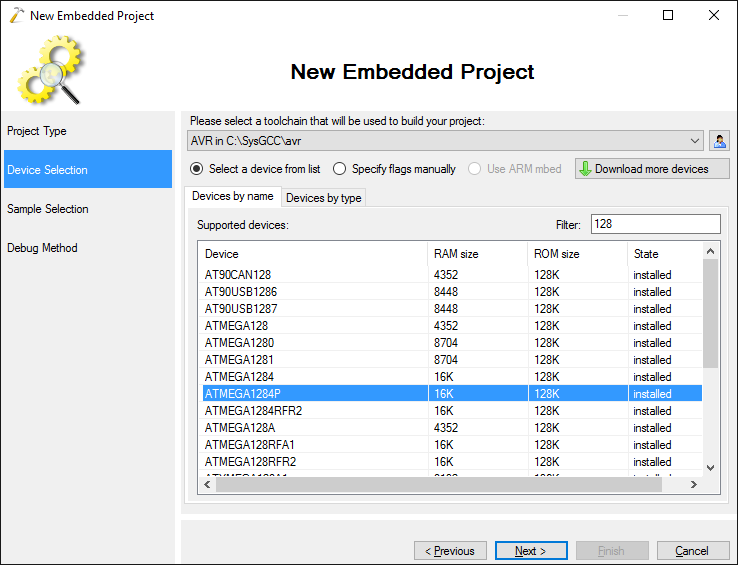
- Once the toolchain is installed, select the device you are targeting from the list. We will demonstrate debugging based on the MEGA-1284P Xplained board, so we select ATMEGA1284p in this step:
- On the Sample Selection page enter select the port and the pin of the LED that you want to blink. The MEGA-1284P Xplained board as 4 LEDs connected to ports B0, B1, B2 and B3, so we select PORTB0:

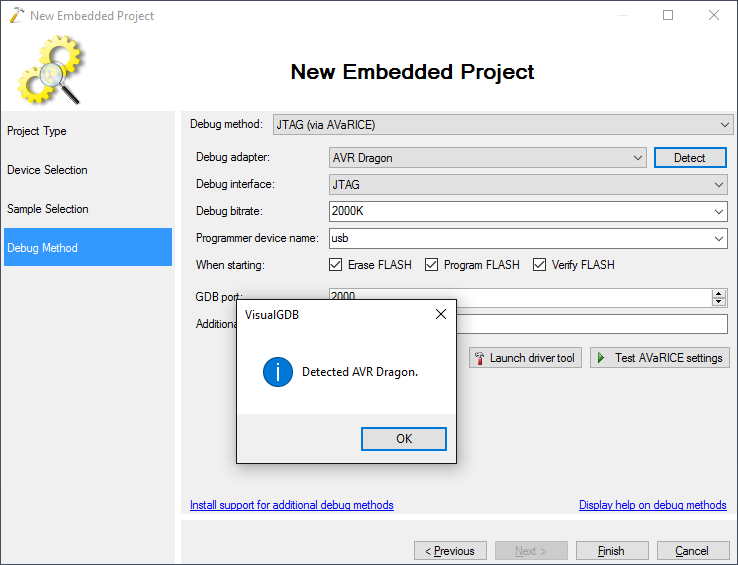
- When you open the Debug Method page, connect your debug adapter to the USB port and click “Detect” to auto-detect it. VisualGDB supports AVR debugging using the AVaRICE tool that works with the JTAG ICE Mk I, JTAG ICE Mk II and AVR Dragon devices. VisualGDB can automatically detect the JTAG ICE Mk II and AVR Dragon and setup the drivers for them:
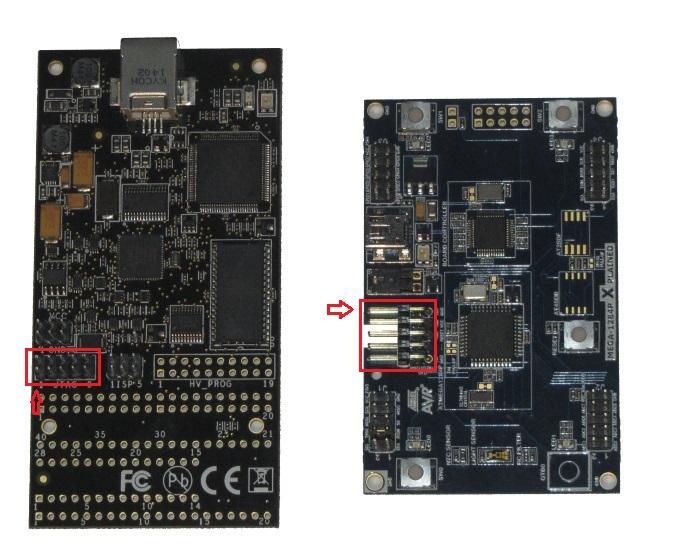
 Note that debugging AVR devices with VisualGDB/AVaRICE requires a JTAG connection.
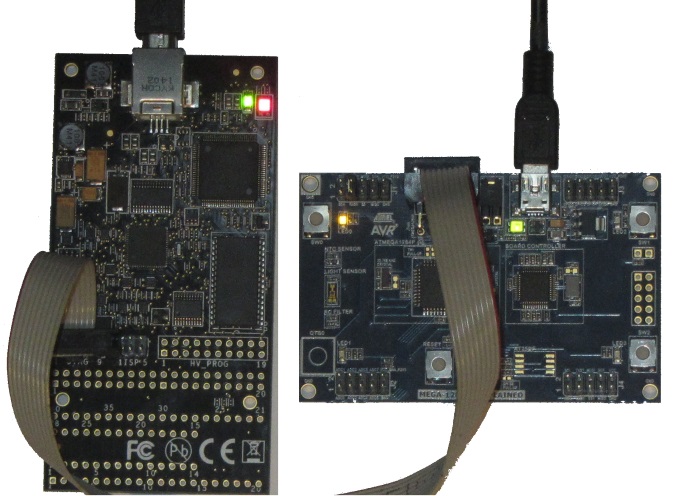
 - Ensure both debug adapter and the programmed device are powered and connected to each other using the connectors shown below (the arrow shows the location of pin #1 on both connectors):
- Then press “Test AVaRICE settings” button to check that the tool can communicate to your device. VisualGDB will attempt to read the lock bits of the device and if it fails, the error message should provide more details:
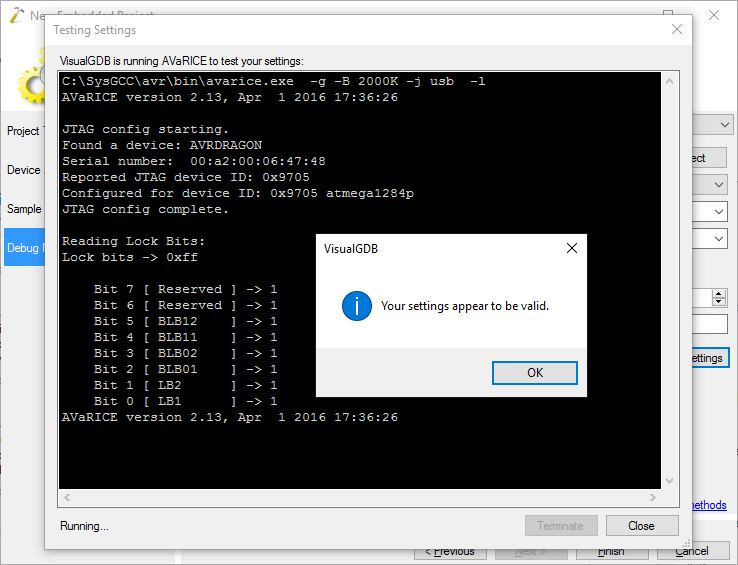 It is recommended to set the Debug Bitrate value to 1/4 of your device frequency, as the default 250K setting will result in very slow debugging. However, setting the value too high would make the debugging impossible and could cause strange bugs.
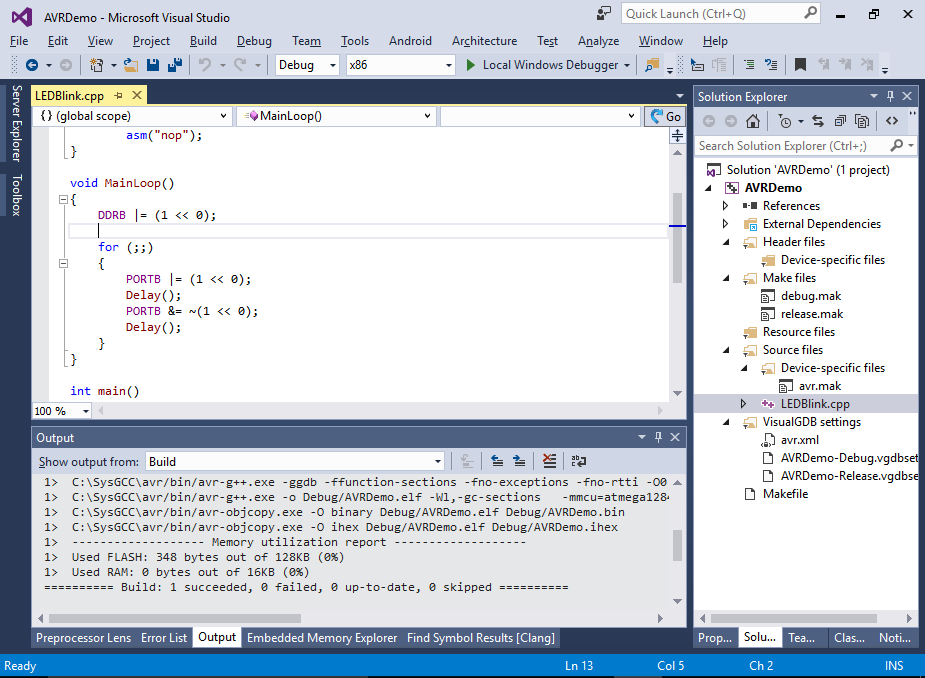
 - Press “Finish” to generate your project. Build it by pressing Ctrl-Shift-B:
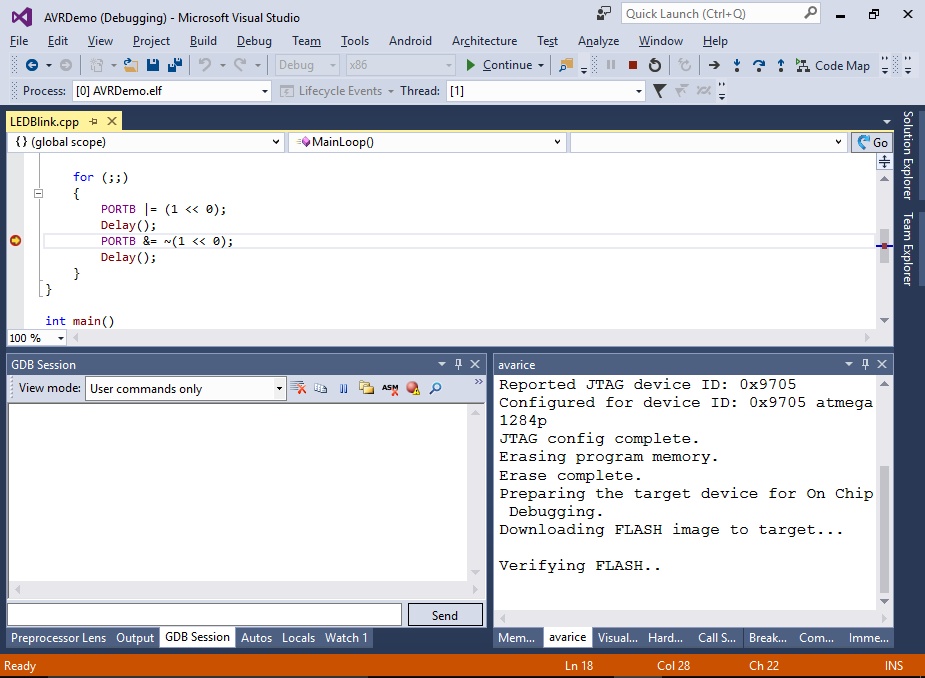
- Press F5 to start debugging. Observe how the yellow LED in the upper left corner of the board starts to blink:
- Set a breakpoint at the line that modifies the PORTB register and wait for it to trigger. You can step over the assignment statement to see how the LED turns on or off:
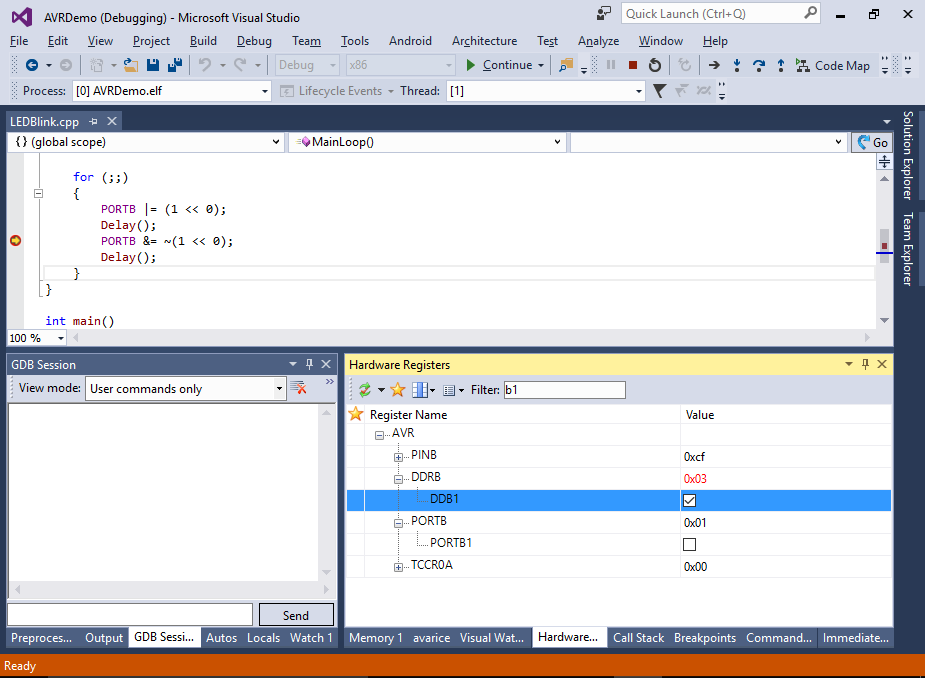
- You can use the Hardware Registers window to view and quickly change the values of various registers. E.g. you can set DDRB1 to 1 and PORTB1 to 0 to turn on the second LED on the board:
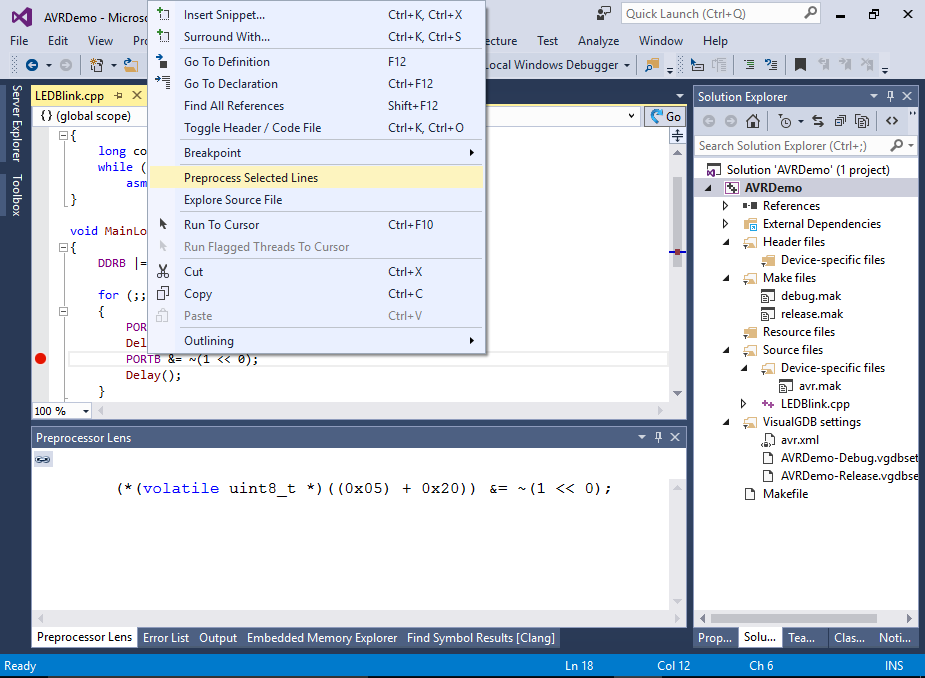
- Some definitions in the AVR library heavily rely on preprocessor macros. You can simplify understanding them by right-clicking on the lines that use those macros and selecting “Preprocess Selected Lines”. VisualGDB will expand the macros in the line making it clear what that line of code does: