Using Quick Debug to debug Win32 applications
This tutorial shows how to quickly debug a program built with GCC without creating a separate Visual Studio project.
In this tutorial we will build GNU binutils from command line and use Visual Studio to debug the cxxfilt.exe program (GNU C++ name demangler) to find out which function inside it does the actual demangling. You can use the techniques described here to debug any other tool built with GCC.
- Install MinGW. If you prefer using cygwin, follow the same steps, but change the MinGW-style path notation (/c/something) to cygwin-style (/cygdrive/c/something).
- Download the binutils source code from http://ftp.gnu.org/gnu/binutils/
- Unpack the archive (e.g. binutils-2.23.1.tar.bz2) into a temporary directory (e.g. c:\gnu)
- Open MinGW shell, configure and build the binutils using the following commands:
cd /c/gnu
mkdir binutils-build
cd binutils-build
../binutils-2.23.1/configure
make
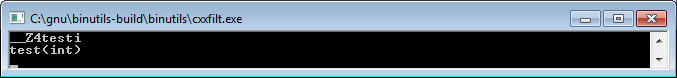
- At this point the c:\gnu\binutils-build\binutils directory will contain the cxxfilt.exe file. If you run it and type in a C++-mangled name as seen in a binary file (e.g. __Z4testi) it will demangle it for you (e.g. test(int) for __Z4testi).
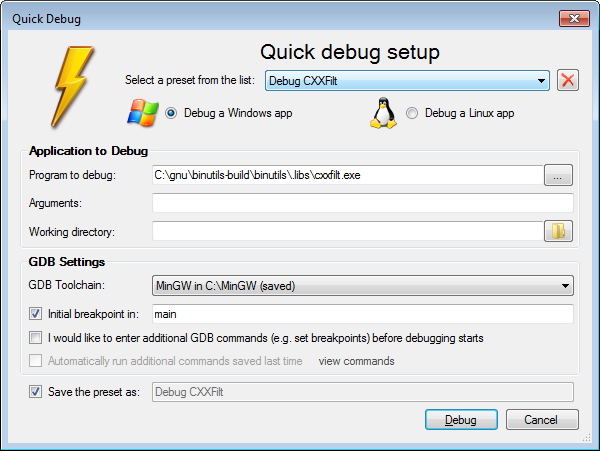
- Normally you could debug cxxfilt.exe by creating a VisualGDB project in Visual Studio, however, since VisualGDB 2.8 there is a faster way to do it. Start Visual Studio and select Debug->Quick Debug with GDB:

- In the Quick Debug Setup window specify the path to cxxfilt.exe (use the one inside .libs directory, if you specify binutils\cxxfilt.exe, debugging won’t work as the file contains no symbols) and select your toolchain from the GDB Toolchain list.
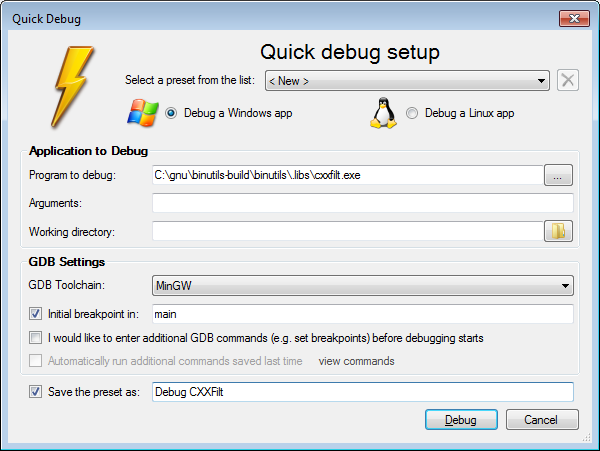 If you want to debug the same program later without selecting all the settings manually, enable the “Save the preset” checkbox and enter a meaningful name for the preset. When done press “Debug“.
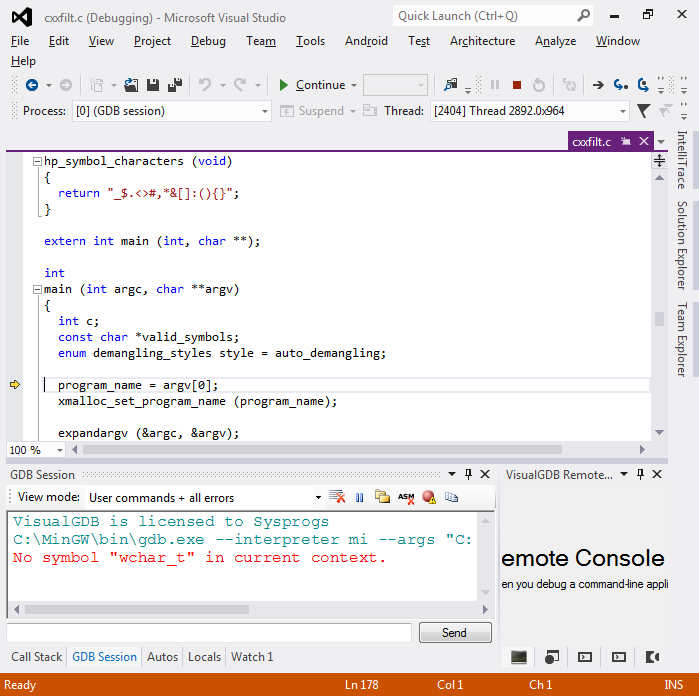
 - The debugging session will start and the breakpoint in main() will be triggered:
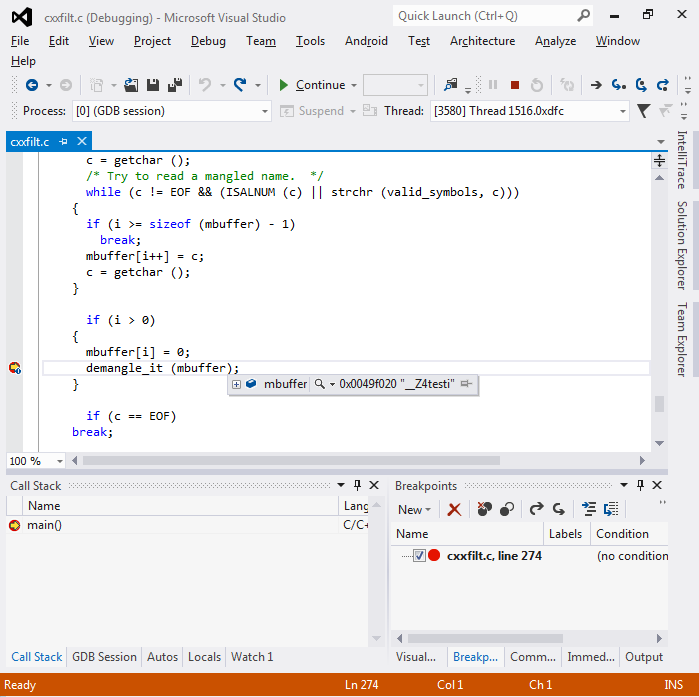
- Scroll down the file until you see the main loop reading lines from stdin and processing them. Put a breakpoint on the line calling demangle_it().
- Continue debugging by pressing F5. Go to the console window running cxxfilt, type __Z4testi and press Enter. The breakpoint will be triggered:
- Step into the function to see which other functions are called. You will see the cplus_demangle() function calling the cplus_demangle_v3() function:
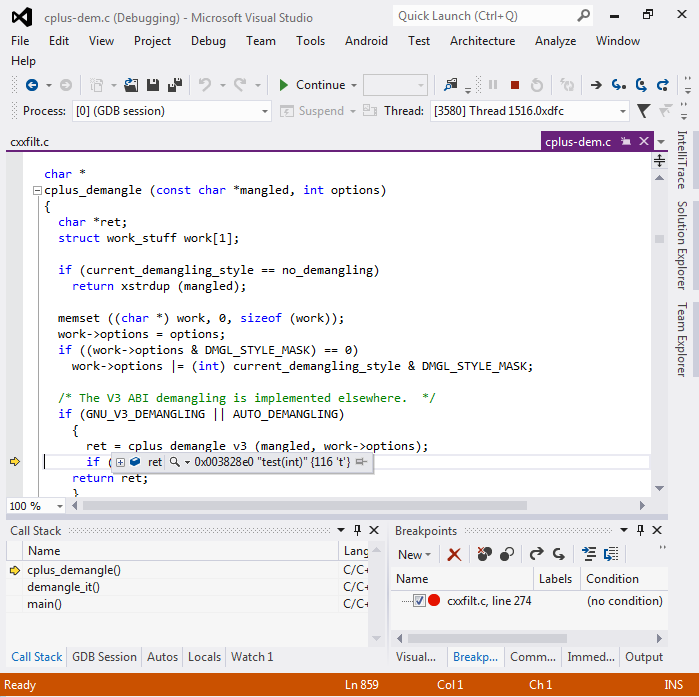
- At this point it is clear the the demangling is
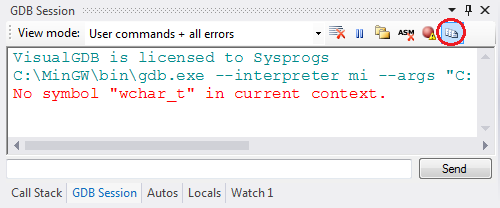
done by the cplus_demangle() function contained in cplus-dem.c file inside libiberty. - Note that as you did not create a VisualGDB project, the Solution Explorer will not show any source files. To browse through the source files reported by GDB click on the Source File List button in the GDB Session window:
- The VisualGDB source browser shows all source files mentioned in the debugging symbols (some of them might not be present if a library containing them was built in a different folder). You can use the filter box to quickly find file by its name or switch to the hierarchical view to see all files in a tree.
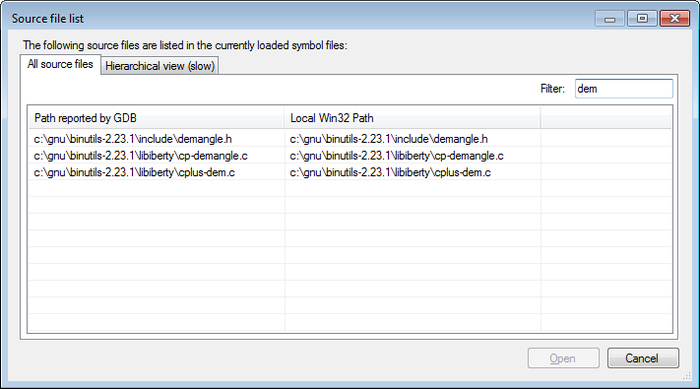 To open one or more files in Visual Studio select them in the list and press the Open button.
 - When you are done debugging press Shift-F5 to stop.
- If you want to run another debugging session, select Debug->Quick Debug with GDB again. If you have saved the settings before, the Quick Debug Setup window will already contain them. Just press “Debug” to start.
 If you want to debug another program instead, please select “New” in the preset list.


