Using Live Profiling to Analyze Critical Parts of Linux Code
This tutorial shows how to use the Live Profiling for Linux programs to analyze the relative performance of the critical code without slowing down the entire program. We will create a basic program that will be sorting an array of 10000 random numbers and will use Live Profiling to quickly compare different ways of doing that without profiling the entire program run.
Before you begin, install Visual Studio and VisualGDB 5.3 or later.
- Start Visual Studio and open the VisualGDB Linux Project Wizard:
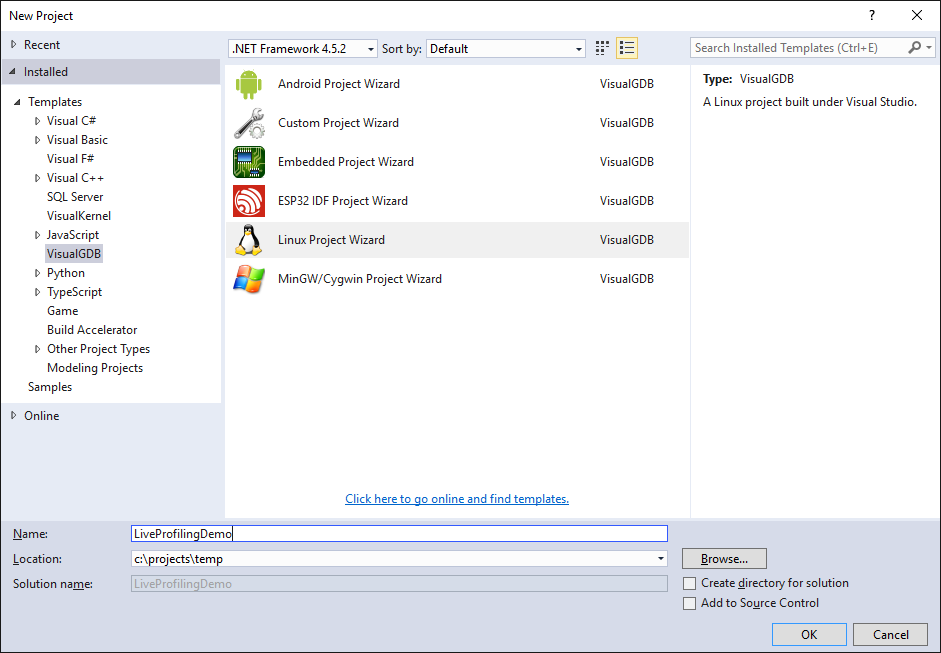
- Select “Create a new project -> Application -> MSBuild”:

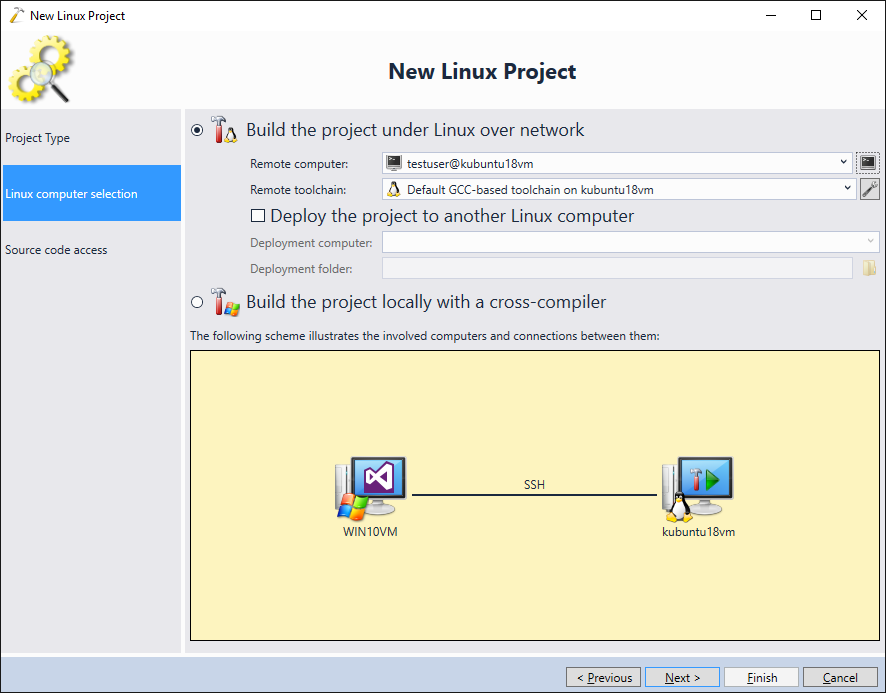
- On the next page pick the remote Linux machine you are targeting and click “Next”:
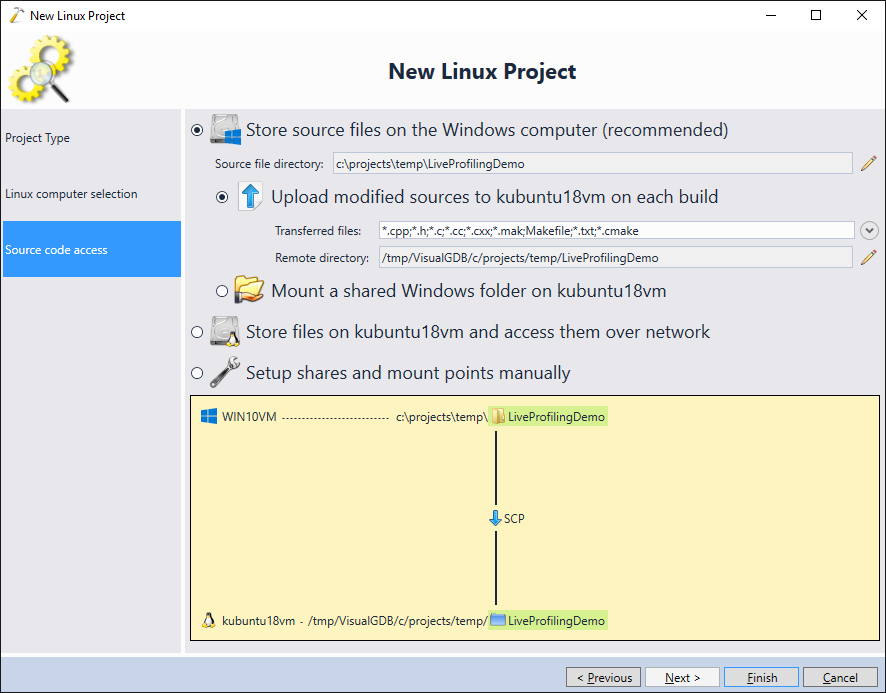
- On the last page of the wizard proceed with the default file access options (Store locally & upload):
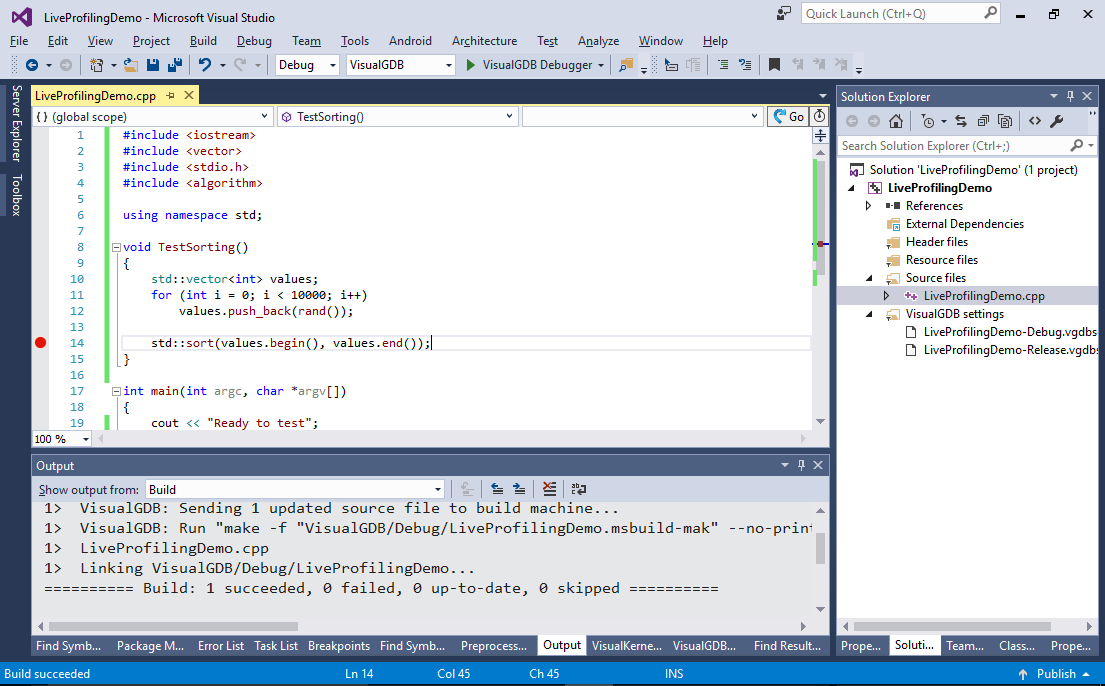
- Press “Finish” to create the project. Then replace the contents of the main file with the following code:
#include <iostream>
#include <vector>
#include <stdio.h>
#include <algorithm>

using namespace std;

void TestSorting()
{
    std::vector<int> values;
    for (int i = 0; i < 10000; i++)
        values.push_back(rand());

    std::sort(values.begin(), values.end());
}

int main(int argc, char *argv[])
{
    cout << "Ready to test";
    TestSorting();
    return 0;
}
- Build the solution via Ctrl-Shift-B and set a breakpoint on the std::sort() call:
- Now we will use Live Profiling to automatically measure the exact time taken by the sort() call (and highlight the critical path). VisualGDB will use this by automatically launching the valgrind tool behind the scenes and interpreting the profiling data it reports. Select Analyze -> Analyze Performance with VisualGDB:

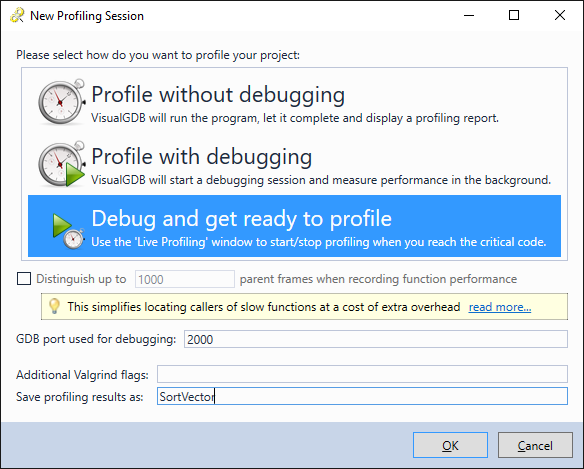
- If you wanted to profile the entire program, you could simply select “Profile without debugging” or “Profile with debugging”, however this would result in a significant slowdown as the entire program execution would be logged in order to analyze its performance. While this is acceptable for small programs, it could reduce the overall usability if the critical part of the code is not reached immediately. To facilitate this scenario, VisualGDB provides the Live Profiling mode where it will launch valrgind in the suspended state and will only profile the code once you explicitly enable it. Select “Debug and get ready to profile” and click OK:
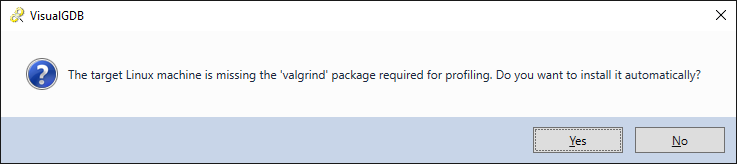
- If your remote machine does not have valgrind installed, VisualGDB will offer installing it automatically:
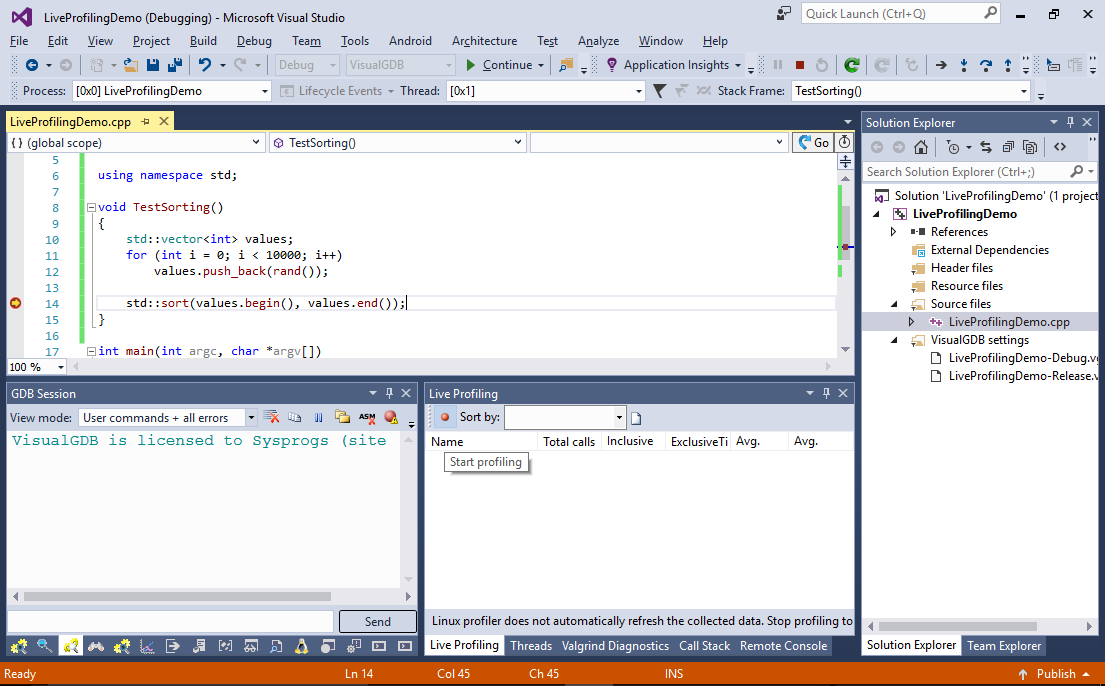
- Wait for the breakpoint to hit. Then locate the Live Profiling window and click “Start profiling”:
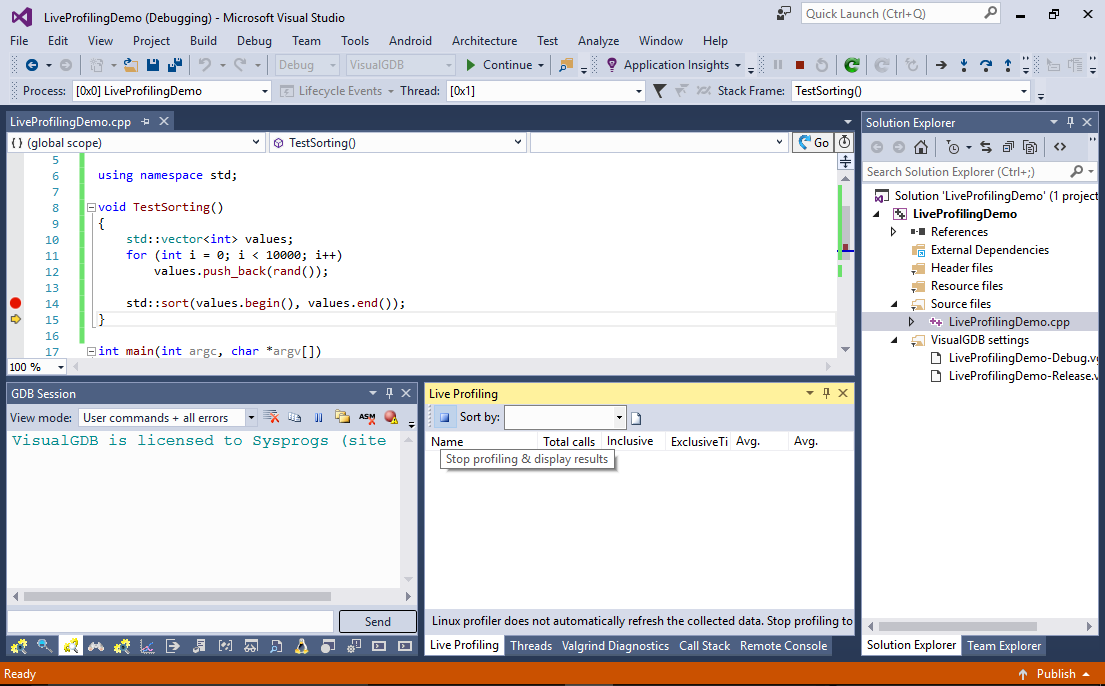
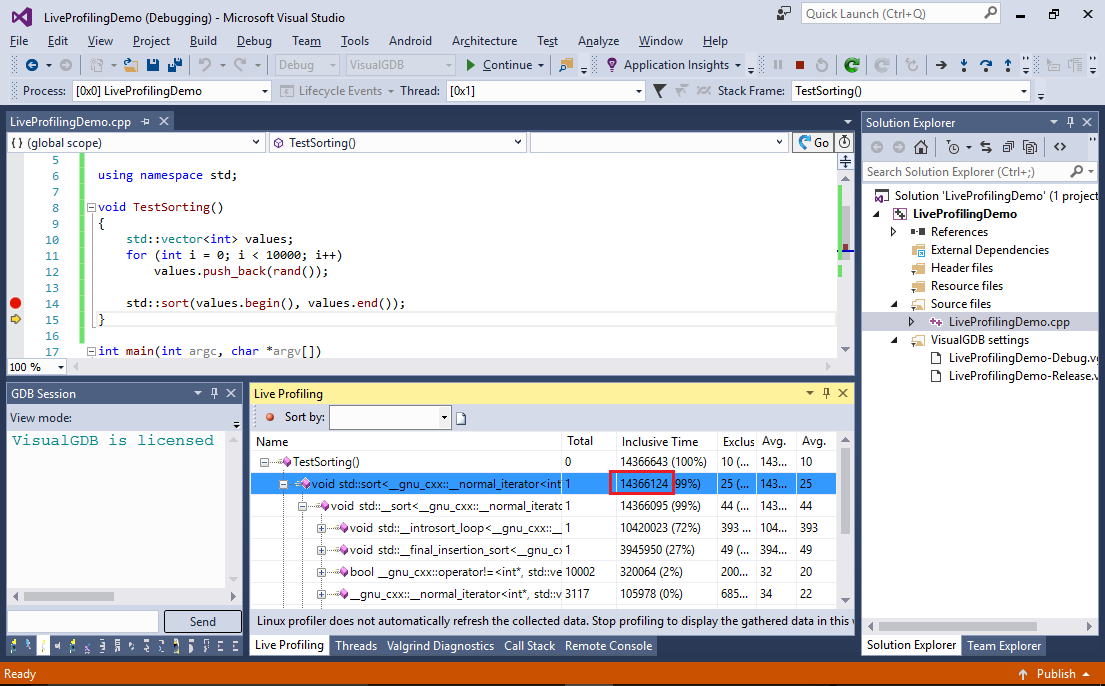
- Step over the call to std::sort() and click “Stop profiling & display results”:
- VisualGDB will display the profiling results in the Live Profiling window. In our example the call to std::sort() involved ~14M instructions mostly from __introsort_loop():
- Now we will see what happens if we replace std::sort() with the qsort() function from the standard C library:
#include <stdlib.h>
int CompareIntegers(const void * a, const void * b)
{
    return (*(int*)a - *(int*)b);
}

void TestSorting()
{
    //...
    qsort(values.data(), values.size(), sizeof(values[0]), CompareIntegers);
}
- Run the live profiling again, enabling the actual profiling only for the qsort() call and observe that the sorting time is almost 3x less:
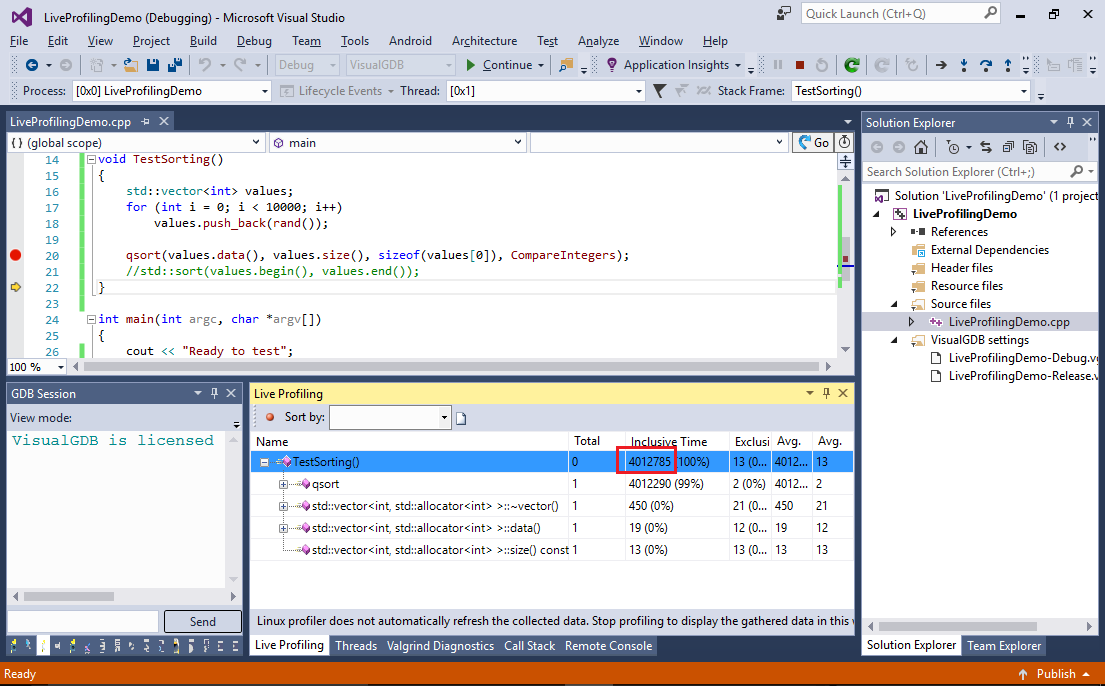 Note that each run of our program will generate exactly the same pseudo-random numbers, as we are not changing the random number generator seed by calling srand().
 - In this example the qsort() function works faster than std::sort() because it is implemented in an external library (build with optimization), while this std::sort() code is built in-place with no optimization. In order to compare the optimized version of std::sort(), switch to the Release configuration and add asm(“nop”) statements around the call. Then set breakpoints in both statements and run the profiling between the breakpoint hits:
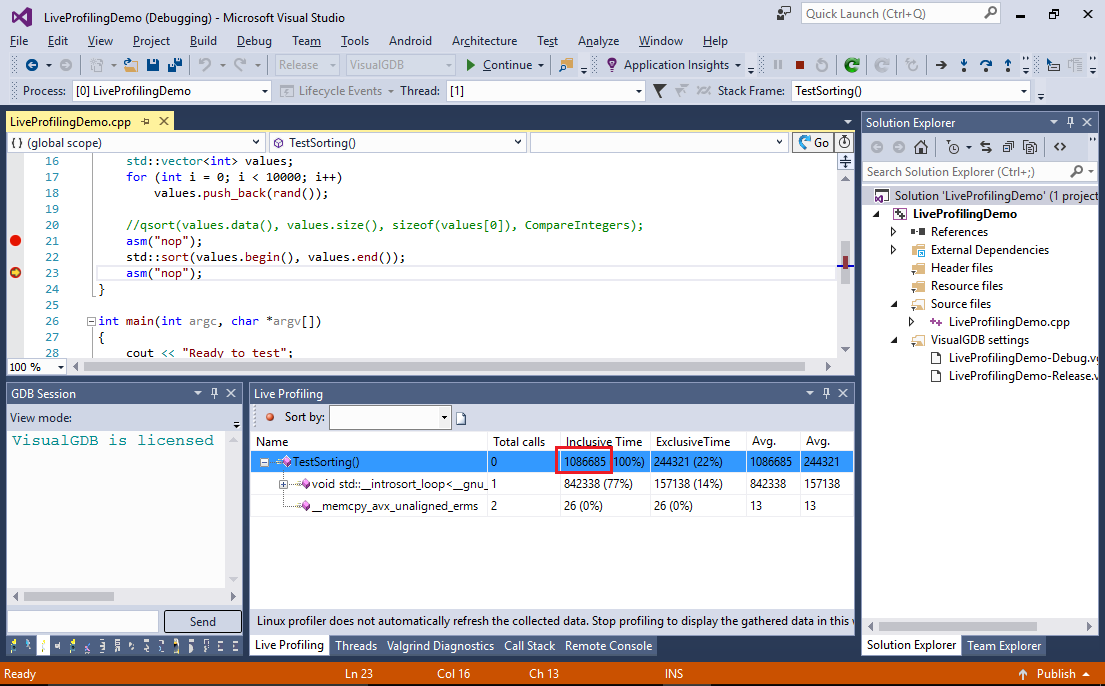
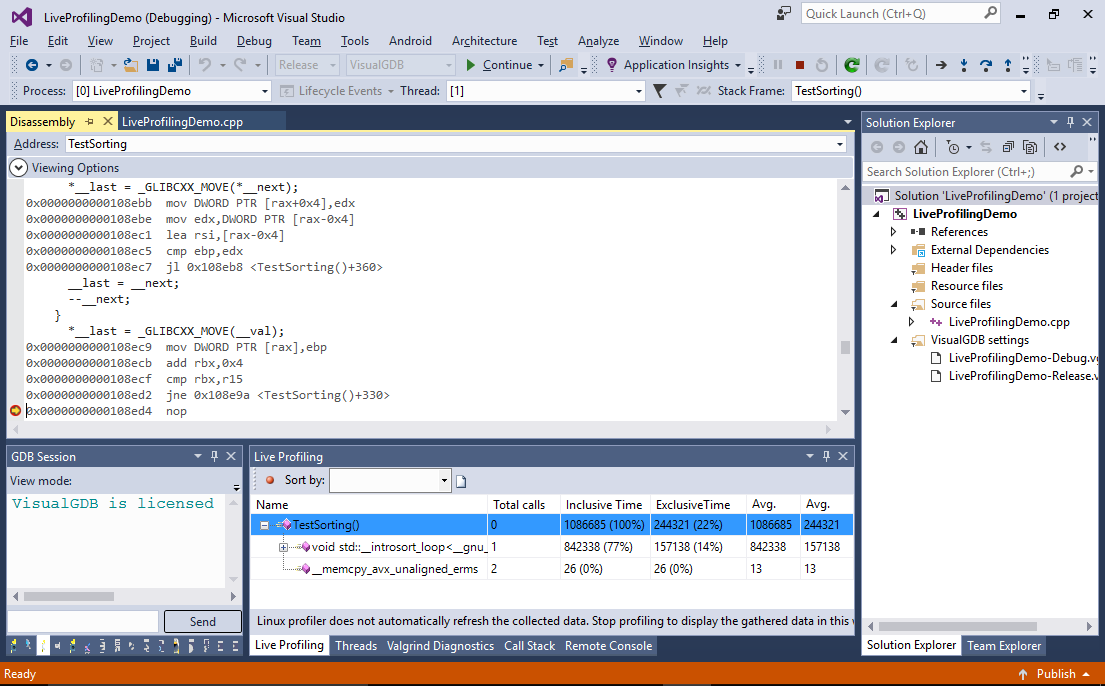
- Notice how the sorting time has further decreased and 22% of if was taken by the TestSorting() function itself. This happens because most of the std::sort() logic was inlined and fine-tuned for this specific use case (e.g. it will do the integer comparison in-place instead of calling the user-provided callback like qsort() does). You can confirm this by switching to the Disassembly view:
- Finally try replacing the vector with a list and check whether the sorting time changes:
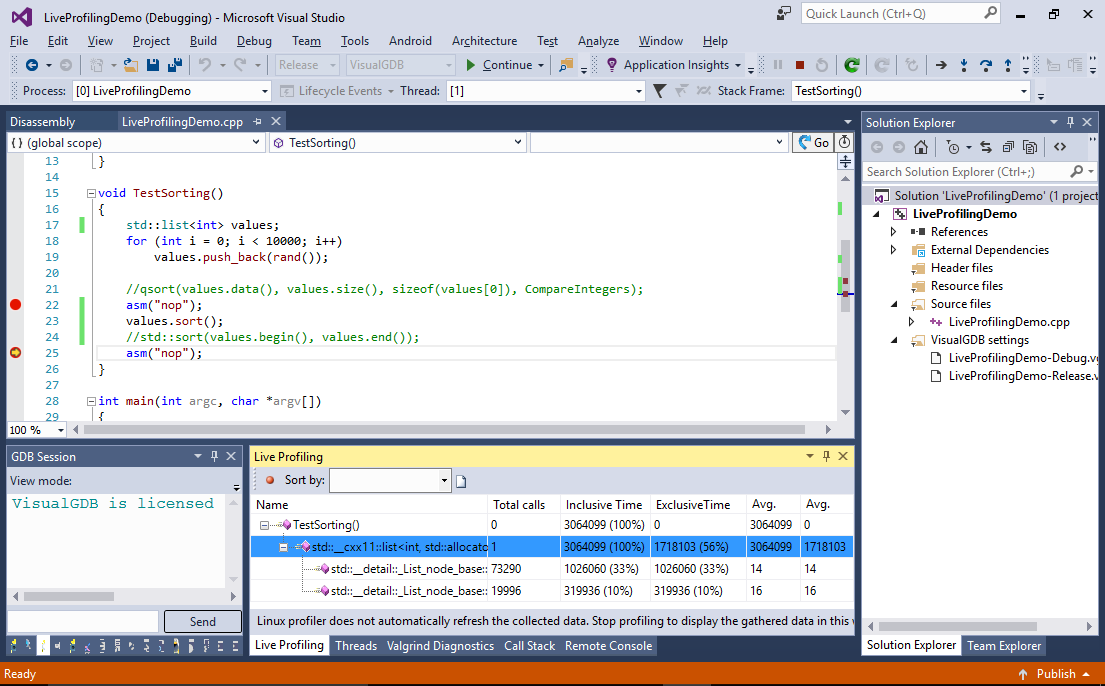 See how the sorting time increased as updating a linked list involves more memory operations than updating a consecutive array.
You can turn the profiling on and off multiple times during a debug session. Each time you turn it on, VisualGDB will activate the valgrind profiling logic, collecting the detailed statistics about the executed code, and each time you turn it off, valgrind will be put into inactive state, reducing the slowdown of your application. You can effectively use this technique to profile critical parts of large programs without slowing down the entire program.