Consistent across many platforms
VisualGDB provides consistent debugging experience from debugging local MinGW or Cygwin programs to remote debugging over SSH to low-level JTAG debugging.
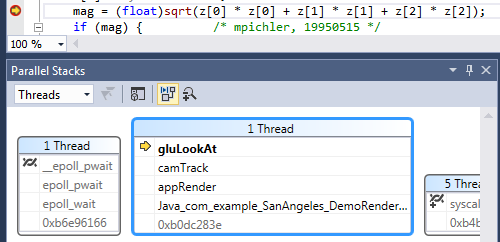
VisualGDB provides everything you would expect from C/C++ debugging with Visual Studio: stepping, conditional breakpoints, call stack, watch, locals/autos, disassembly, registers, memory view, threads, parallel stacks and remote process output.
GDB Session window
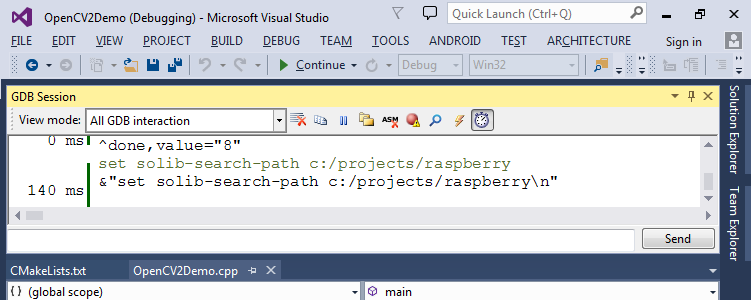
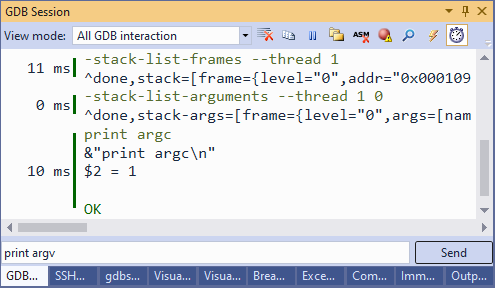
VisualGDB provides a GDB Session window that allows running custom GDB commands to tweak your debugging experience and viewing the commands that VisualGDB sends.
The timing analysis mode helps understand which commands take the most time and temporarily disable the related features to get the maximum performance on slow connections.
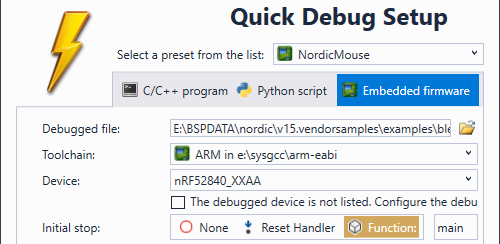
Start debugging in seconds
VisualGDB allows debugging code without creating Visual Studio projects. Simply open the Quick Debug window, point to a binary built with GNU tools and VisualGDB will start a debugging session.
Your settings will be saved in a preset, so next time you could just select them from a list and start debugging with one mouse click.
Quick Debug supports debugging MinGW/Cygwin, Linux, Embedded and Python code.
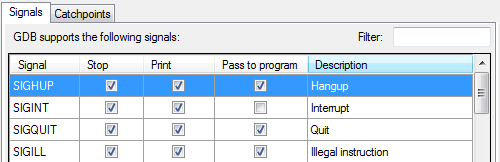
Signals and catchpoints
VisualGDB allows tweaking signal handling for your programs and provides a graphical interface for breaking on system calls or thrown C++ exceptions.
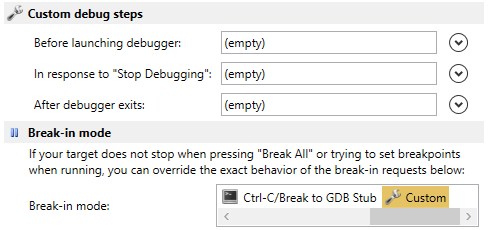
Wide customization possibilities
With VisualGDB you can customize every aspect of your debugging sessions: which gdb to use, how to start it, how to stop the running process, extra initialization commands, etc.
You can define lists of custom actions (like running command lines or transferring files between computers) that will be run before debugging, after debugging or when the debug session is about to end.
Easily attach to existing processes
VisualGDB makes it very easy to attach to a MinGW/Cygwin or remote Linux process. Simply select VisualGDB in the Attach Transport and use the Find button to quickly locate your Linux machine or a local Windows toolchain.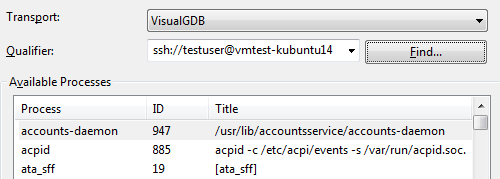
Deep integration with IntelliSense
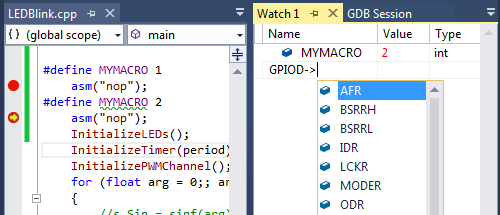
VisualGDB automatically expands preprocessor macros in Watch and Auto expressions. The expansion is context-sensitive, so you will always see precise results, even if your macro is redefined in multiple places.
Code Completion support in Watch window makes it easier to find the values you are looking for and eliminates extra typing.
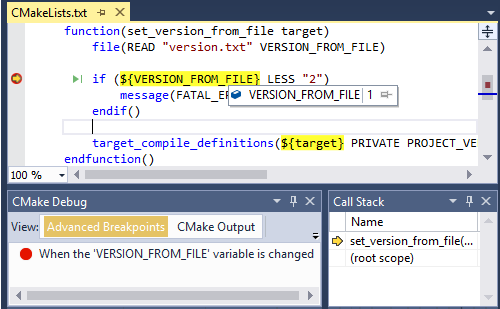
CMake Script Debugger
VisualGDB includes an advanced CMake Script Debugger that allows stepping through the CMakeLists.txt files and supports:
- Stepping in, out and over statements
- Breakpoints in script files
- Breakpoints on variable modification/access
- Evaluating and editing CMake variables
- Setting next statement
You can read more about the CMake script debugger in the detailed tutorial.