Fixing breakpoints in native Android code
This guide explains why your breakpoints in native Android code can be unreachable and how to fix them.
Overview
First of all let's overview the structure of a typical Android app containing native code:
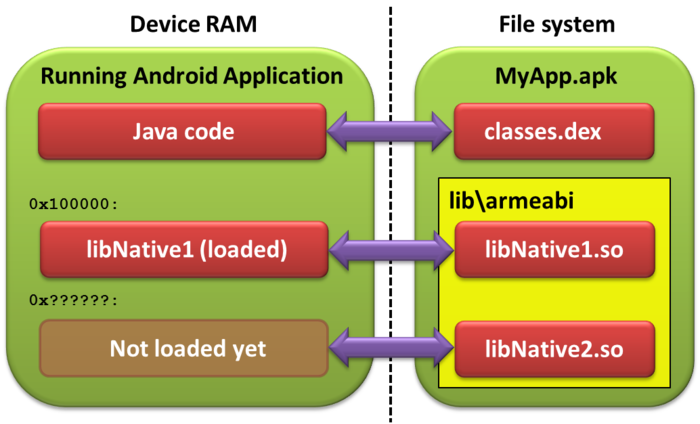
The app code is stored inside an .apk file that is essentially a ZIP archive containing the classes.dex file (with all the Java code) and one or more native libraries in lib\<EABI name> subdirectory. The typical lifecycle of an application with native code is the following:
- The Android OS loads the Java code and starts executing it
- The Java code calls System.loadLibrary() to load a native library.
- The Java code starts calling functions from the native code.
Each native library exists in 2 versions:
- A "full" version debugging information that associates code addresses inside the library with source files and lines. This version resides in obj\local\armeabi under your project directory.
- A "stripped" version without the debugging information that resides in libs\armeabi and gets packaged into the APK file.
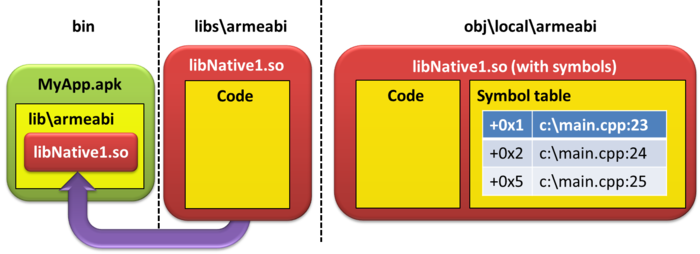
While the Android device runs the smaller "stripped" version of the library, the GDB debugger needs the larger "non-stripped" version to map source files into addresses and vice versa:
Setting breakpoints
When you set a breakpoint on a given line of a source file, the GDB debugger needs to perform certain computations before the breakpoint can be physically created and starts triggering. Assume libNative1 is loaded at address 0x10000 and the user is setting a breakpoint in line 24 of c:\main.cpp. GDB will do the following before it can set a breakpoint:
- GDB starts searching all loaded libraries for the file called "c:\main.cpp". In this example the Android OS only reports the libNative1.so library.
- GDB looks inside obj\local\armeabi for a file called libNative1.so which is the "non-stripped" version of the library containing the debug information. GDB reads the symbol table from it and finds c:\main.cpp inside it.
- Based on the symbol table GDB computes that line 24 corresponds to offset +0x2. It adds 0x2 to the load address of libNative1.so (0x10000) and sets the breakpoint at 0x10002.
If any of the 3 steps fail, the breakpoint will not be created, or will be created wrongly and will never be hit. The next section explains how to diagnose and fix the related problems.
Diagnosing the problems
This section provides detailed instructions how to check for the most common problems with breakpoints caused by non-standard configurations or missing files:
A. Ensure that the library is loaded
First thing to do is to determine if the native library has
been actually loaded and if GDB knows about it. It is done by
running the "info shared" command in GDB Session window: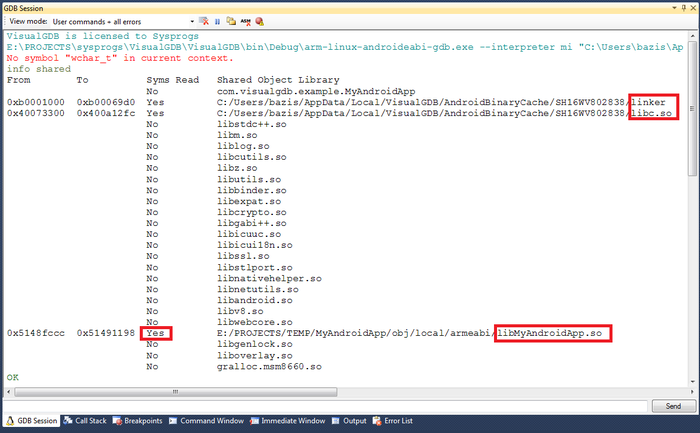
The output from the info shared command should include 3 important lines:
- Loaded symbols for "linker"
- Loaded symbols for "libc.so"
- Loaded symbols for all native libraries you want to debug.
Here's an example of those lines:
No com.visualgdb.example.MyAndroidApp
0xb0001000 0xb00069d0 Yes C:/.../AndroidBinaryCache/.../linker
0x40073300 0x400a12fc Yes C:/.../AndroidBinaryCache/.../libc.so
0x5148fccc 0x51491198 Yes E:/.../obj/local/armeabi/libMyAndroidApp.so
If your .so library (e.g. libMyAndroidApp.so) is listed, but the symbols are not loaded ("Syms read" states "no"), GDB was not able to find a non-stripped version of the library. To fix it please run the "show solib-search-path" command in GDB:
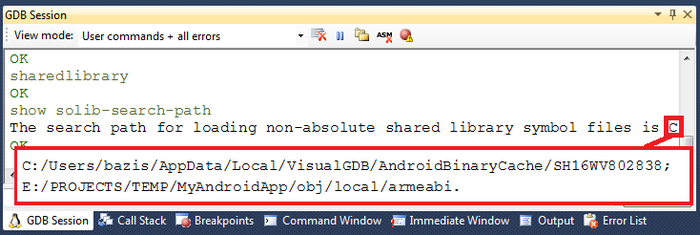
The obj/local/armeabi directory of your project should be present among the reported directories and it should contain the .so file with symbols. If not, copy the correct .so file into a directory listed here and rerun the "sharedlibrary" command.
You can alternatively force GDB to search additional directories for the .so file using the set solib-search-path command.
If your .so library is not present in the list, it has not been loaded by the Java code yet. Please ensure that System.loadLibrary() is called from your Java code and that it succeeds without any Java exceptions.
B. Ensure that you are using correct file paths
A common cause of many breakpoint problems is a configuration when the directories using for building and debugging your project are different. E.g. if the library was compiled from c:\projects and then the sources were moved to d:\projects, setting a breakpoint in d:\projects\main.cpp will fail, as GDB will not accept c:\projects\main.cpp as a substitute.
Those problems can be diagnosed by looking into the source file lists and comparing them with the file used to set a breakpoint. First of all, remove your breakpoint, select "All GDB interaction" in the GDB Session window and try setting your breakpoint again:
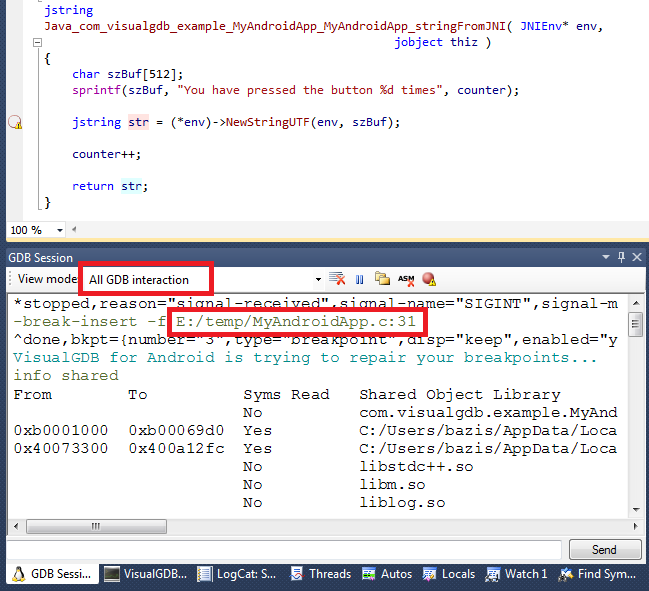
You will see the -break-insert command being issued specifying the path to your source file. You will also see that VisualGDB attempts to automatically recover from most known problems by reloading the symbols and trying to match your source file to one of the files reported by GDB, but this will not work if the file has been actually moved.
Run the "info sources" command to see the source files
discovered
by GDB: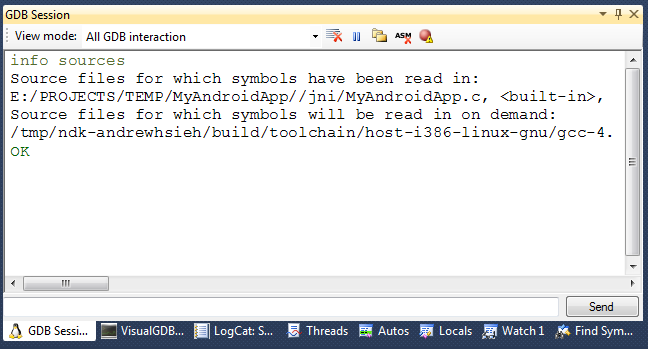
Copy the output of the command to the clipboard (Ctrl-A,
Ctrl-C), paste it into a text editor and search for the source
file you are trying to debug (e.g. MyAndroidApp.c):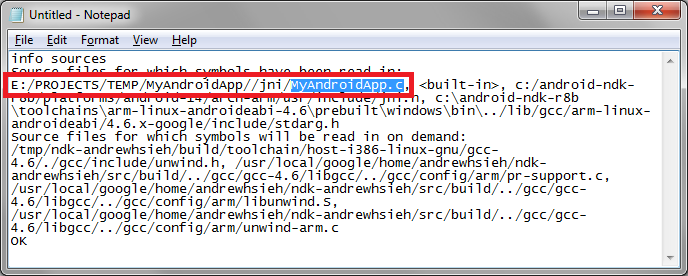
If the file is not present in the list, you have loaded a wrong version of the .so file (see previous section). If the file is present, but the path is different from the one used in -break-insert command, you have found the cause of your problem. Rebuild your app using the new path, or move the file back to an old location so that the path used by Visual Studio matches the path reported by the "info sources" command.
Note that GDB requires the file path to be EXACTLY the same as reported by "info sources", including double slash before "jni". VisualGDB normally does the substitution, but ONLY if the source file has not been moved.
C. Recheck file versions and do a clean build
If your breakpoints are set, but never hit, there is probably a mismatch between the .so file version loaded into the Android application and the .so file version used by GDB to compute addresses from source lines. The most common cause for it is the bug in the Android loader that loads the armeabi library instead of the armeabi-v7a version. If you suspect this to happen, change your build configuration to build either armeabi, or armeabi-v7a platform, but not both at the same time and rebuild your application.
If nothing helps
If trying the techniques described here did not help, our technical support will gladly assist you to find the exact cause of your problem. Please create a debugging session log file as described on this page and submit it to support@sysprogs.com.