Building Embedded Firmware with Visual Studio
In order to build and debug embedded firmware using VisualGDB you will need to configure it to work with your microcontroller family and board type. This document provides instructions on doing it and explains the structure of the underlying tools.
The Toolchains
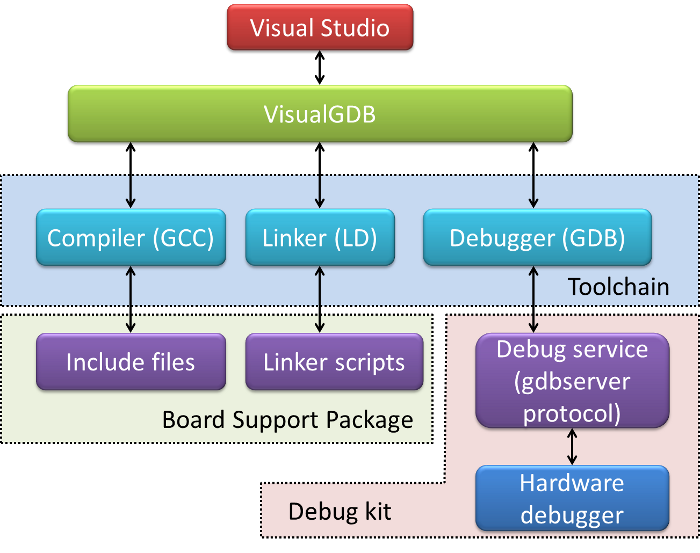
VisualGDB itself does not compile any code or talk to hardware directly. Instead, it utilizes the widely supported GNU toolchain and provides a seamless interface between Visual Studio and the GNU tools. The diagram below illustrates this:
 External Tools
To build and debug your embedded firmware with VisualGDB you will need to install 3 additional components:
- A GNU toolchain for your microcontroller type (we provide toolchains for most popular architectures)
- A board support package typically provided by the manufacturer of your microcontroller and board
- A debug method either shipped by VisualGDB, or provided by the manufacturer of your hardware debugger.
In most cases, VisualGDB will install all the necessary components automatically (e.g. see our STM32 Tutorial). This page describes how to install those tools manually in case the automatic installation doesn’t work.
Toolchain
A toolchain is a collection of tools for compiling, linking and debugging your code. A GNU toolchain is a bundle containing pre-built binaries of GCC, LD and GDB (open-source compiler, linker and debugger). The GNU tools support numerous different hardware architectures. We provide pre-built toolchains for ARM, Blackfin, Freescale Coldfire, MSP430, ESP8266, ESP32, RISC-V, PowerPC and many other popular architectures.
If you install a toolchain from our GNUToolchains website, VisualGDB will detect it automatically. If you used a different toolchain, select “Specify toolchain manually” on the Toolchain page of VisualGDB wizard and point to the GDB (GNU debugger) executable. VisualGDB will detect the locations of all other tools.
Board Support Package
A toolchain alone can build and debug code for a certain processor family. However, to produce usable code for a specific embedded microcontroller (with its own set of peripherals) you will need to provide the information about your controller to the toolchain. This can be done in 2 ways dependent on your MCU family:
- If the MCU family is maintained by one manufacturer only (e.g. AVR or MSP430), the toolchain will most likely contain all necessary headers. Then, to specify your microcontroller type you will simply need to add one command-line argument to GCC (e.g. selecting the MSP430F2274 microcontroller only requires adding -mmcu=msp430f2274 to the GCC command line). Once you enter the argument on the Build Settings page of the Wizard, VisualGDB will do everything else automatically.
- If the toolchain does not provide header files for your microcontroller (e.g. ARM), see the page of your MCU manufacturer for a board support package or sample projects for GNU Tools. For instance, Atmel provides support packages for the AT91SAM series (e.g. for AT91SAM7S).
If you cannot find board support package for your microcontroller, do a google search for “<your microcontroller name> gcc”. The GNU toolchain community is large and most likely someone has shared an instruction how to make GCC work with your MCU.
Once you install the board support package and test it with a simple firmware, enter the flags from the package (e.g. specifying the linker script and include directories) on the Build Settings page of the wizard. After that, VisualGDB will use them to automatically generate and build your project.
Debug Method
VisualGDB includes out-of-the-box packages for most popular debug methods. The rest of the section explains how to configure VisualGDB with exotic debug methods that we not supported directly.
If you intend to use a built-in gdb simulator instead of an on-chip debugger, you can skip this section. Simply select “Use built-in simulator” on the last page of VisualGDB wizard.
If you want to use a hardware debugger, please visit the website of your debugger manufacturer for a gdbserver-compatible debug stub. The stub is typically an EXE file that connects to the actual hardware debugger, opens a TCP port on the local machine and waits for the GDB to connect to it and start controlling the debug.
The service can be specific to your hardware debugger type (e.g. Macraigor Systems provides their own GNU toolchains with debug servers included), or support several debuggers (e.g. MSPDebug – an open-source debug service for the MSP430 architecture that supports several hardware debuggers).
If your hardware debugger manufacturer does not provide the gdbserver-compatible debug service, doing a google search for “<your hardware debugger> gdb” might find a community project with the desired functionality.
Once you install and test the debug server, specify it on the last page of the VisualGDB wizard so that VisualGDB will automatically use it to debug your code with Visual Studio.
Examples
See this page for a comprehensive list of tutorials showing how to setup VisualGDB for a specific board.