Sysprogs

  • Products
    • VisualGDB
    • VisualKernel
    • Analyzer2Go
    • SmarTTY
    • GNU Toolchains
    • WinCDEmu
    • WinFlashTool
    • Legacy Products
  • Downloads
    • VisualGDB
    • VisualKernel
    • Analyzer2Go
    • SmarTTY
    • WinCDEmu
    • GNU Toolchains
    • WinFlashTool
  • Tutorials
    • VisualGDB
    • VisualKernel
    • Analyzer2Go
    • WinCDEmu
  • Support
    • Forum
    • Support
    • Documentation
  • Contact
    • Contact
    • Blog
    • About Us

profiler

Profiling Raspberry Pi Pico Projects with VisualGDB

November 1, 2021 profiler, rp2040

This tutorial shows how to profile the Raspberry Pi Pico project that use PicoSDK with VisualGDB. We will create a

Read more

Analyzing Code Coverage for Embedded Projects

December 9, 2019 code coverage, embedded, profiler, stm32

This tutorial shows how to use VisualGDB to analyze the code coverage of embedded projects. We will create a basic

Read more

Profiling Advanced mbed-based Projects with VisualGDB

October 22, 2019 arm, mbed, profiler

This tutorial shows how to use the VisualGDB’s instrumenting profiler and Real-time Watch to analyze the performance of mbed-based projects.

Read more

Profiling RTX-based Projects with the Sampling Profiler

November 19, 2018 arm, keil, profiler, rtx

This tutorial shows how to use the VisualGDB’s sampling profiler to analyze the performance of the projects build with the Keil

Read more

Profiling RTX-based Projects with the Instrumenting Profiler

November 19, 2018 arm, keil, profiler, rtx

This tutorial shows how to profile the RTX-based projects built with the Keil compiler using the VisualGDB’s instrumenting profiler. Before you begin,

Read more

Using Live Profiling to Analyze Critical Parts of Linux Code

May 23, 2018 linux, profiler, valgrind

This tutorial shows how to use the Live Profiling for Linux programs to analyze the relative performance of the critical code without

Read more

Finding Memory Leaks in Linux Programs with VisualGDB

March 7, 2018 linux, profiler, valgrind

This tutorial shows how to find memory leaks in Linux programs using the VisualGDB integration with valgrind. Before you begin,

Read more

Profiling Linux C++ Code with Visual Studio

October 31, 2017 linux, profiler, valgrind

This tutorial shows how to profile C++ code using Visual Studio, valgrind and VisualGDB. We will show how to import

Read more

Monitoring your Embedded Code Performance with Timing Tests

September 6, 2017 arm, profiler, stm32, tests

This tutorial shows how to automatically check the performance of the critical parts of your program using the timing validation

Read more

Using VisualGDB FreeRTOS Tracing to Optimize Real-time Code

January 31, 2017 arm, freertos, profiler, stm32

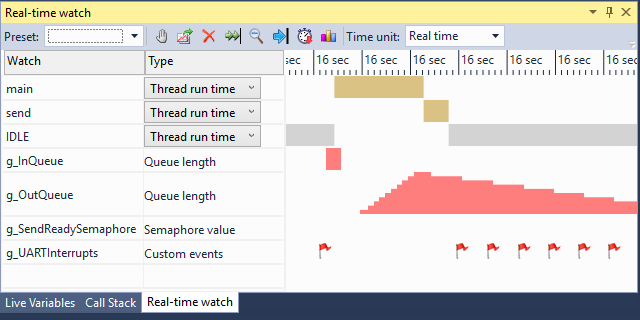
This tutorial shows how to use the FreeRTOS tracing feature of VisualGDB to optimize a simple FreeRTOS UART driver based

Read more
  • ← Previous

Categories

  • Documentation
    • Advanced
    • Embedded Projects
    • General
    • IntelliSense
    • Linux
    • Profiler
    • Project Types
    • Tests
    • Troubleshooting
  • Tutorials
    • Android
      • Cocos2d-x
      • Integration with other tools
    • Archive
      • Android
      • Embedded
      • Linux
    • Arduino
    • CMake
    • Continuous Integration
    • Customization
      • FreeBSD
      • SDK
    • Embedded
      • ARM Features
      • CMake
      • ESP8266/ESP32
      • Getting Started with Boards
      • Internet of Things
      • mbed
      • MSP430
      • RTOS
      • STM32 Boards & Tools
      • STM32 Peripherals
    • IntelliSense
    • Linux
      • Beaglebone
      • Cubieboard
      • Linux Frameworks & Tools
      • Raspberry Pi
    • Porting
    • Profiler
      • Embedded
      • Linux
      • Real-Time Watch
    • Unit Tests
    • Windows
      • Cygwin
      • MinGW
  • Uncategorised

Tags

android android samples arduino arm beaglebone bluetooth cmake CodeExplorer cross-compile custom embedded embedded cmake esp32 esp8266 freertos HTTP import intellisense IoT keil kinetis lcd led library linux mbed msbuild nrf51 nxp openocd porting profiler python qt quickstart raspberry raspberry pi rp2040 ssh stm32 tests troubleshooting uart WiFi win32
© 2012-2022 Sysprogs OÜ. All rights reserved.

Terms of Use | Copyright | Privacy Policy