Monitoring your Embedded Code Performance with Timing Tests
This tutorial shows how to automatically check the performance of the critical parts of your program using the timing validation steps in VisualGDB Embedded Integration Tests. We will create a simple embedded program that will generate a sine wave and output it to the UART port using DMA, computing half the frame at a time. We will then explore the conditions where the signal generation takes the most time and show how to create an embedded integration test to automatically reproduce those conditions and validate the timing to detect potential overruns.
Before you begin, install VisualGDB 5.3 or later.
- Start Visual Studio and open VisualGDB Embedded Project Wizard:
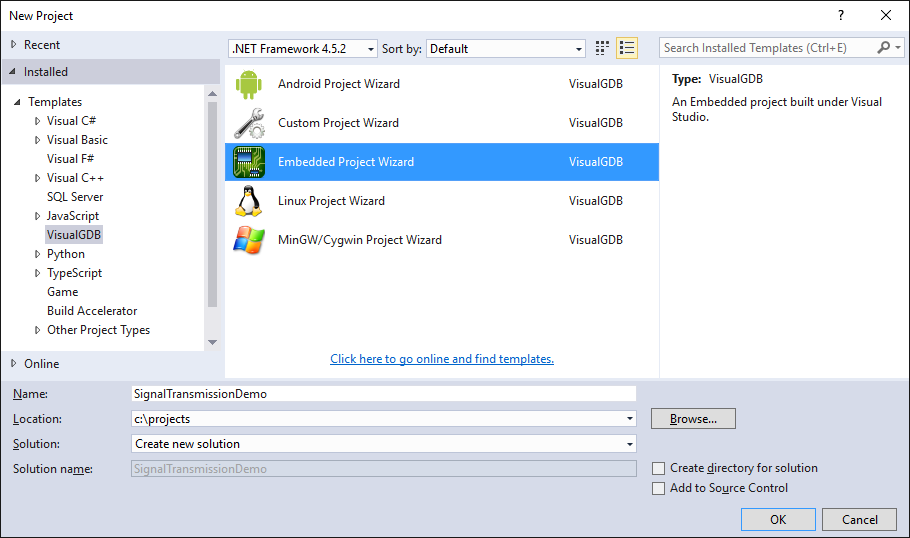
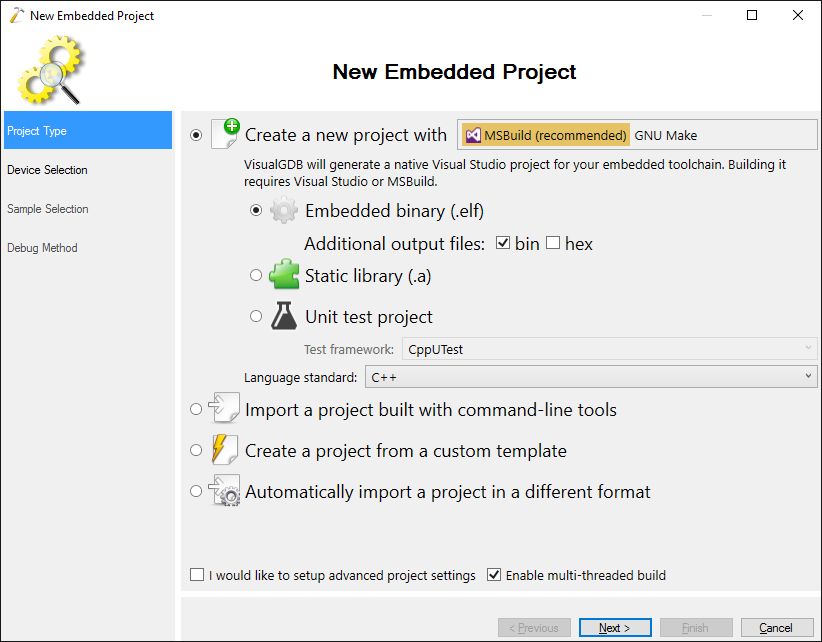
- Select “Create a new project -> MSBuild -> Embedded binary”:
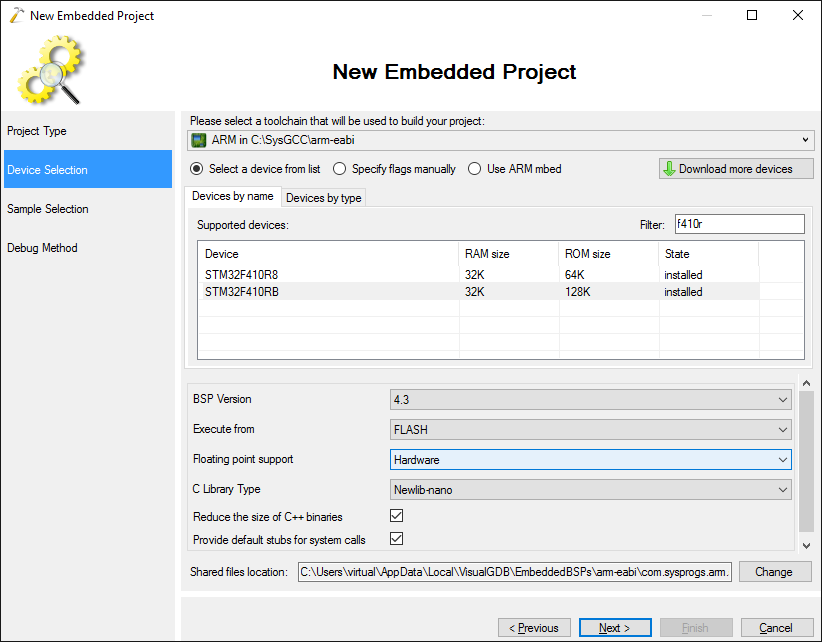
- On the next step select the ARM toolchain and your device. In this tutorial we will use the STM32F410-Nucleo board that has the STM32F410RB microcontroller. Then select “Hardware” in the “Floating point support” setting:
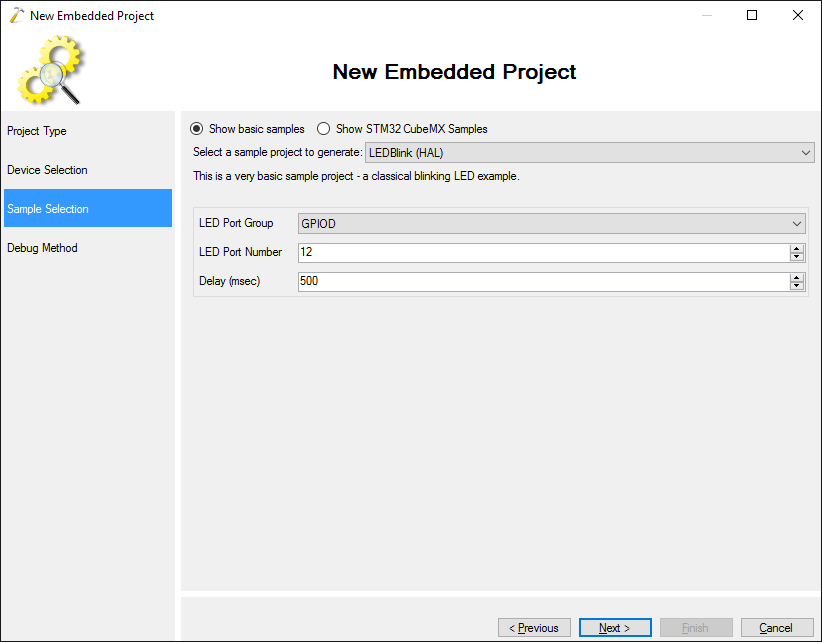
- On the sample selection page proceed with the default settings and press “Next”:
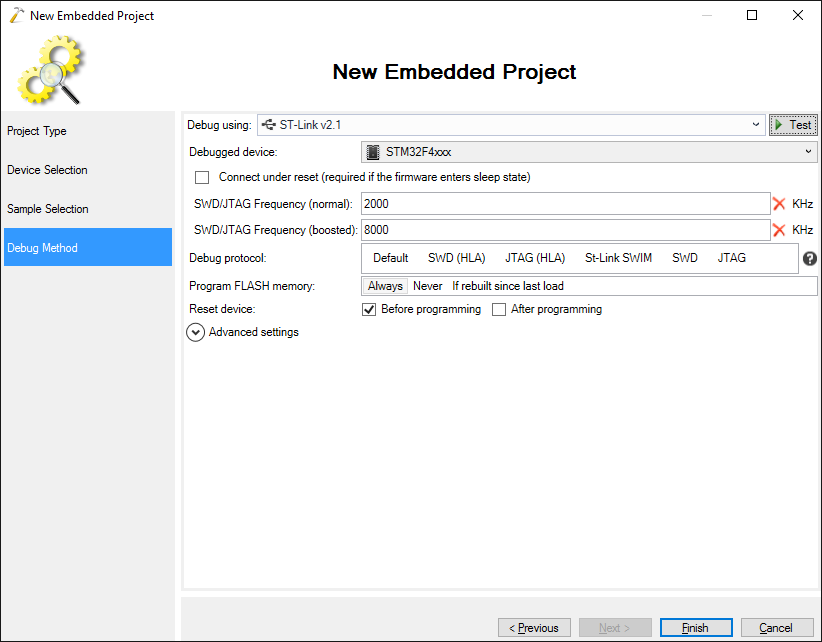
- Connect your board via USB so that VisualGDB can recognize the ST-Link and configure debug settings automatically and press “Finish” to generate the project:
- Replace the contents of the main source file with the following code:
#include <stm32f4xx_hal.h>
#include <stm32_hal_legacy.h>

#ifdef __cplusplus
extern "C"
#endif
void SysTick_Handler(void)
{
    HAL_IncTick();
    HAL_SYSTICK_IRQHandler();
}

static DMA_HandleTypeDef s_DMAHandle = DMA_HandleTypeDef();
static UART_HandleTypeDef s_UARTHandle = UART_HandleTypeDef();

enum { kBufferSize = 512 };
static int s_Buffer[kBufferSize];

#include <math.h>
#include <string.h>

extern "C" void __attribute__((noinline)) FillFrame(int *pFrame, int sampleCount)
{
    static float s_Argument = 0;
    for (int i = 0; i < sampleCount; i++)
    {
        pFrame[i] = sinf(s_Argument) * INT32_MAX;
        s_Argument += 0.05;
    }
}

void HAL_UART_TxHalfCpltCallback(UART_HandleTypeDef *huart)
{
    FillFrame(s_Buffer, kBufferSize / 2);
}

void HAL_UART_TxCpltCallback(UART_HandleTypeDef *huart)
{
    FillFrame(s_Buffer + kBufferSize / 2, kBufferSize / 2);
}

extern "C" void DMA1_Stream6_IRQHandler()
{
    HAL_DMA_IRQHandler(&s_DMAHandle);
}

int s_Counter = 0;

int main(void)
{
    HAL_Init();

    __USART2_CLK_ENABLE();
    __DMA1_CLK_ENABLE();
    __GPIOA_CLK_ENABLE();

    GPIO_InitTypeDef GPIO_InitStructure;

    GPIO_InitStructure.Pin = GPIO_PIN_2;

    GPIO_InitStructure.Mode = GPIO_MODE_AF_PP;
    GPIO_InitStructure.Alternate = GPIO_AF7_USART2;
    GPIO_InitStructure.Speed = GPIO_SPEED_HIGH;
    GPIO_InitStructure.Pull = GPIO_NOPULL;
    HAL_GPIO_Init(GPIOA, &GPIO_InitStructure);

    s_DMAHandle.Instance = DMA1_Stream6;
    s_DMAHandle.Init.Channel = DMA_CHANNEL_4;

    s_DMAHandle.Init.Direction = DMA_MEMORY_TO_PERIPH;
    s_DMAHandle.Init.PeriphInc = DMA_PINC_DISABLE;
    s_DMAHandle.Init.MemInc = DMA_MINC_ENABLE;
    s_DMAHandle.Init.Mode = DMA_CIRCULAR;

    s_DMAHandle.Init.Priority = DMA_PRIORITY_VERY_HIGH;

    s_DMAHandle.Init.PeriphDataAlignment = DMA_PDATAALIGN_BYTE;
    s_DMAHandle.Init.MemDataAlignment = DMA_PDATAALIGN_BYTE;

    if (HAL_DMA_Init(&s_DMAHandle) != HAL_OK)
        asm("bkpt 255");

    s_UARTHandle.Instance        = USART2;
    s_UARTHandle.Init.BaudRate   = 115200;
    s_UARTHandle.Init.WordLength = UART_WORDLENGTH_8B;
    s_UARTHandle.Init.StopBits   = UART_STOPBITS_1;
    s_UARTHandle.Init.Parity     = UART_PARITY_NONE;
    s_UARTHandle.Init.HwFlowCtl  = UART_HWCONTROL_NONE;
    s_UARTHandle.Init.Mode       = UART_MODE_TX;

    if (HAL_UART_Init(&s_UARTHandle) != HAL_OK)
        asm("bkpt 255");

    __HAL_LINKDMA(&s_UARTHandle, hdmatx, s_DMAHandle);

    FillFrame(s_Buffer, kBufferSize / 2);
    if (HAL_UART_Transmit_DMA(&s_UARTHandle, (uint8_t *)s_Buffer, sizeof(s_Buffer)) != HAL_OK)
        asm("bkpt 255");

    NVIC_EnableIRQ(DMA1_Stream6_IRQn);

    bool tmp = false;
    for (;;)
    {
        s_Counter++;
    }
}
This code configures UART2 to continuously transmit the data from the s_Buffer buffer, invoking HAL_UART_TxHalfCpltCallback() and HAL_UART_TxCpltCallback() when the first and the second half of the buffer is transmitted respectively. This technique is known as double-buffering and allows outputting the sine wave signal continuously (we are only outputting the 32-bit values corresponding to the sine wave, to get an actual analog wave you would need to stream those values into a digital-to-analog converter).
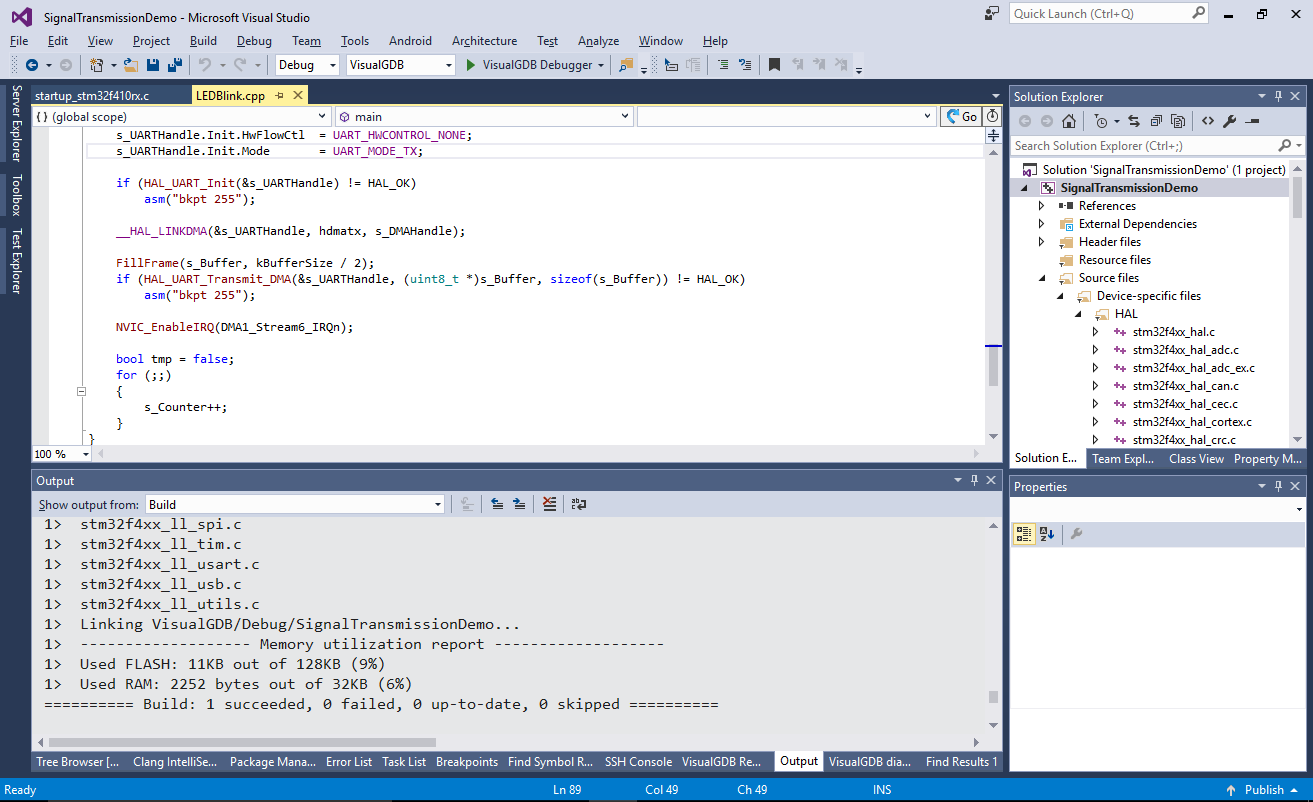
- Build the project and ensure it succeeds:
- Do a quick check by putting the breakpoint in HAL_UART_TxCpltCallback() and viewing s_Buffer via Visual Watch:
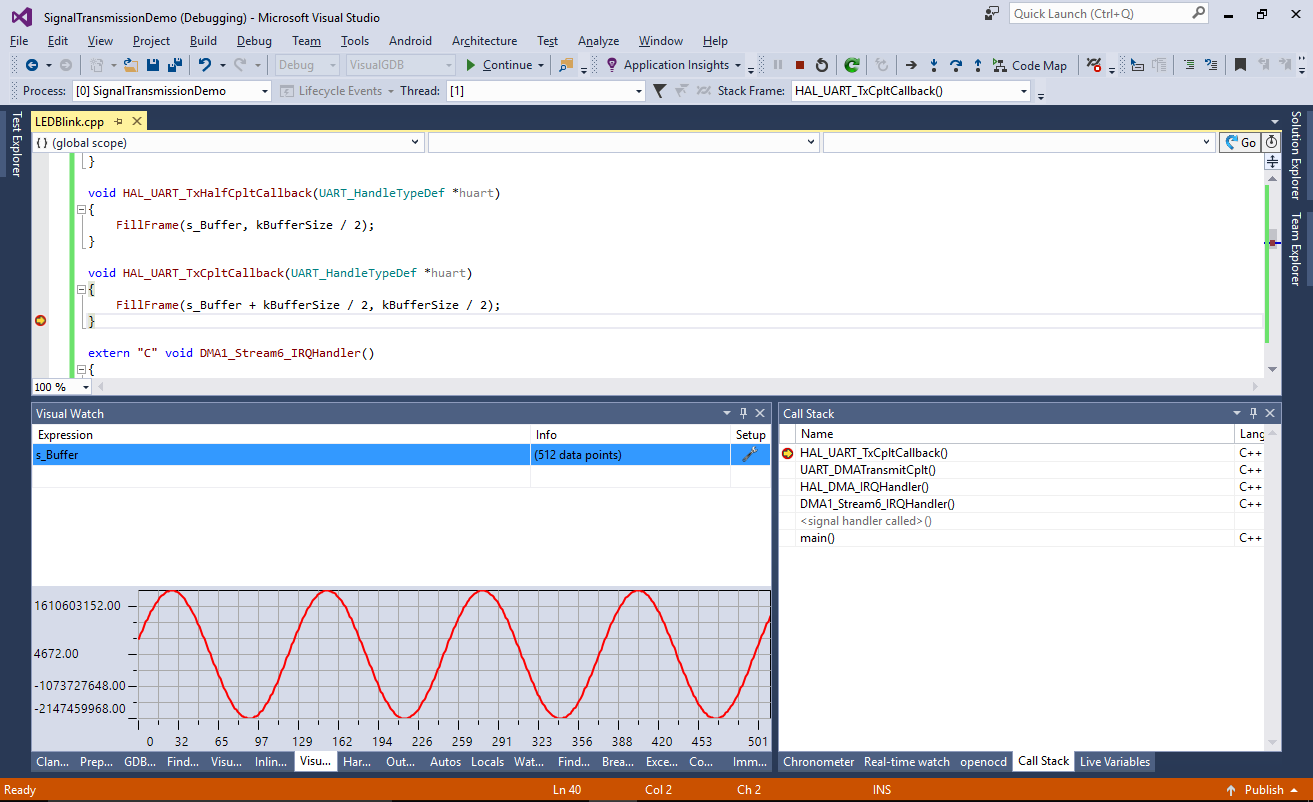 Ensure that the generated values look like an actual sine wave.
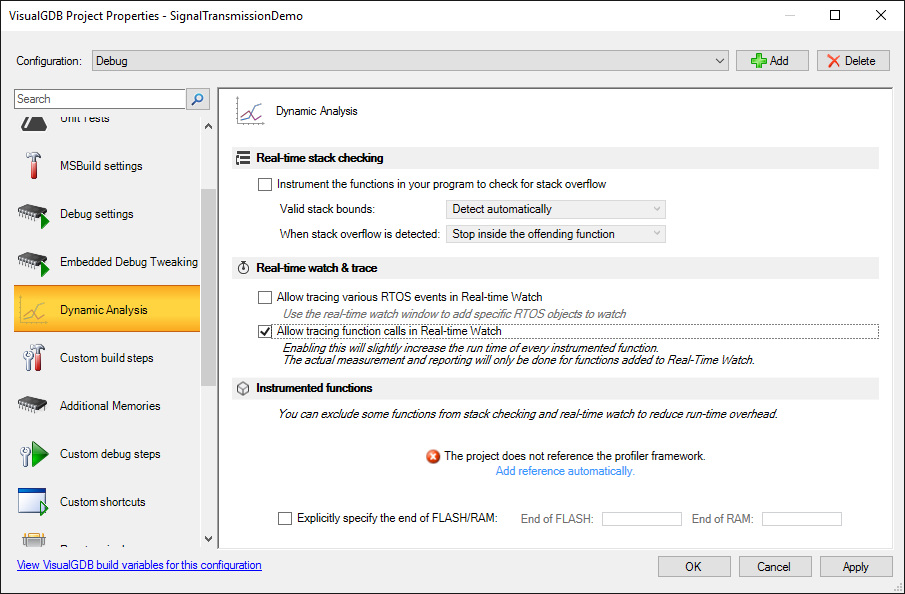
 - Before we start adding tests, we will quickly visualize the program behavior using the real-time watch. Open the Dynamic Analysis page of VisualGDB Project Properties and enable tracing of function calls:
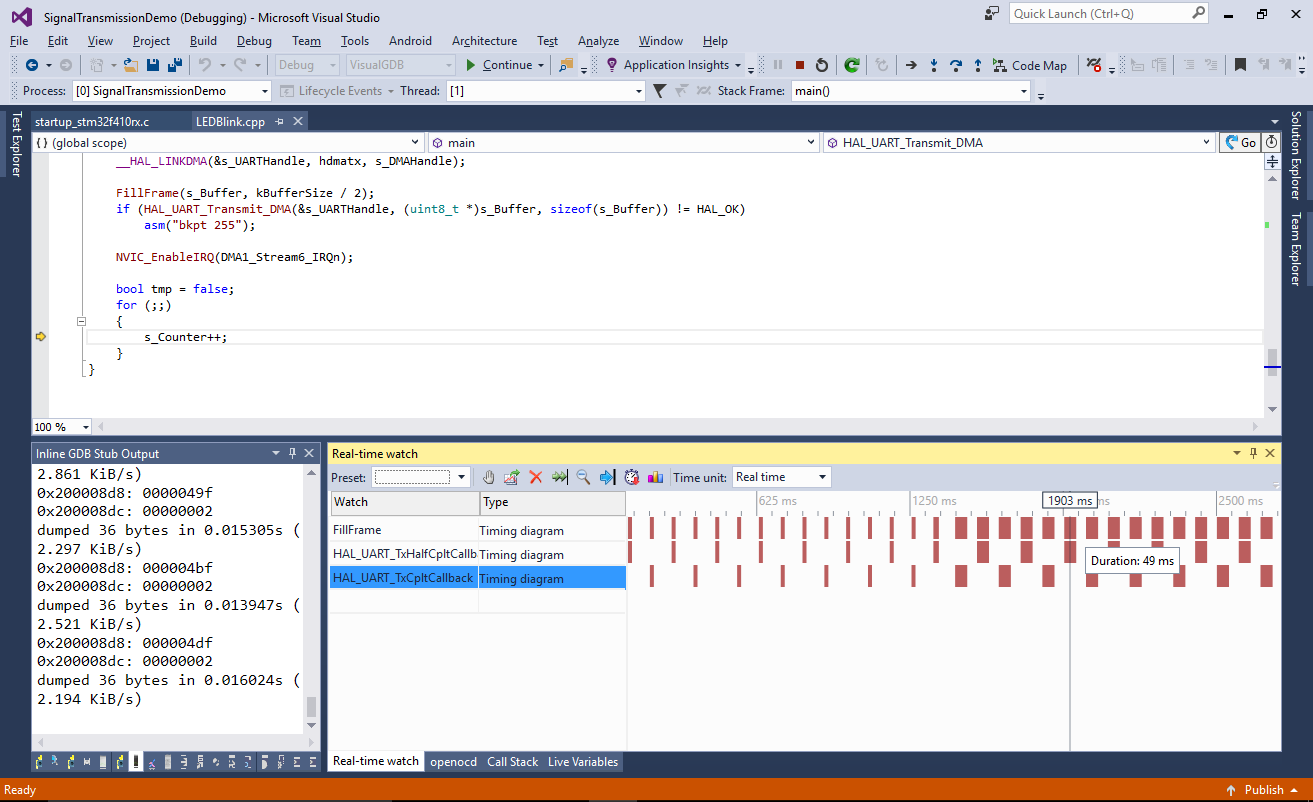
- Note how after some time the execution times of sinf() significantly increase (due to large value of the argument). This could be easily optimized by subtracting 2 * pi from the argument, however we will purposefully omit this optimization in this tutorial to demonstrate how to test conditions that don’t occur in the program immediately:
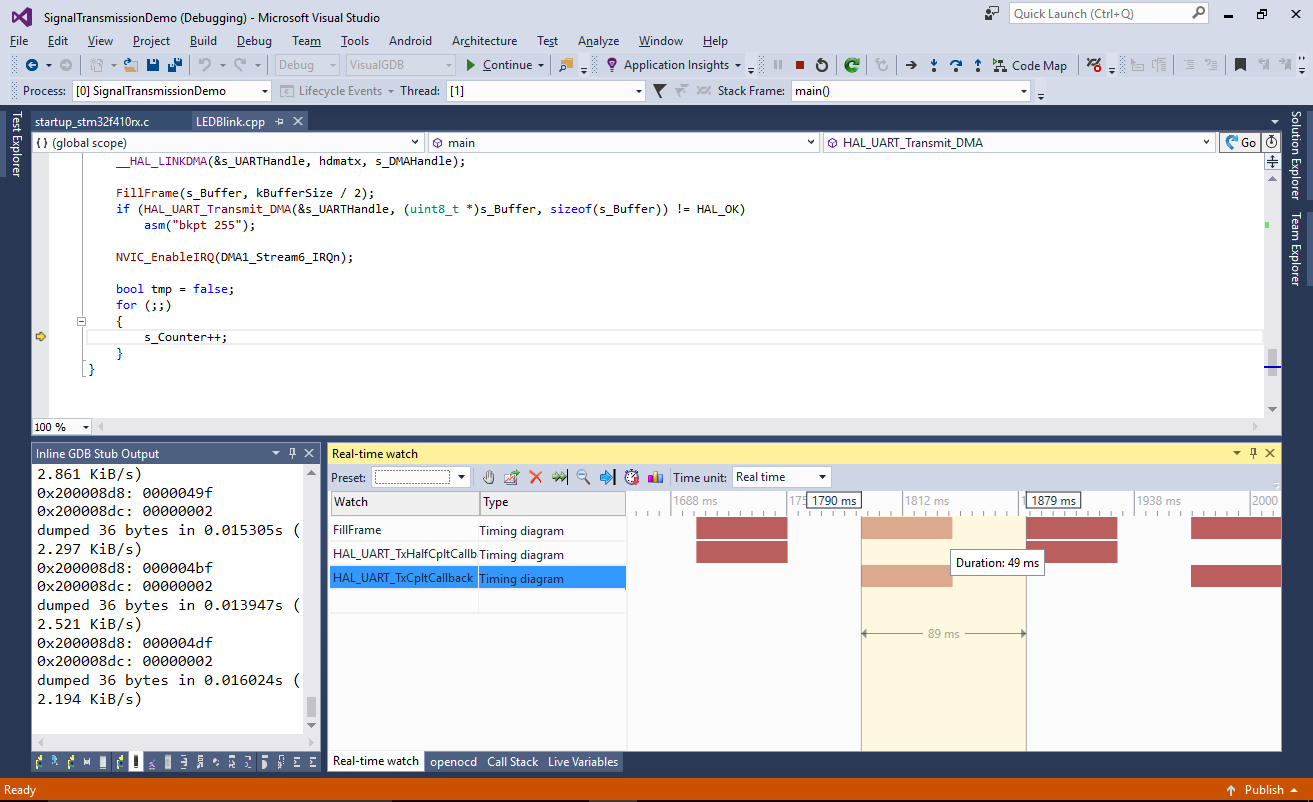
- Zoom in and note the time between subsequent invocations of FillFrame(). On STM32F410-Nucleo with default settings, FillFrame() takes 49 milliseconds while the time required to transfer 256 words of data (=1KB) at 115200 bits per second with one stop and one start bit is 1 / (115200 / 10 / 1024) = ~ 89 milliseconds:
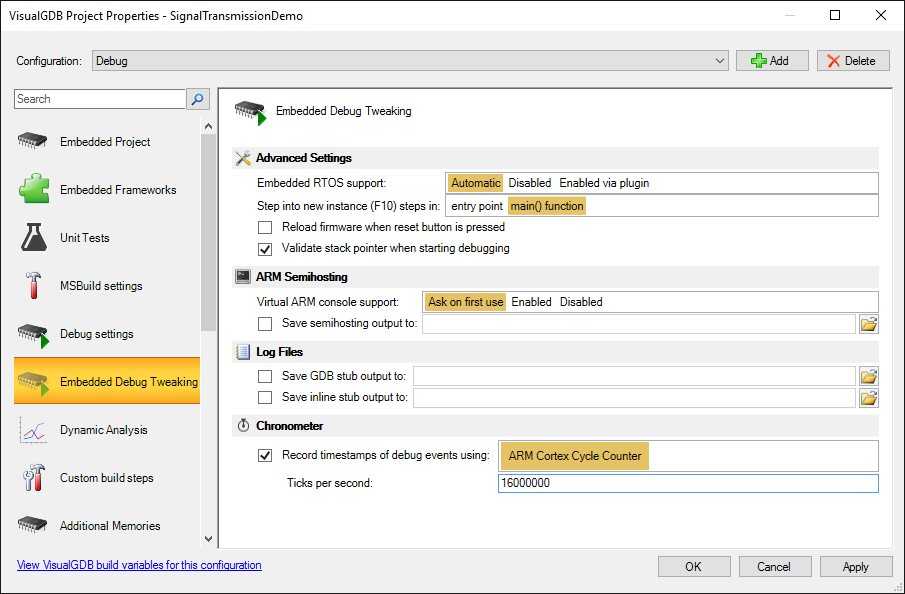
- Using real-time watch introduces a significant overhead to your program due to the necessity to instrument all functions and report their timing. The timing tests instead use a much more lightweight mechanism – Chronometer. You can enable it on the Embedded Debug Tweaking page of VisualGDB Project Properties:
 Do not forget to disable real-time watch. Chronometer and real-time watch both use the ARM Cortex instruction counter register and are hence incompatible with each other.
 - Once the chronometer is enabled, set a breakpoint at the call to HAL_UART_Transmit_DMA() and start your program. Once the breakpoint hits, set a breakpoint in HAL_UART_TxHalfCpltCallback() and continue the program so that the breakpoint hits. Then step over the FillFrame() call:
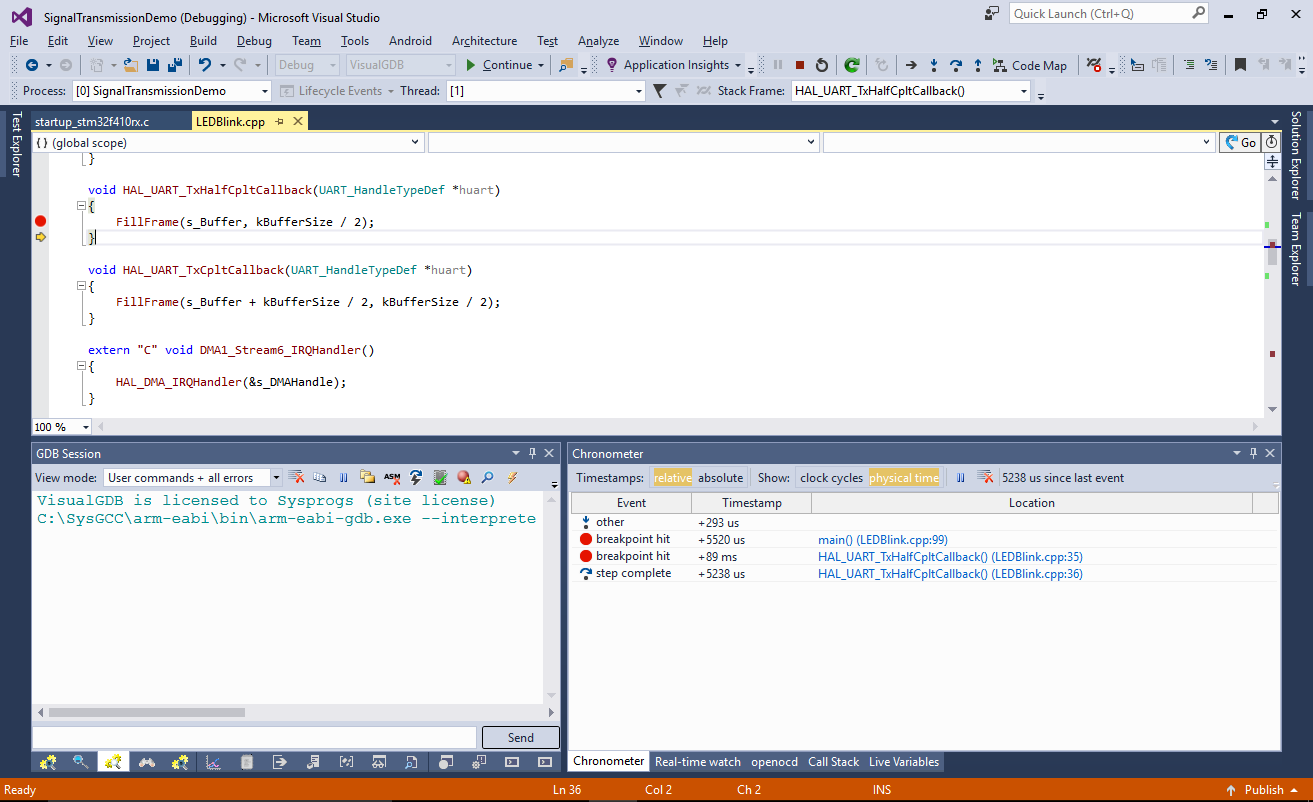 Observe the timings shown in the chronometer. Those timings are obtained by reading the cycle count register each time VisualGDB stops at a debug event, so they don’t introduce any overhead. Note how the time between the initial breakpoint near HAL_UART_Transmit_DMA() and the HAL_UART_TxHalfCpltCallback() matches the previously measured interval of 89 milliseconds.
 - Disable the breakpoints and let the program run for a while. Then re-enable the breakpoint at HAL_UART_TxHalfCpltCallback() and step over FillFrame() again:
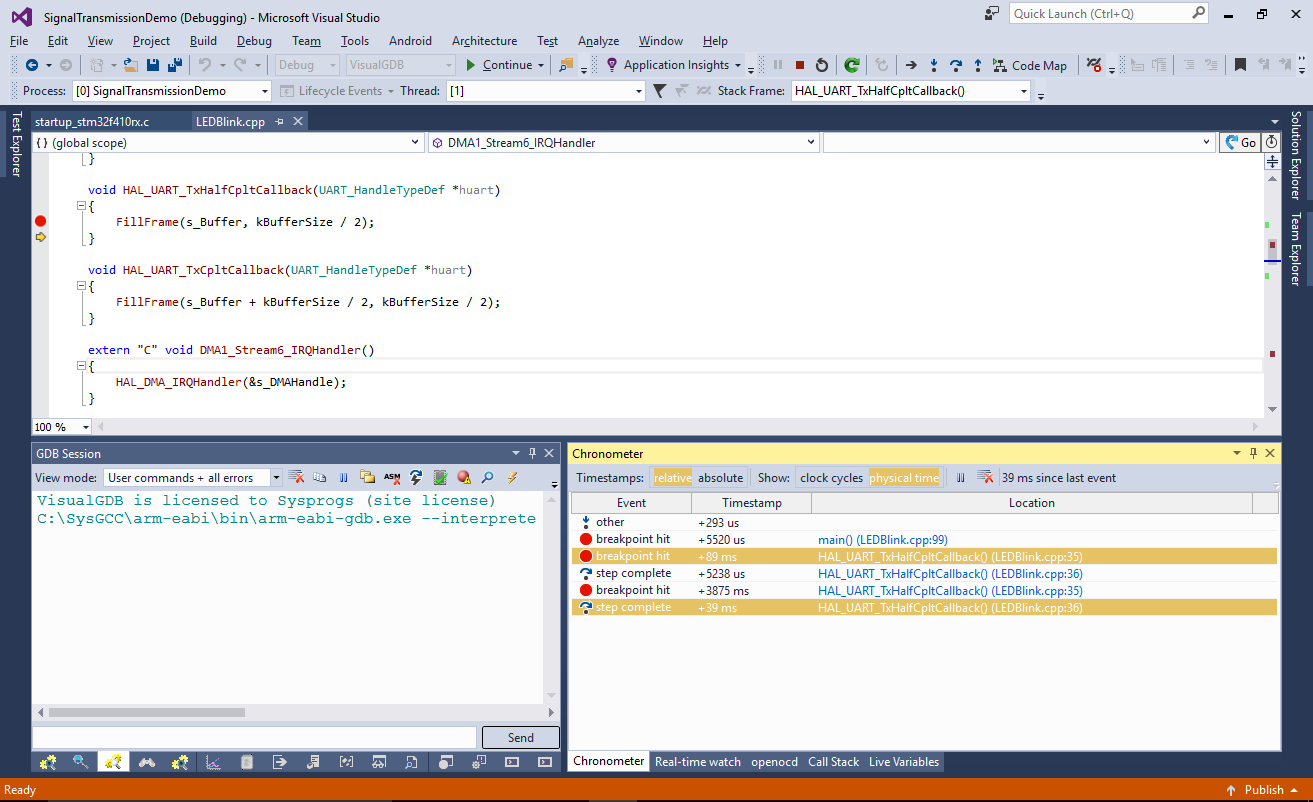 See how FillFrame() now takes 39 milliseconds (confirming the value measured with Real-Time Watch).
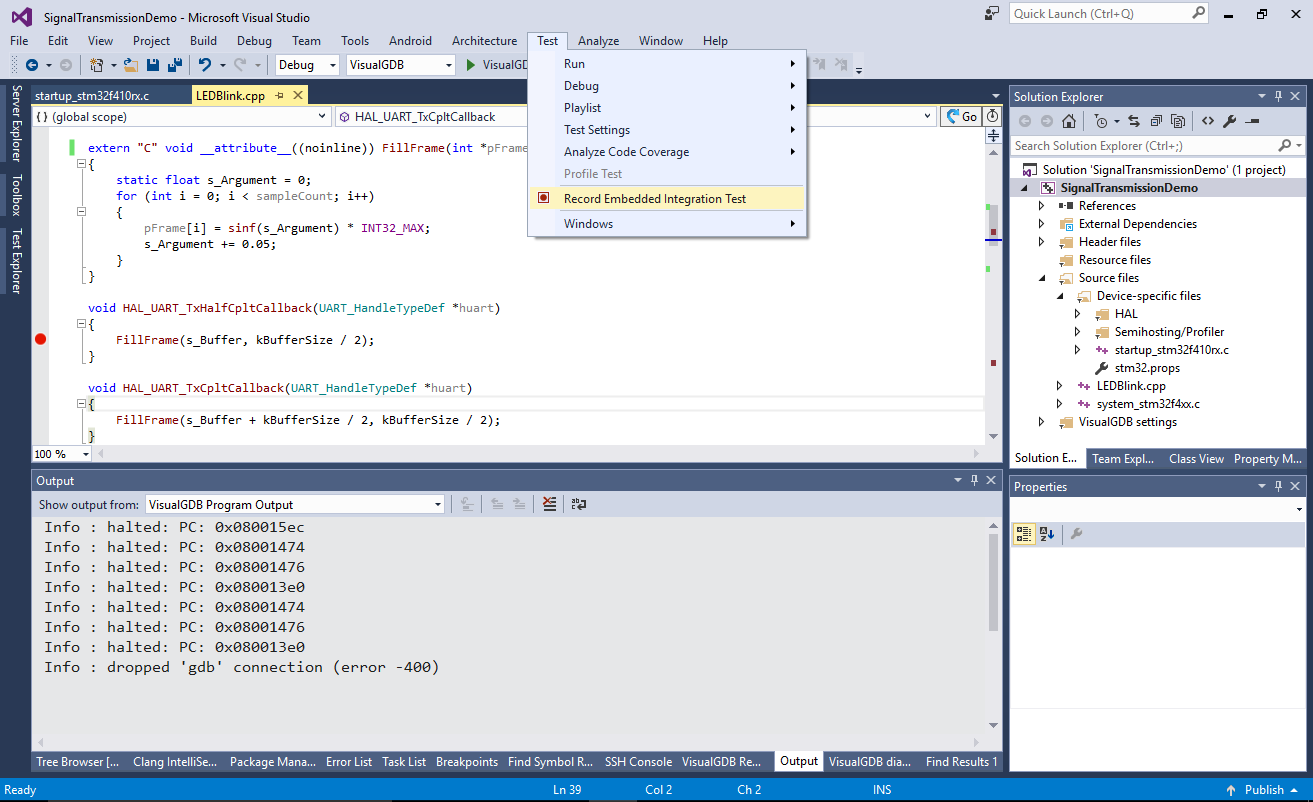
Warning: even when your program is stopped at the debugger, the DMA and UART will continue to run in the background. Hence the timings between consequent UART interrupts will appear minimal. This is the expected behavior, so you can only reliably measure the time between interrupts if you start measuring before DMA is activated. - Now we will create an integration test that will automatically check the timings each time you run it and report if they change uenxpectedly. Select Test->Record Embedded Integration Test:
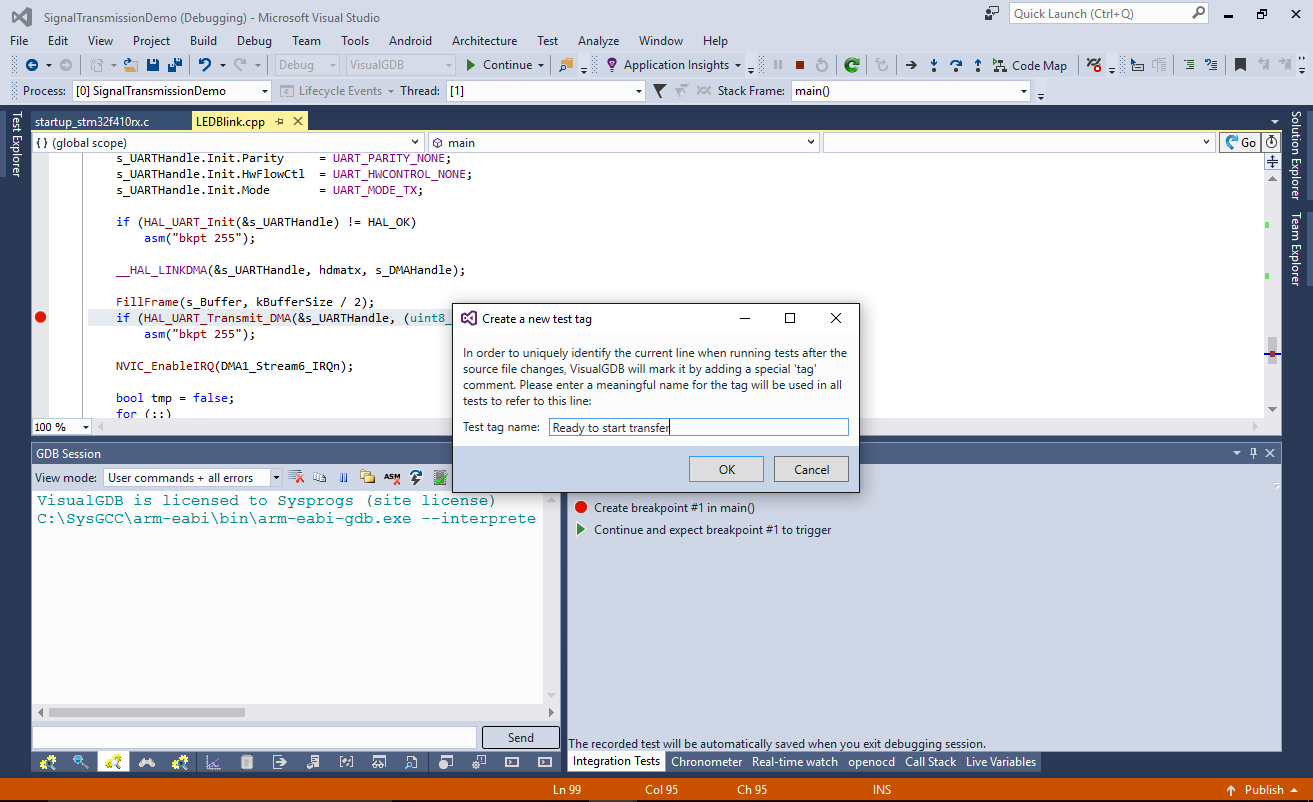
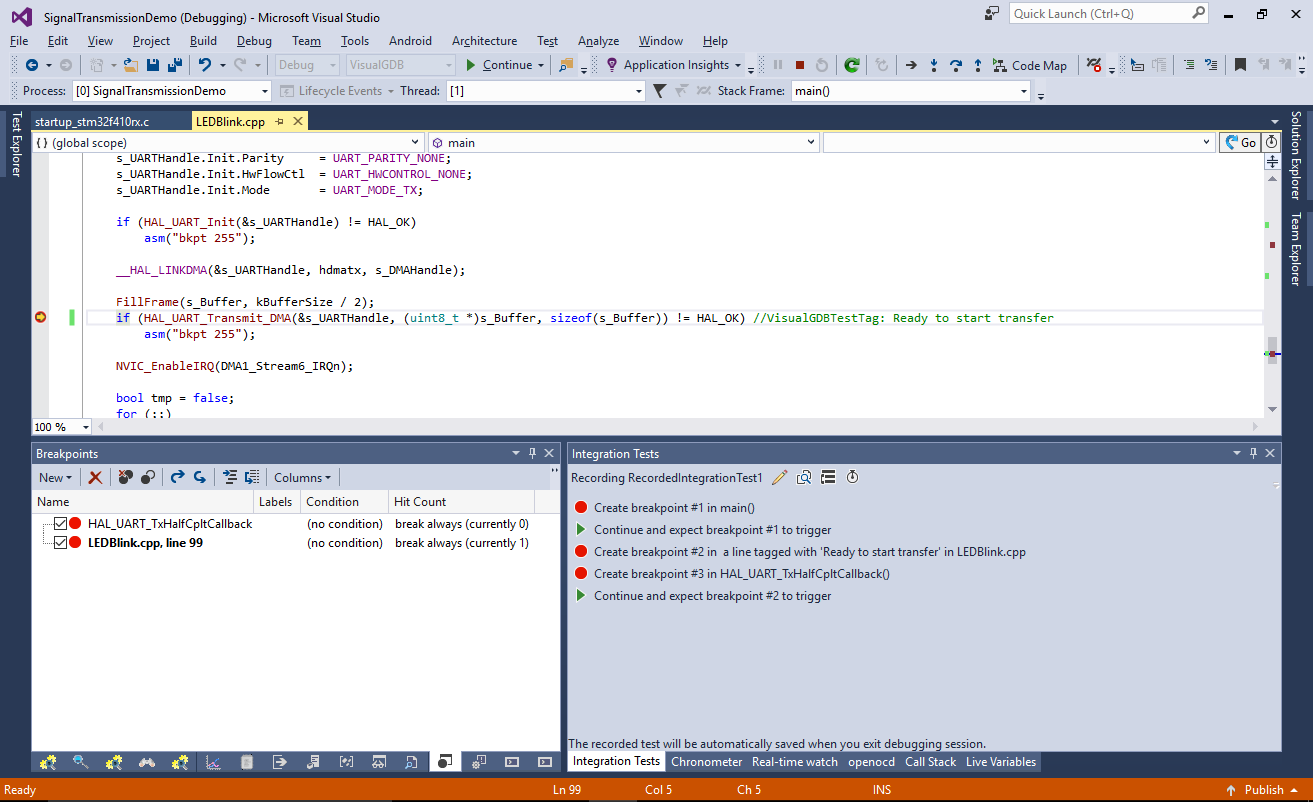
- VisualGDB will start another debugging session and will begin recording your actions. Set a breakpoint on the call to HAL_UART_Transmit_DMA(). VisualGDB will prompt to tag the line with a meaningful tag so that it can always find it even if your code changes:
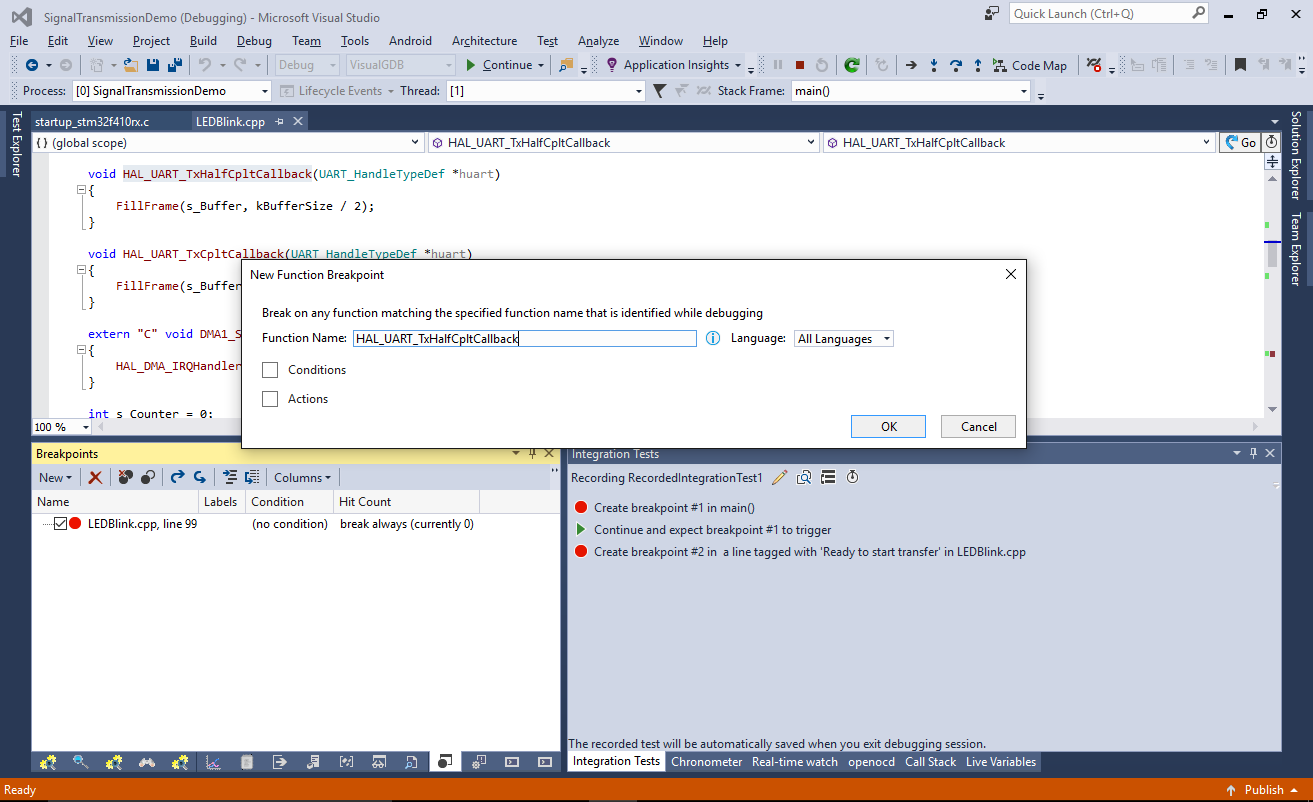
- Set another breakpoint in HAL_UART_TxHalfCpltCallback(). You can set breakpoints via function name to avoid creating unnecessary code tags:
- Press F5 and let the first breakpoint trigger:
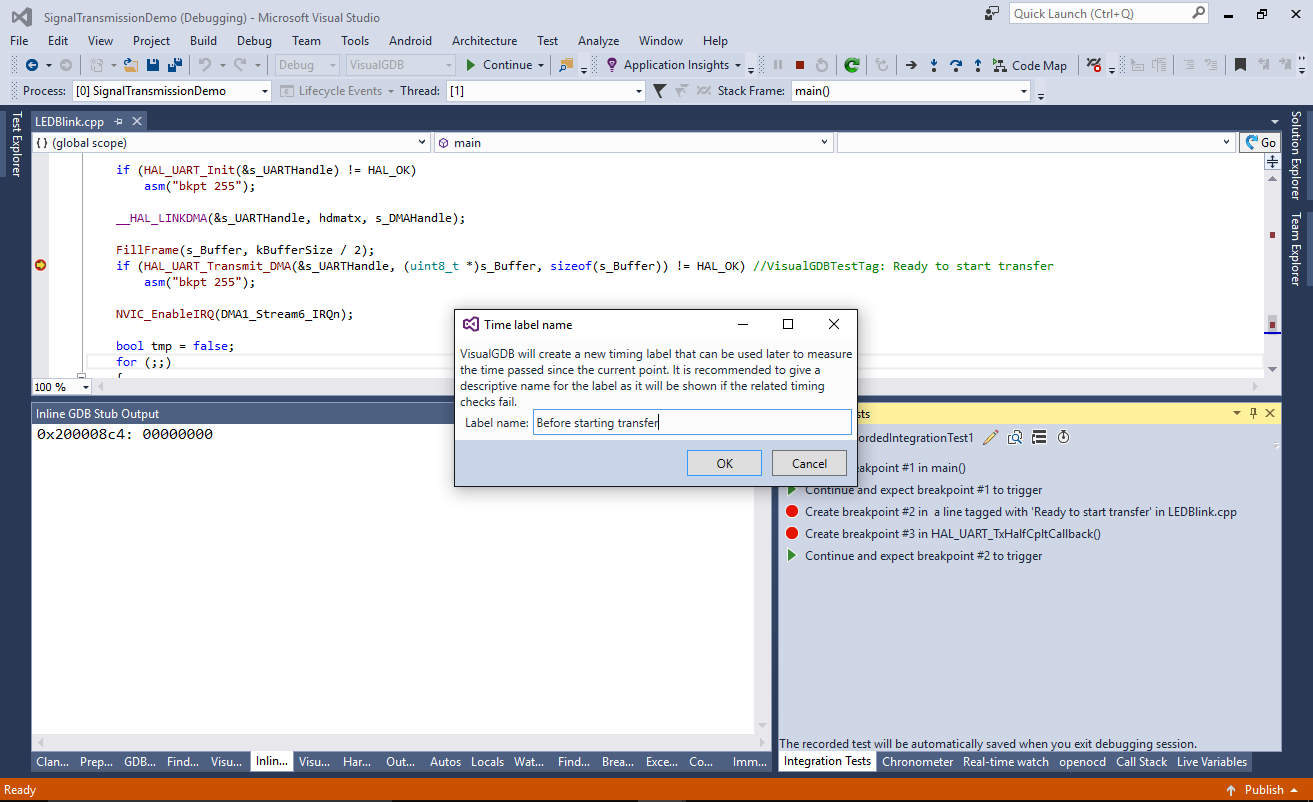
- Click the timer button in the Integration Tests window and select “Add a new time label”. Enter a meaningful name (e.g. “Before starting transfer”):
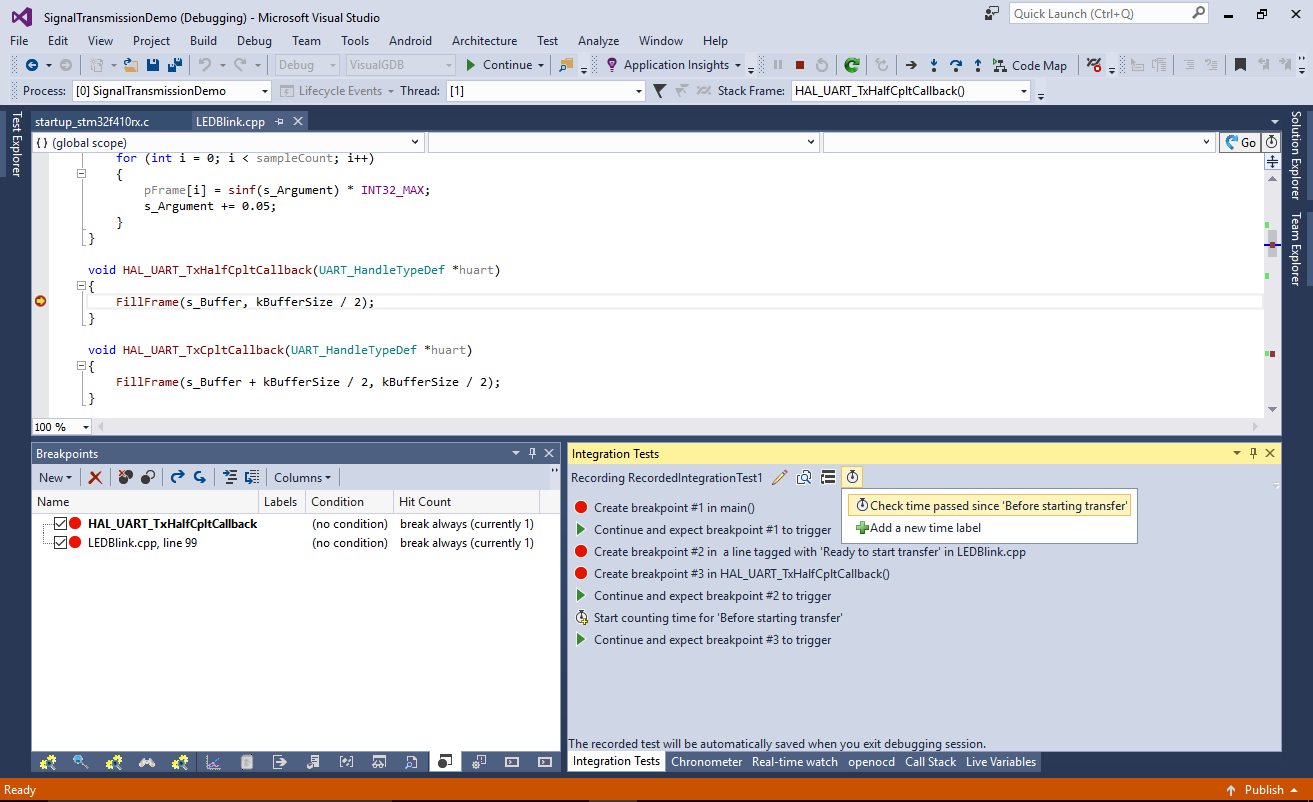
- Press F5 and let the second breakpoint trigger. Now select “Check time passed since ‘Before starting transfer'”:
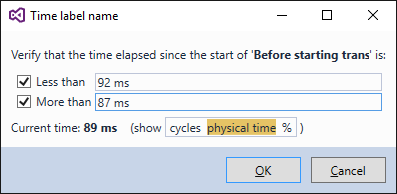
- Set a constraint that the time should be between 87 and 92 ms. This will help catch accidental changes to UART parameters that would alter the timing:
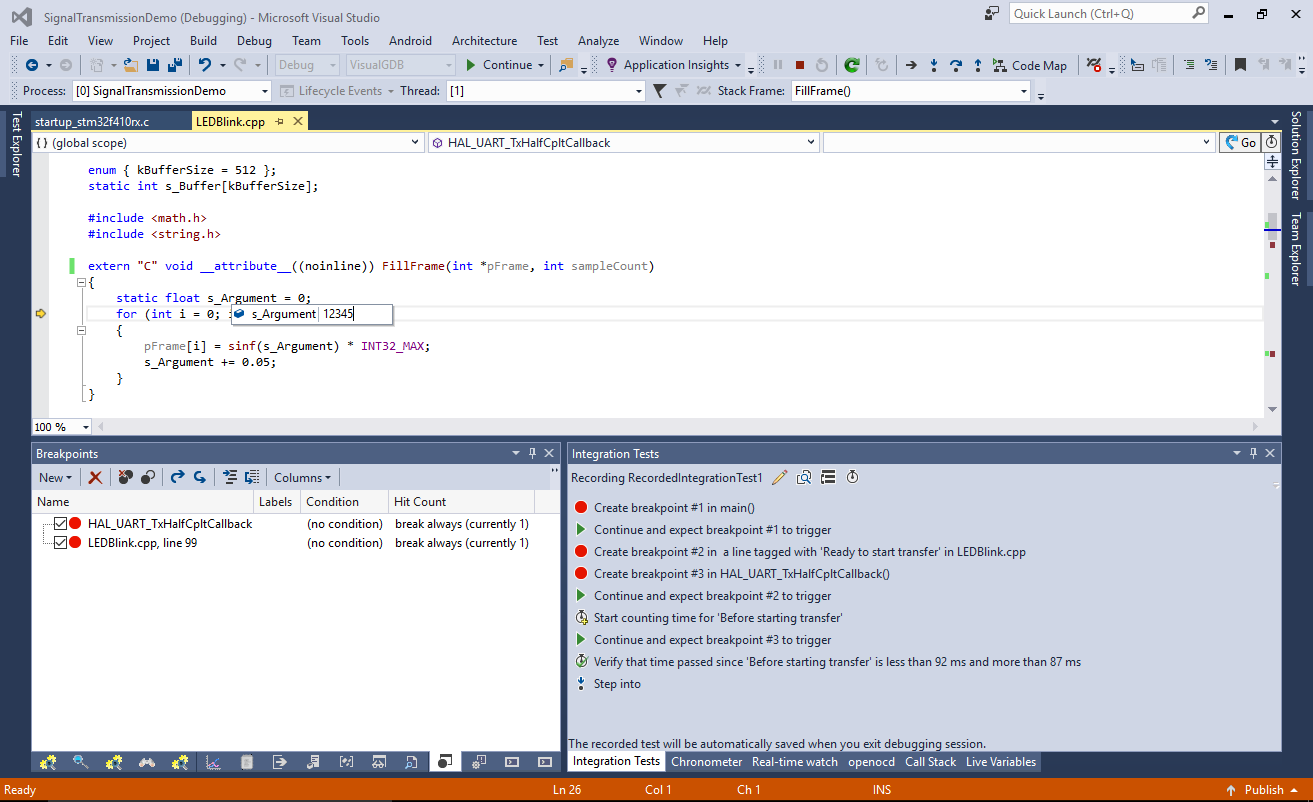
- Step into the FillFrame() function. In order to reproduce the longest computation time manually set s_Argument to a large value (e.g. 12345):
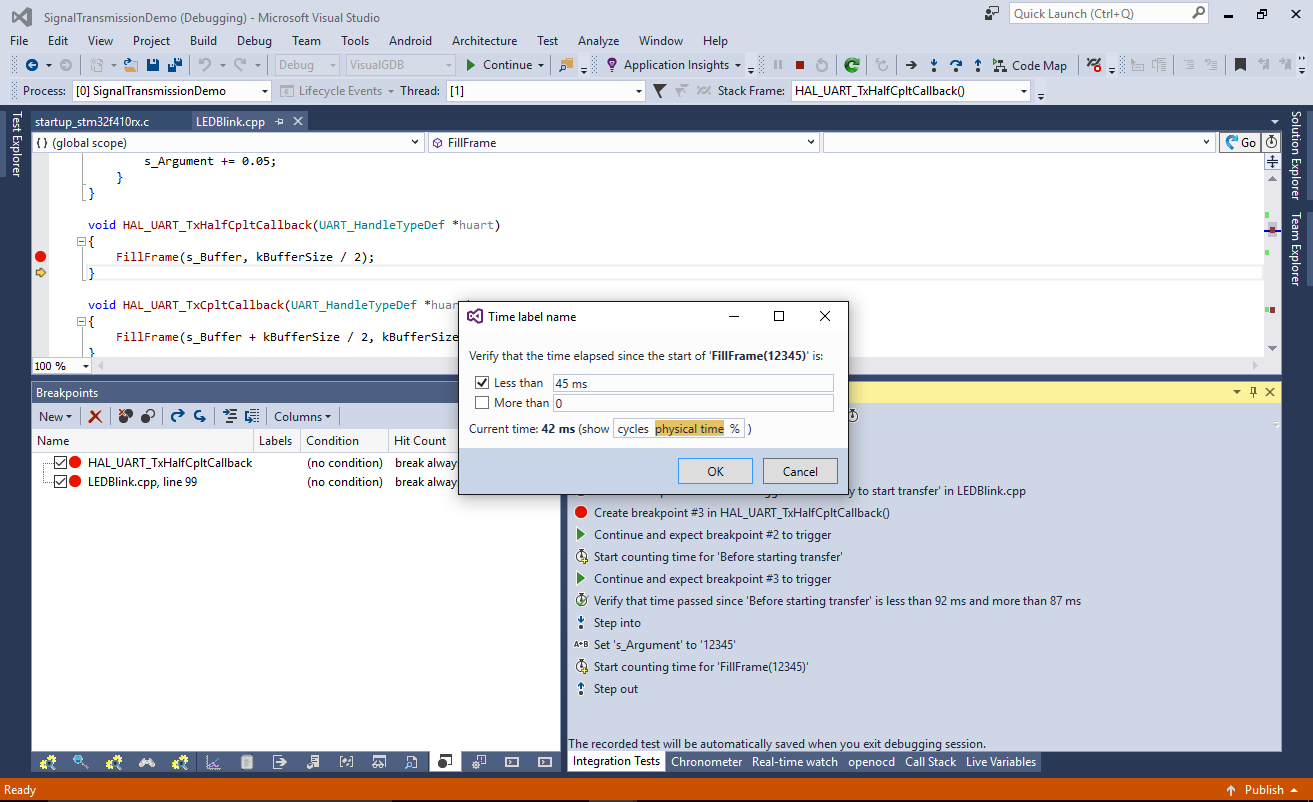
- Then create another time label and step out of the function. Add a check that nor more than 45 milliseconds have elapsed:
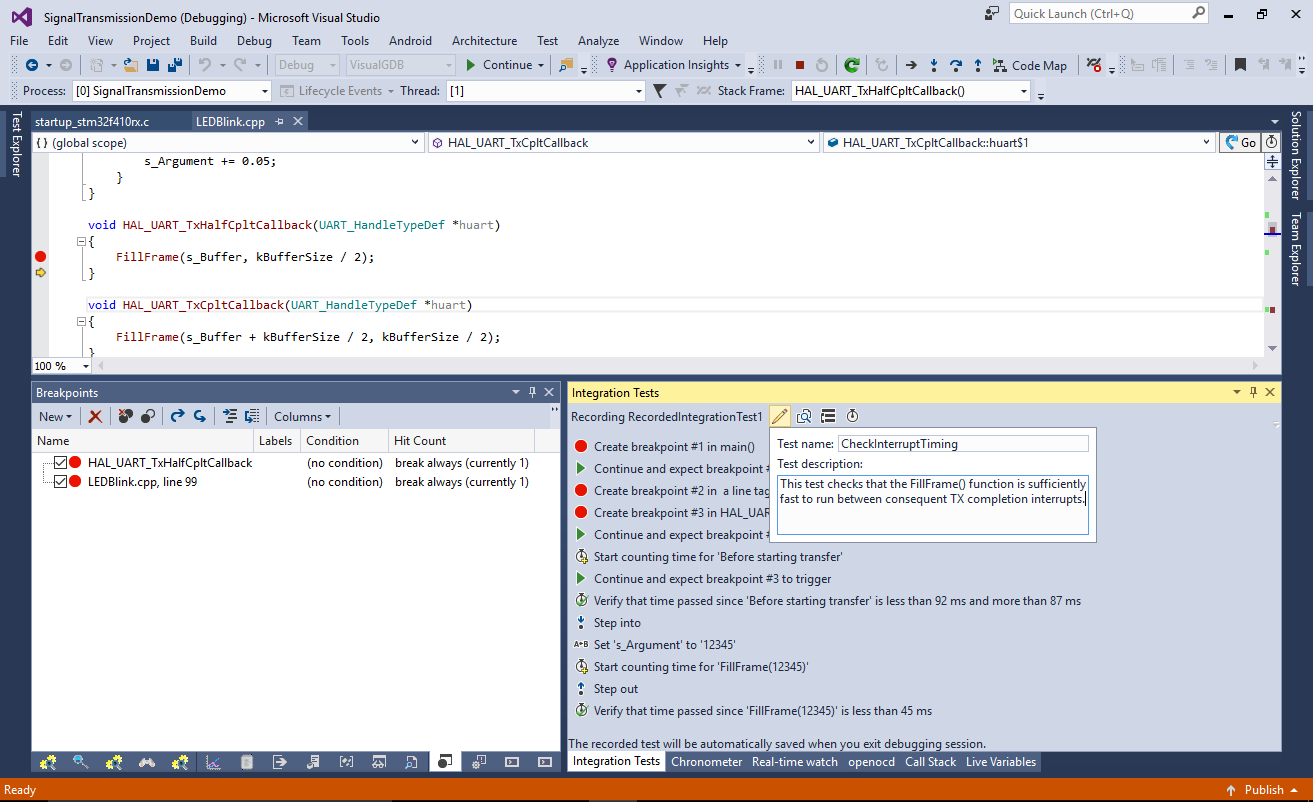
- Finally use the “edit” button to add a meaningful name and description for the test. When done, press Shift-F5 to stop debugging and automatically save the recorded test:
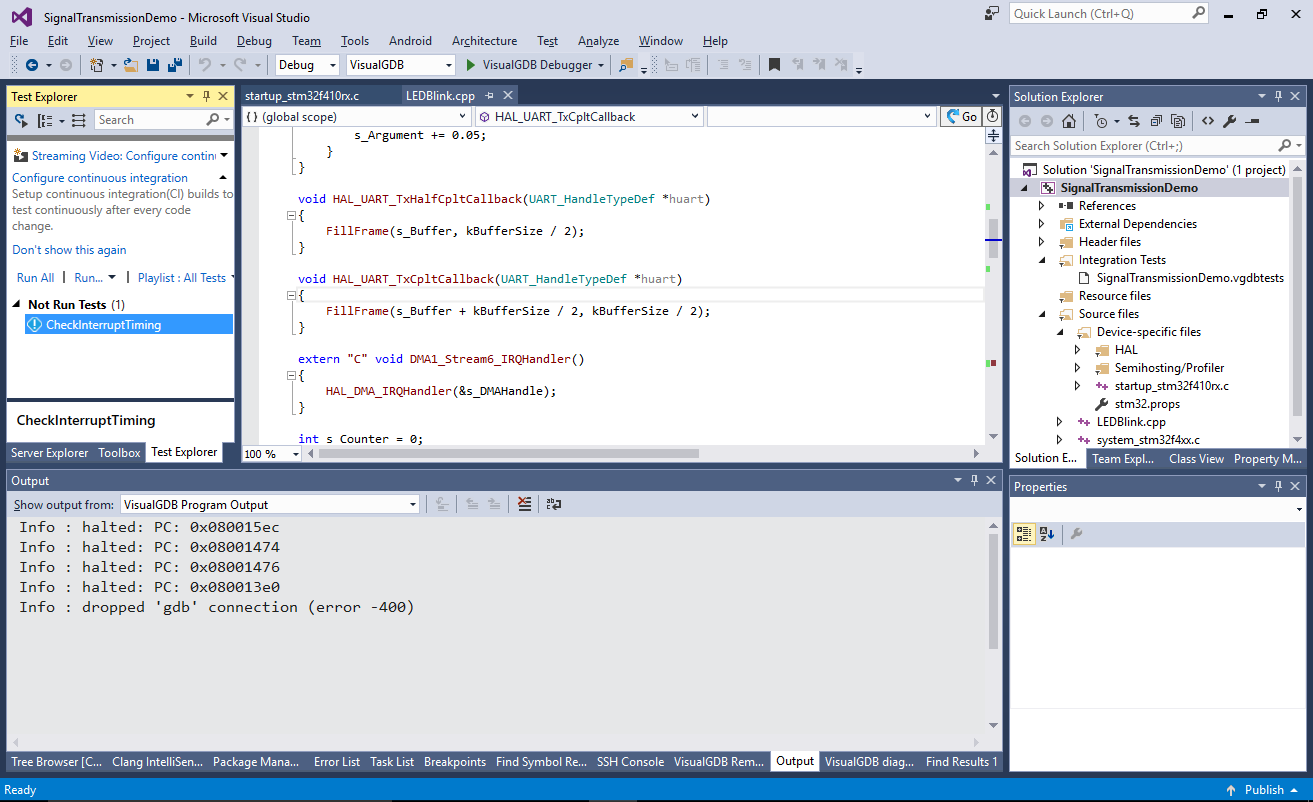
- The test will now appear in the Visual Studio Test Explorer window:
- You can run it by right-clicking on it and selecting “Run Selected Tests” or “Debug Selected Tests”. The second option will run the test in foreground, showing its progress and will stop the debugger in case any of the steps fails:
- Once the test succeeds, switch the Output window to “Test” mode to see the test run details. VisualGDB will log the timings of all checked constraints, so you can quickly compare the values after changing the related code:

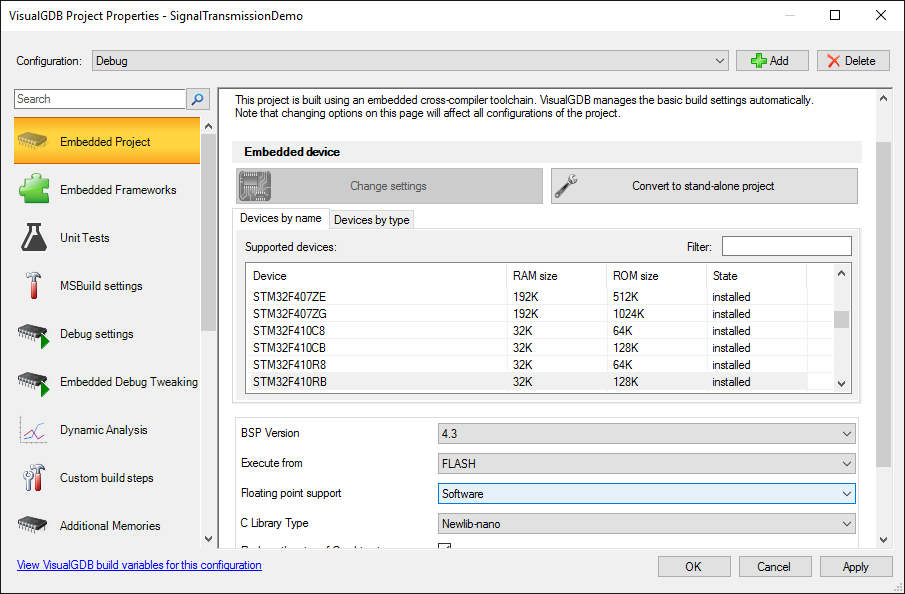
- Now we will change the floating-point support to Software and observe how this affects the program:
- Try adding s_Counter and s_Argument to Live Variables (move s_Argument to global scope to achieve this) and run the program. See how s_Counter stops counting and s_Argument slows down after sinf() becomes too slow due to increased argument value:
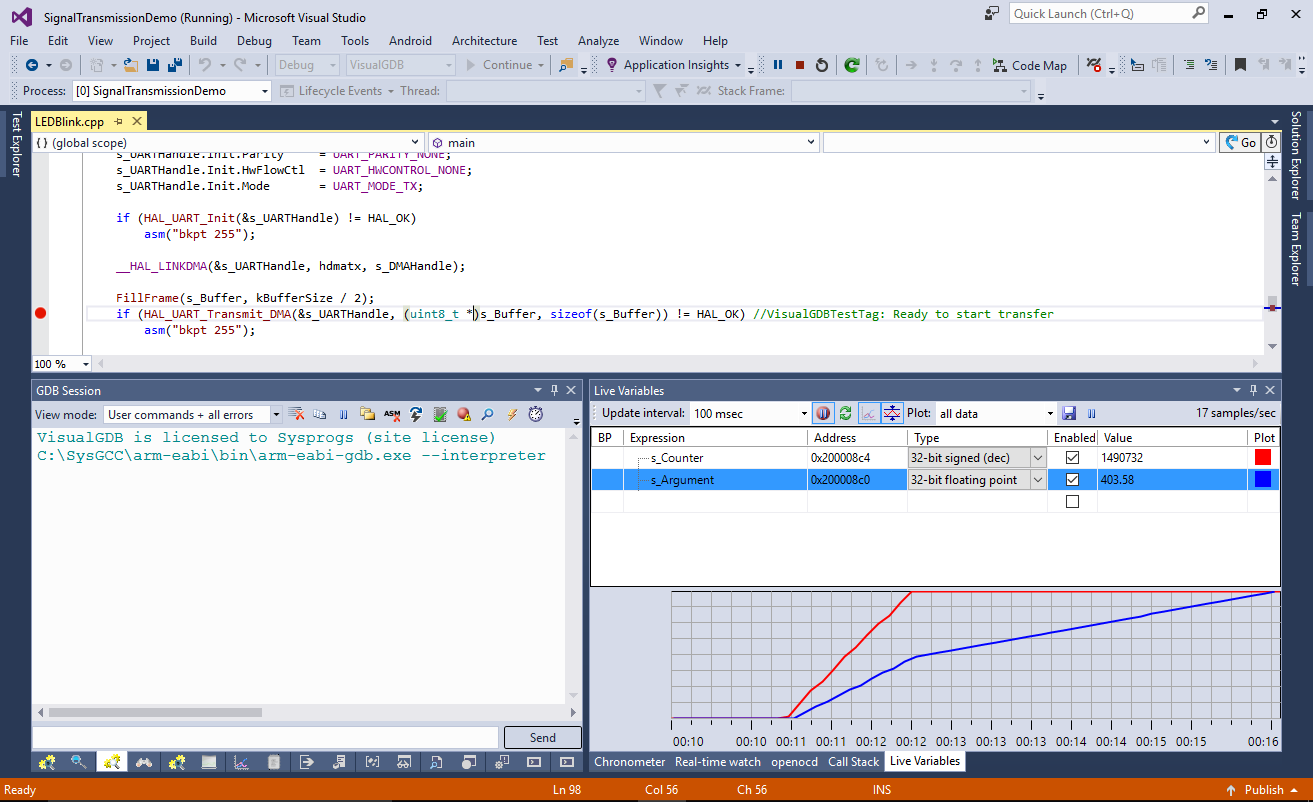 This happens because now FillFrame() takes more time to complete than the interval between half-buffer interrupts, so the main part of the program never gets a chance to run and the generated signal will also be corrupt due to buffer underruns. In this example the problem occurs relatively soon, however if the critical path was not triggered soon after the start, it could be easy to miss a change to the code that triggers the problem.
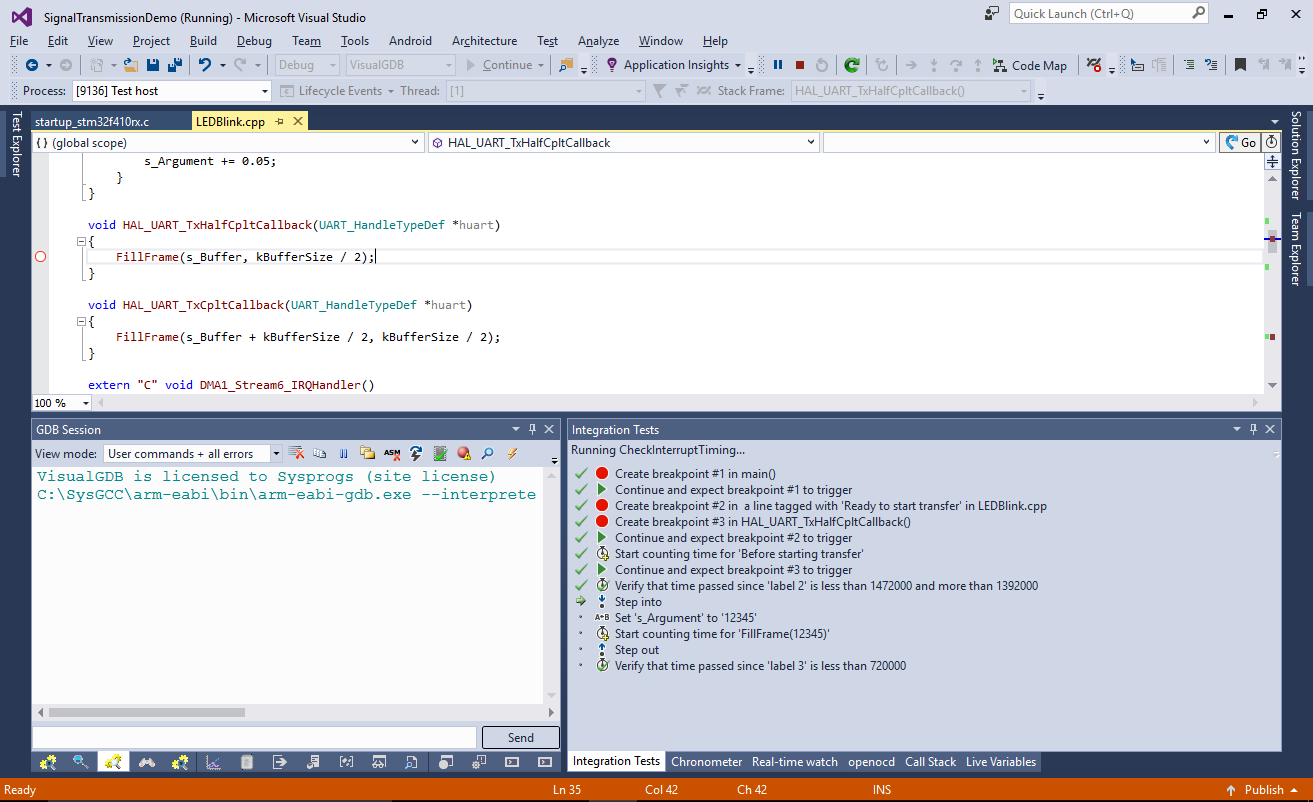
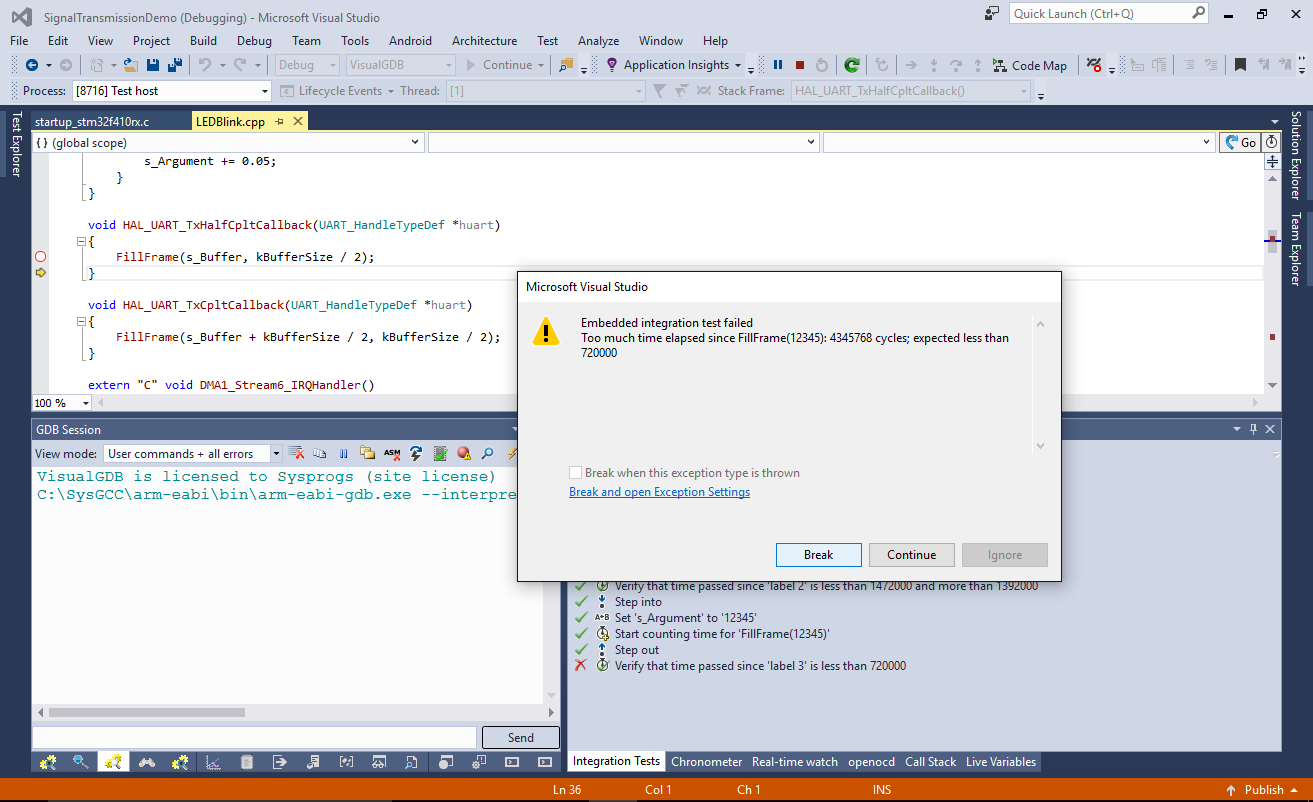
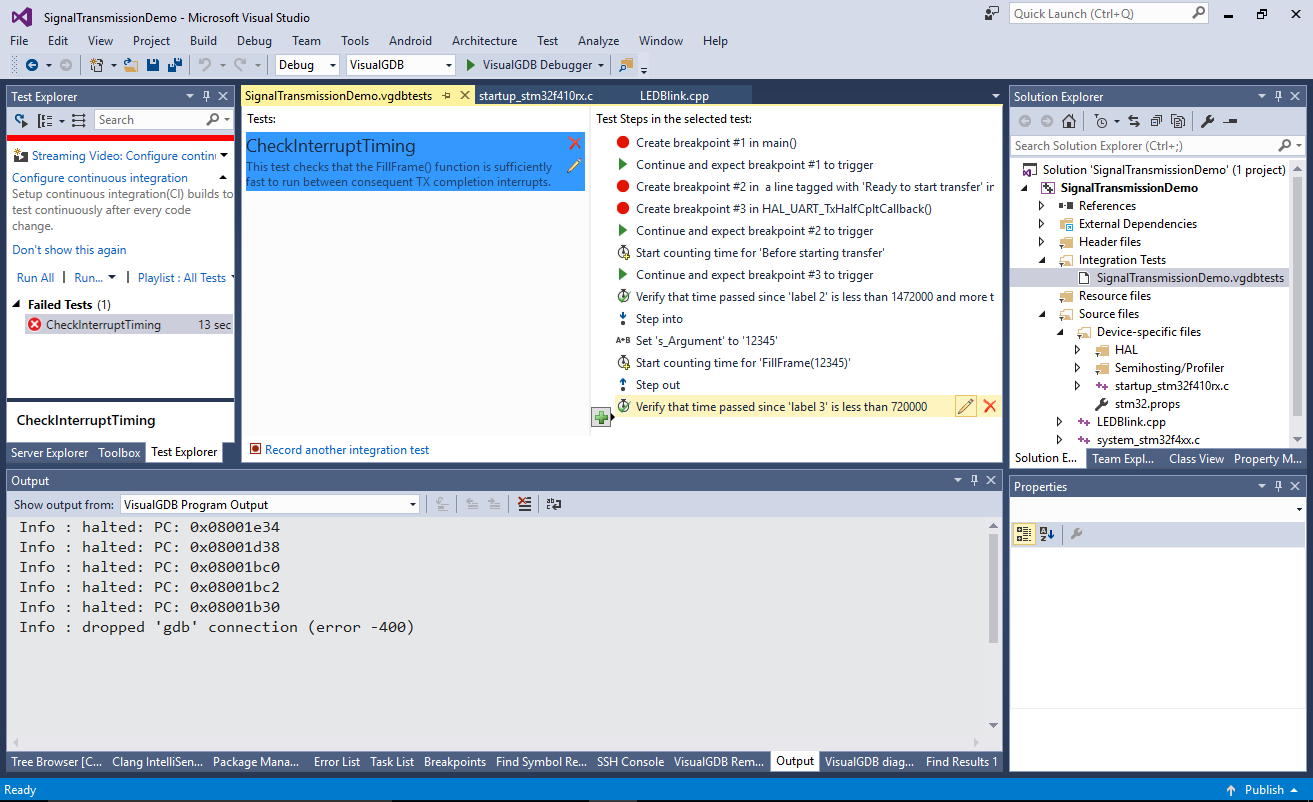
 - Start the CheckInterruptTiming test again. See how it immediately detects that FillFrame() takes longer than expected and raises an exception:
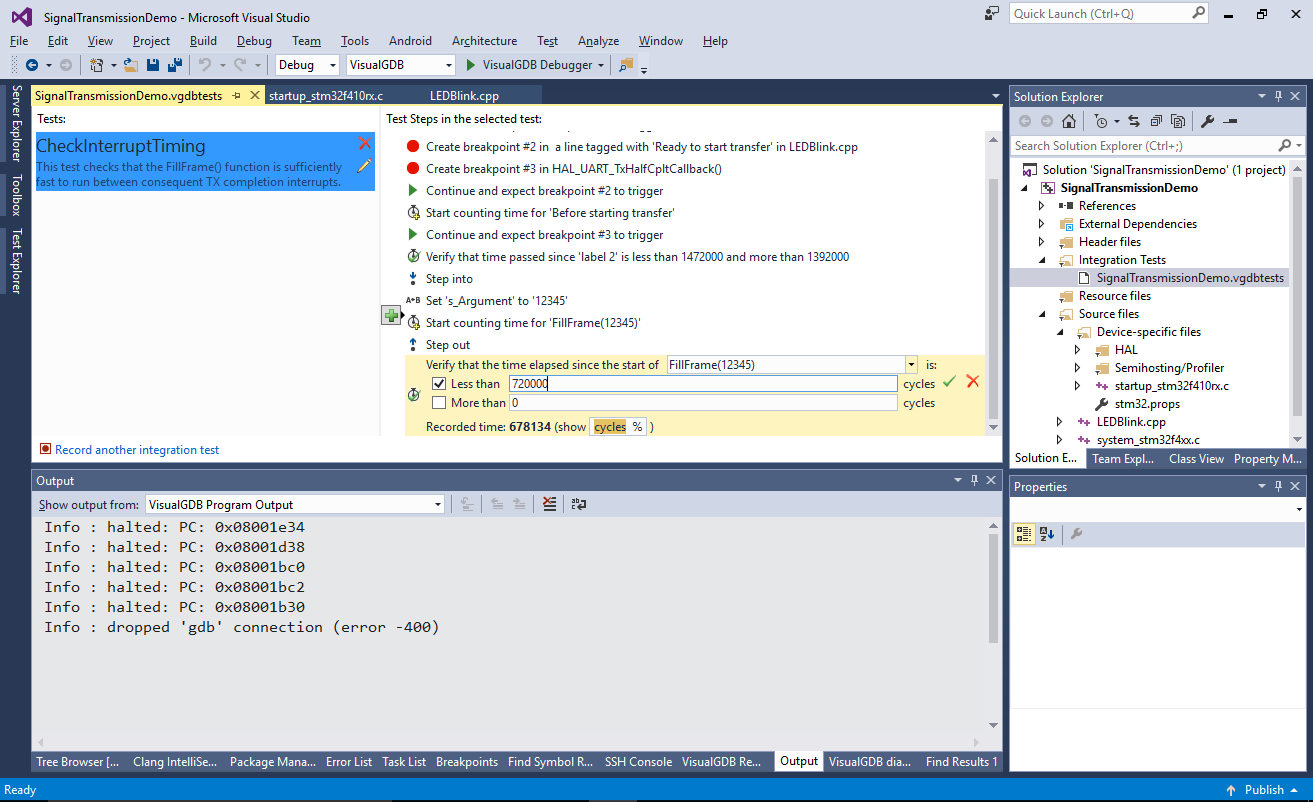
- Embedded integration tests are stored in .vgdbtests files referenced from Solution Explorer. You can always edit them by opening the file in Visual Studio:
- Each test step could be deleted or modified, so if you want to refine the constraints after a minor change to your code, there is no need to re-record the test. Simply edit any of the steps or add new ones via the editor:
 The .vgdbtests files internally use XML, so simply check them in under your source control system to see the changes between different revisions.