Attaching to Embedded Code to Diagnose Delayed Problems
This tutorial shows how to use the “Attach to Running Embedded Firmware” feature of VisualGDB to diagnose rarely occurring problems in your code that don’t get easily triggered. We will create a simple program causing the “division by zero” error with a 1/1000 chance, run it without debugger and one the problem happens, will attach VisualGDB and show how to diagnose it.
Before you begin, install VisualGDB 5.3 or later.
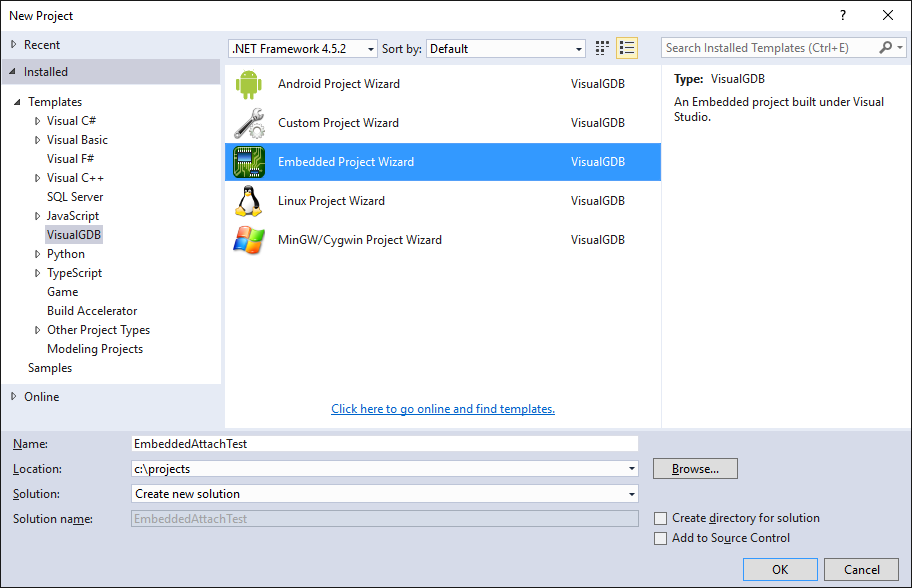
- Start Visual Studio and open VisualGDB Embedded Project Wizard:
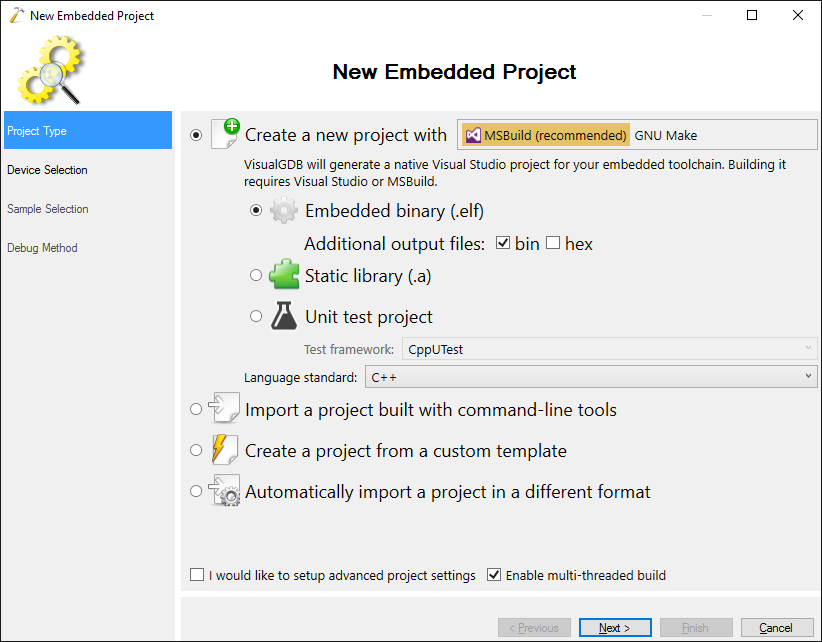
- Proceed with the default selection on the first page:
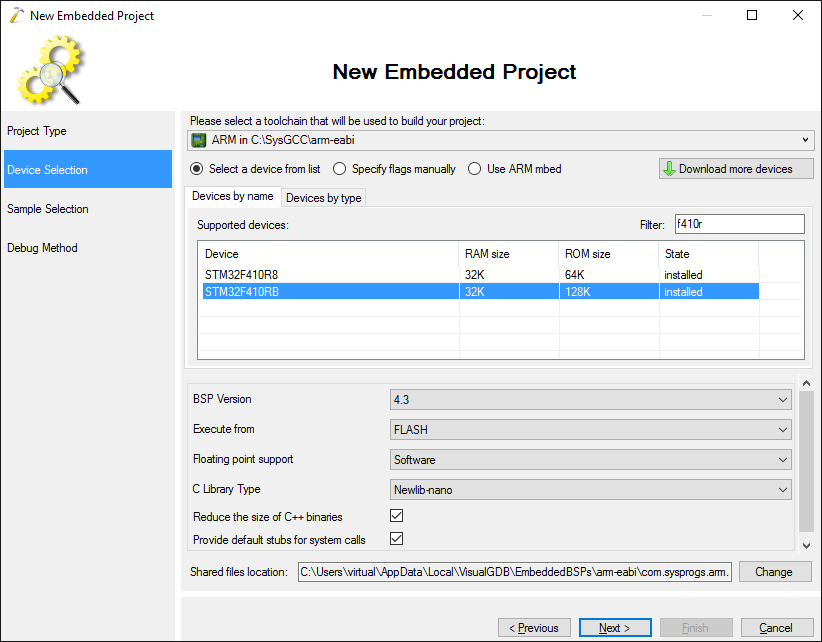
- Select your toolchain and the device. In this tutorial we will use the Nucleo-F410RB board featuring the STM32F410RB device:
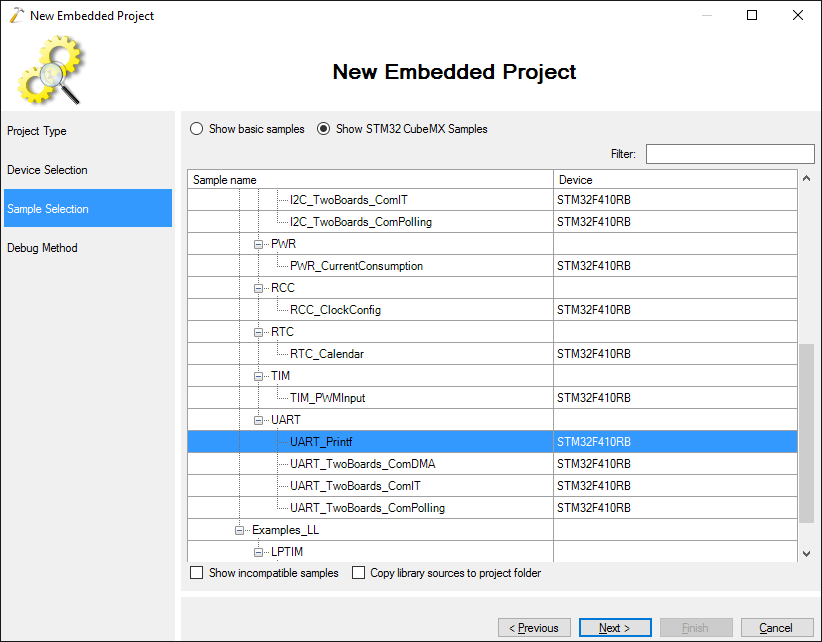
- We will use the UART_Printf example from ST SDK as a starting point for our demonstration. Select “Show STM32CubeMX Samples” and find the UART_Printf example for your board. VisualGDB will automatically filter the examples based on the selected MCU type:
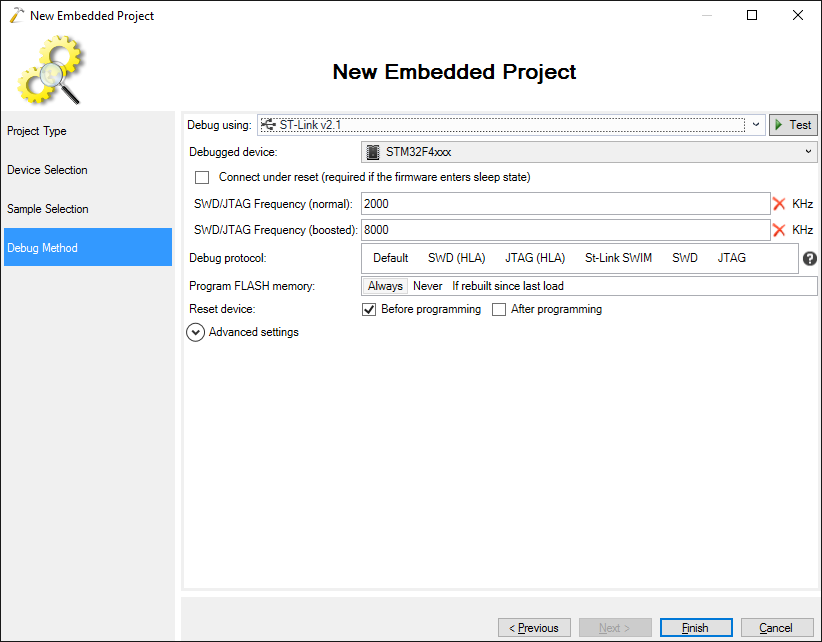
- Connect your board via USB and VisualGDB will automatically recognize it and select the best debug method:
- Press “Finish” to create the project. Now we will modify the sample program to trigger the error. First, disable the UART parity bit:
UartHandle.Init.Parity = UART_PARITY_NONE;
Then replace the main loop in main() with this:
    SCB->CCR |= SCB_CCR_DIV_0_TRP_Msk;
    for (int i = 0;;i++)
    {
        int value = rand();
        int divided = INT32_MAX / (value % 1000);
        printf("%d => %d\r\n", i, divided);
    }
Finally add an implementation of _write() that will direct printf() output to HAL_UART_Transmit():
int _write(int fd, char *pBuffer, int size)
{
    HAL_UART_Transmit(&UartHandle, (uint8_t *)pBuffer, size, 0xFFFF);
    return size;
}
Note that if it is defined in a C++ file (not Plain C), it would need to be declared with extern “C” so that the linker can use it to replace the default implementation.
Finally build the project: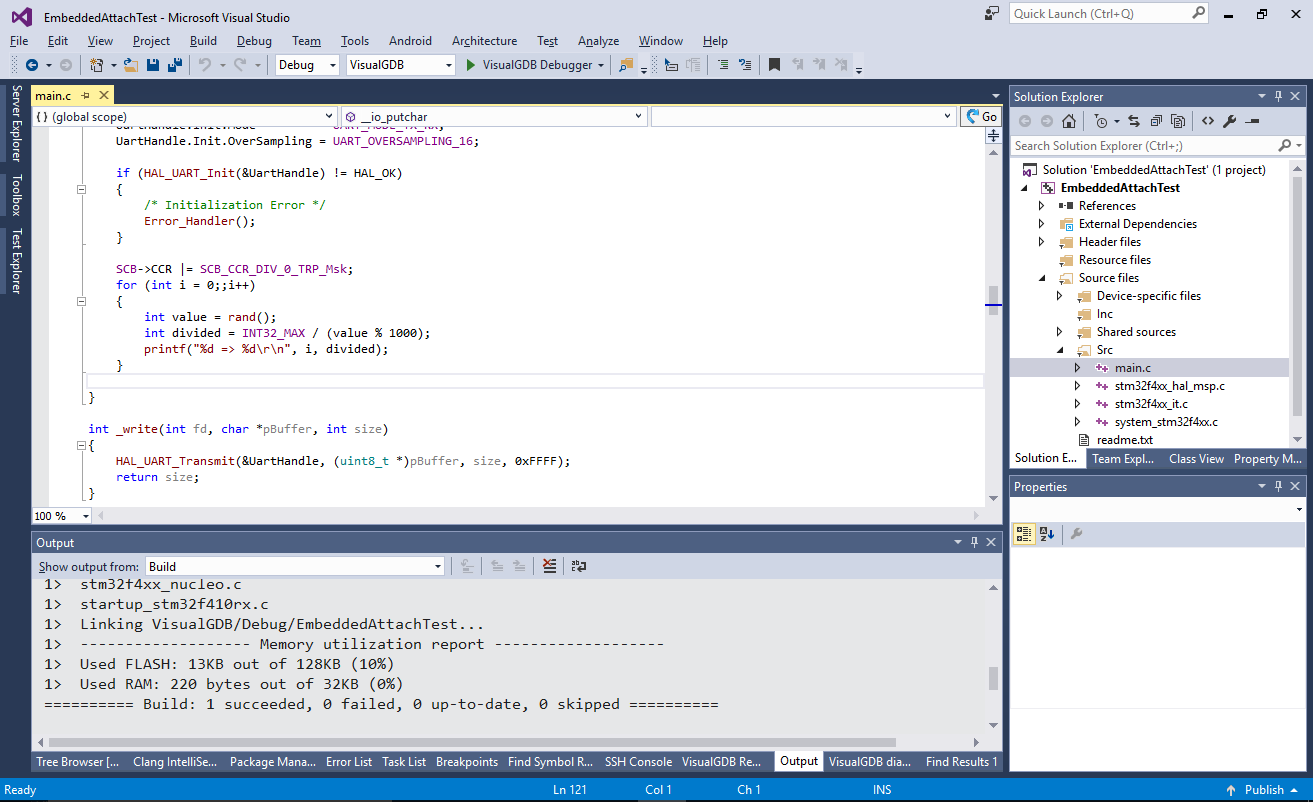
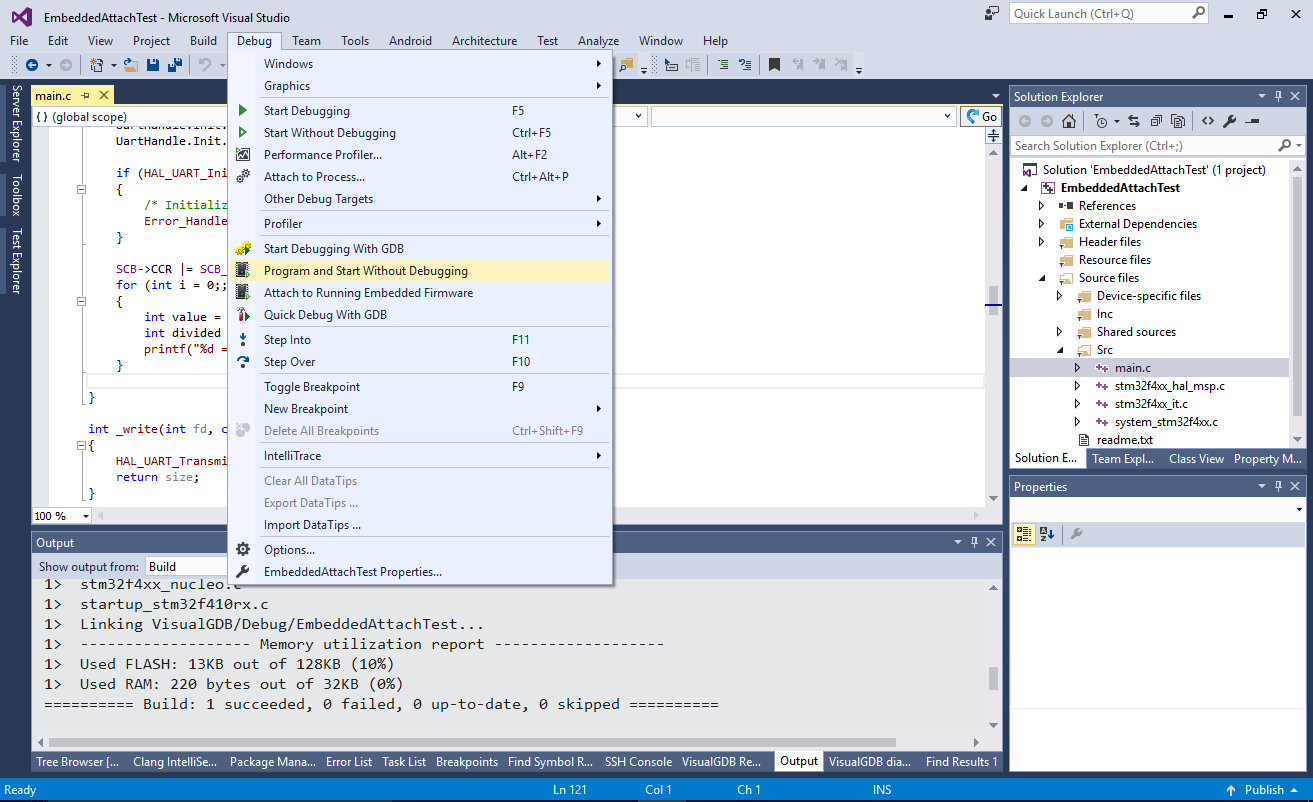
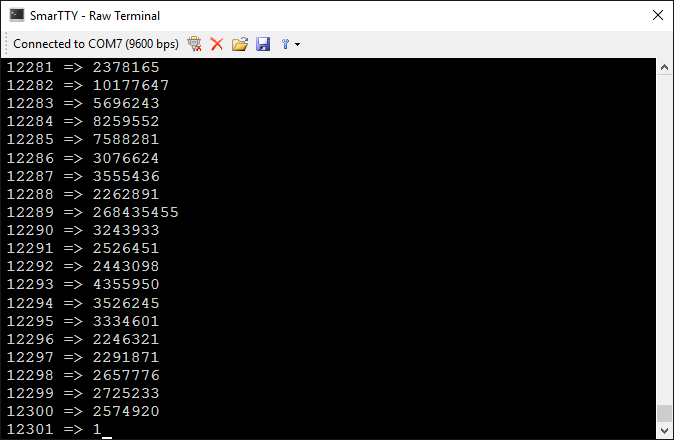
- Connect a terminal program (e.g. SmarTTY) to the ST-Link COM port and select Debug->Program and Start Without Debugging in Visual Studio:
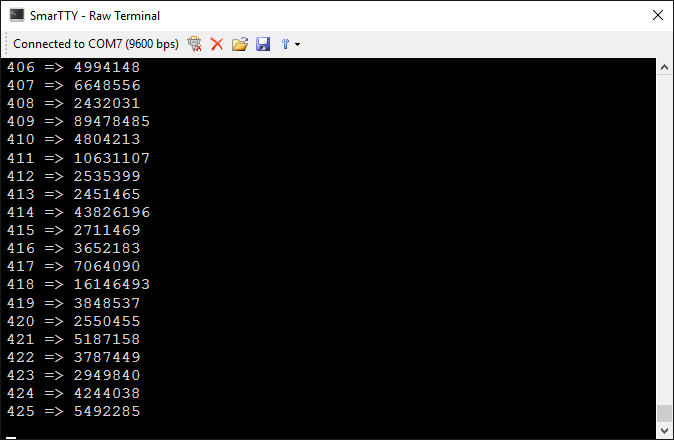
- Look in the terminal. It will show several lines of output and will eventually hang:
 You can try unplugging/re-plugging the board to the USB or resetting the microcontroller to ensure the problem is always reproduced. As long as the MCU is running the same build of the firmware that the project contains, the steps described below will work.
 - Now we will attach to the hanging microcontroller and diagnose its state. Select Debug->Attach to Running Embedded Firmware:

- VisualGDB will attach to it and show that it’s stuck in HardFault_Handler():
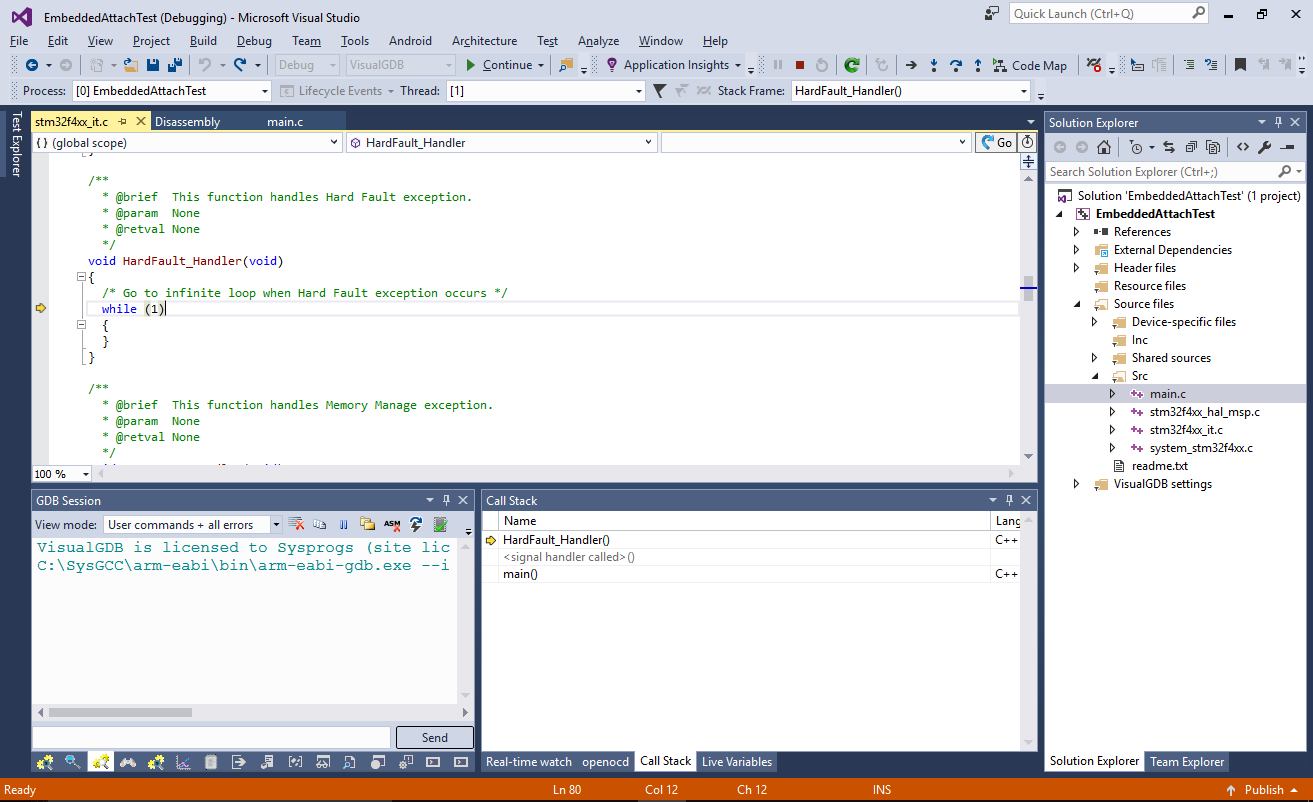 The “Attach to Running Embedded Firmware” command is supported for ARM, ESP8266 and ESP32 devices and it automatically suppresses FLASH reprogramming and device resetting so that you can see the exact state of the processor the moment you attached to it.
 - Hard fault could be triggered by several different causes, so you can use the CFSR register in Hardware Registers to see what exactly caused it. In this example the DIVBYZERO field indicates that the error was triggered by attempting to divide by zero:
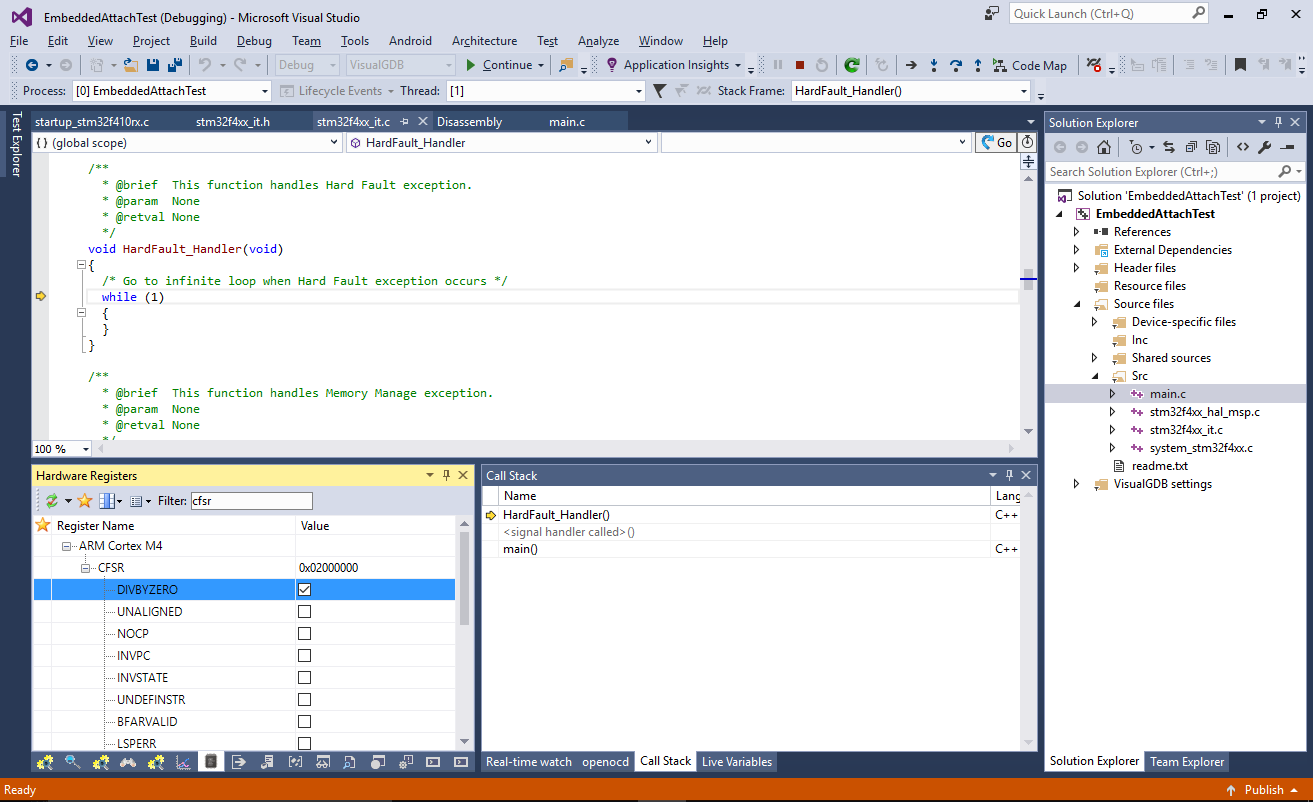 Note that normally it would not cause an exception. We had to explicitly enable the exception in the code by setting DIV_0_TRP in SCB_CCR.
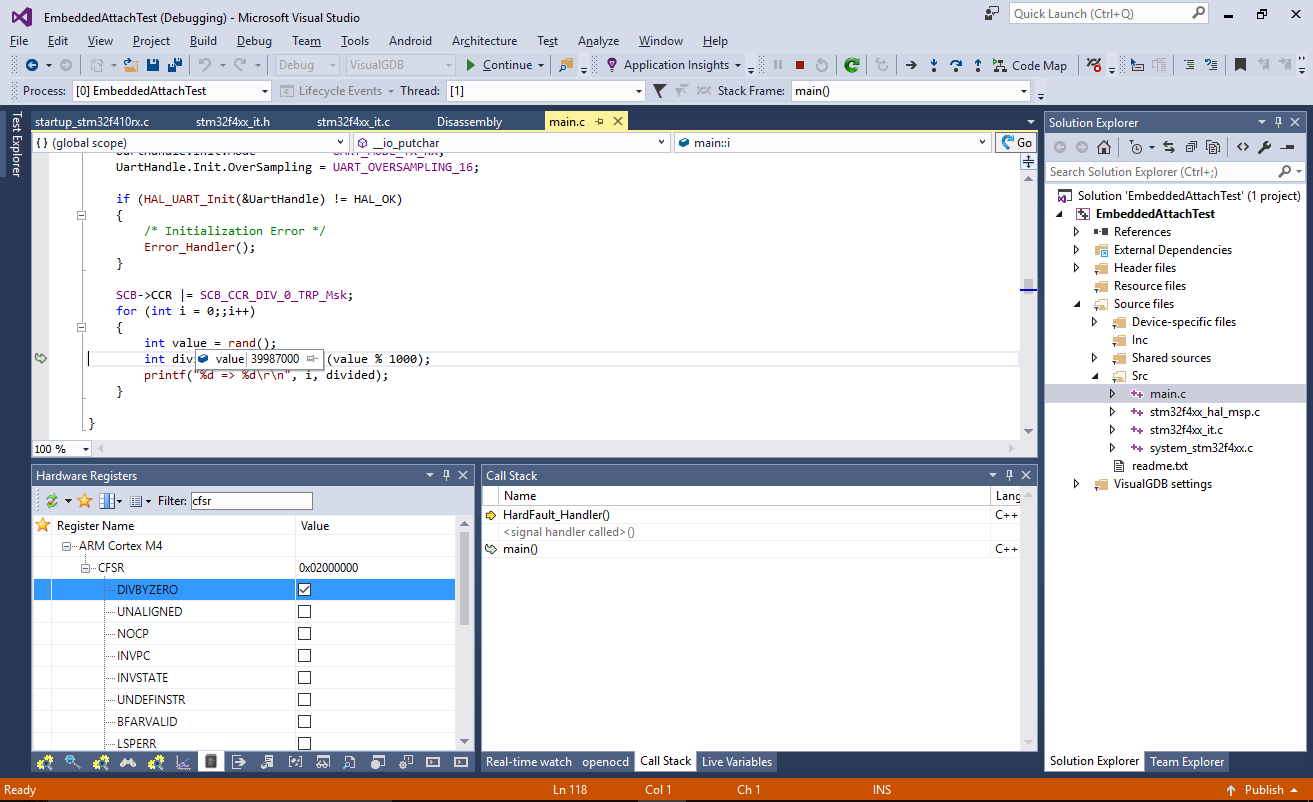
 - Click in the “main()” entry in Call Stack to go to the location of the error. Hover the mouse over ‘value’ to see the value that triggered the error:
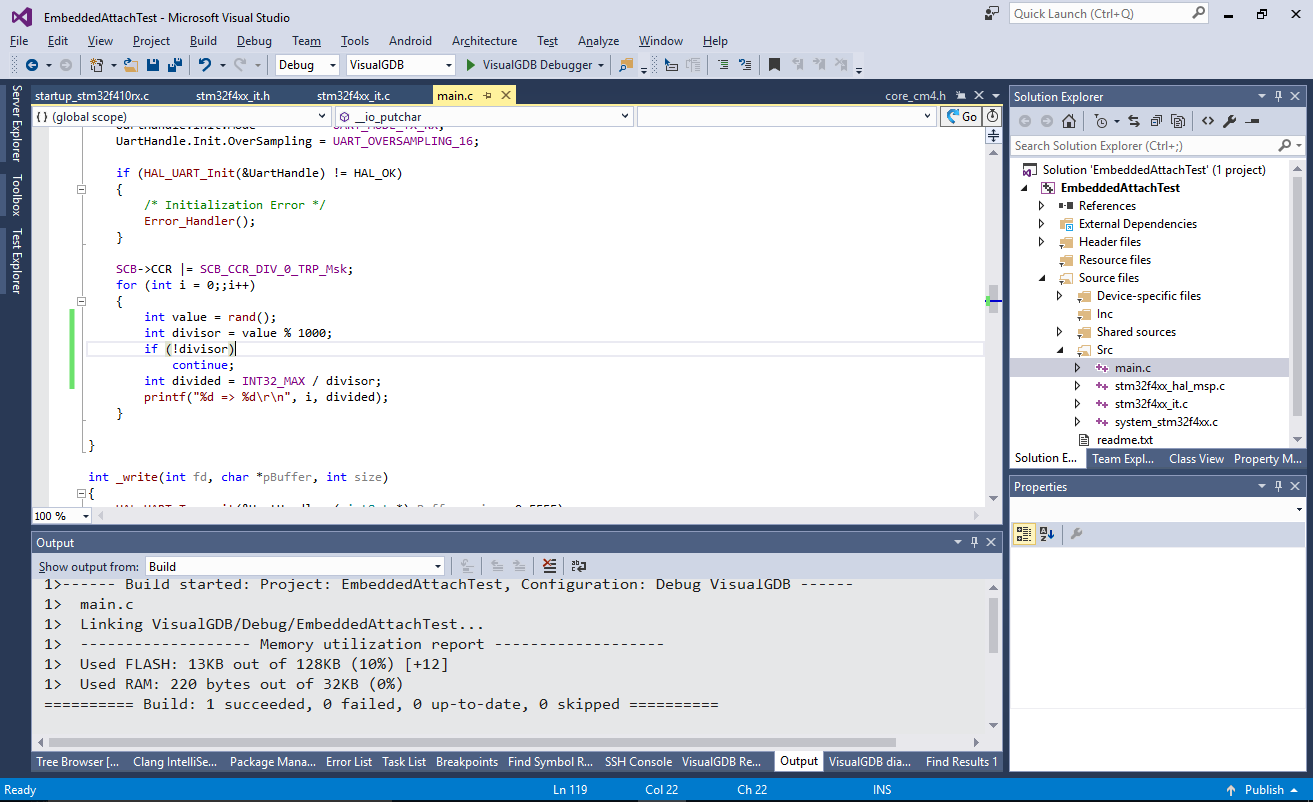
- Press Shift-F5 to stop debugging and rewrite the code to fix the problem:
        int value = rand();
        int divisor = value % 1000;
        if (!divisor)
            continue;
        int divided = INT32_MAX / divisor;
Build the program again, but don’t program it:
- Attach to the running firmware again without reprogramming it. See how now VisualGDB displays that the program is stopped in NMI_Handler() that should normally just immediately return:
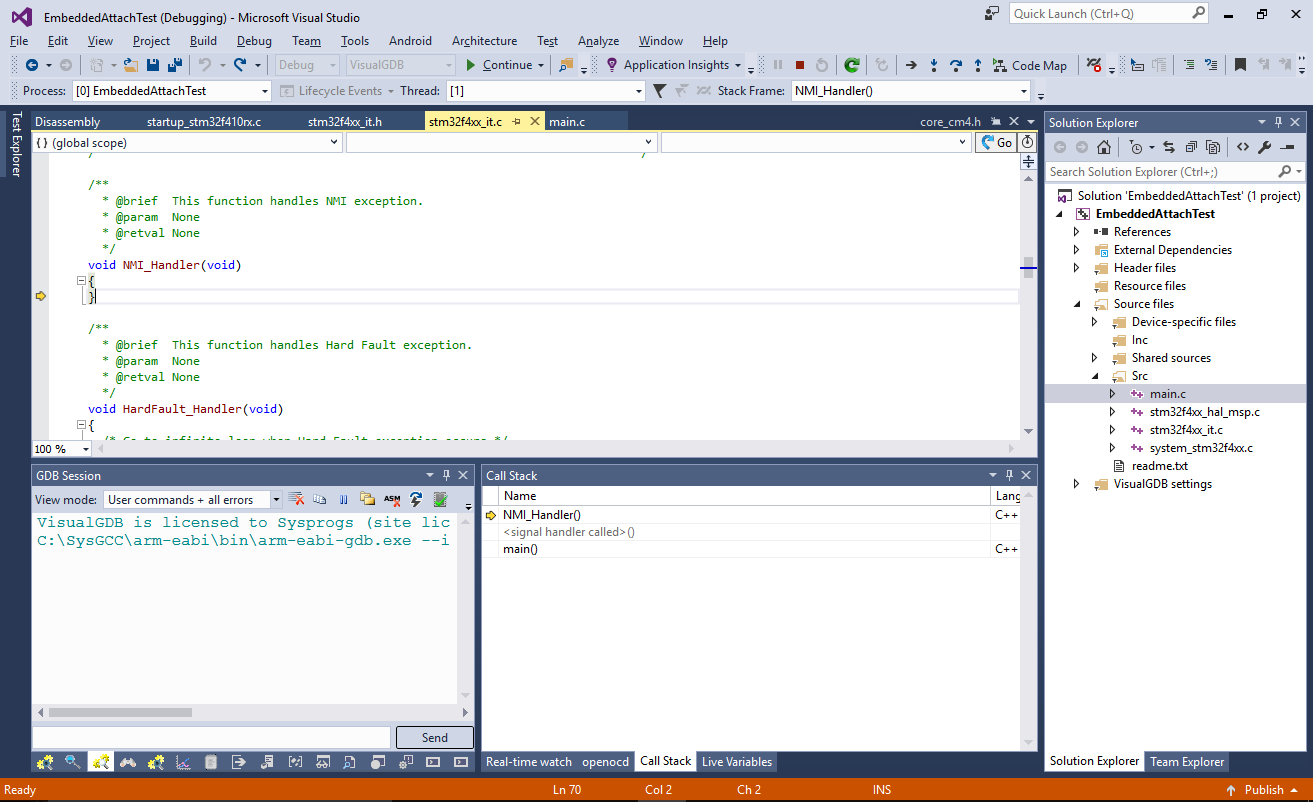 This happens because the debugger is using the new build of the program to interpret the contents of the device memory that has the old build. As we have added extra checking code in main(), its size got increased and several other functions got shifted, so the old address of HardFault_Handler() matches the new address of NMI_Handler().
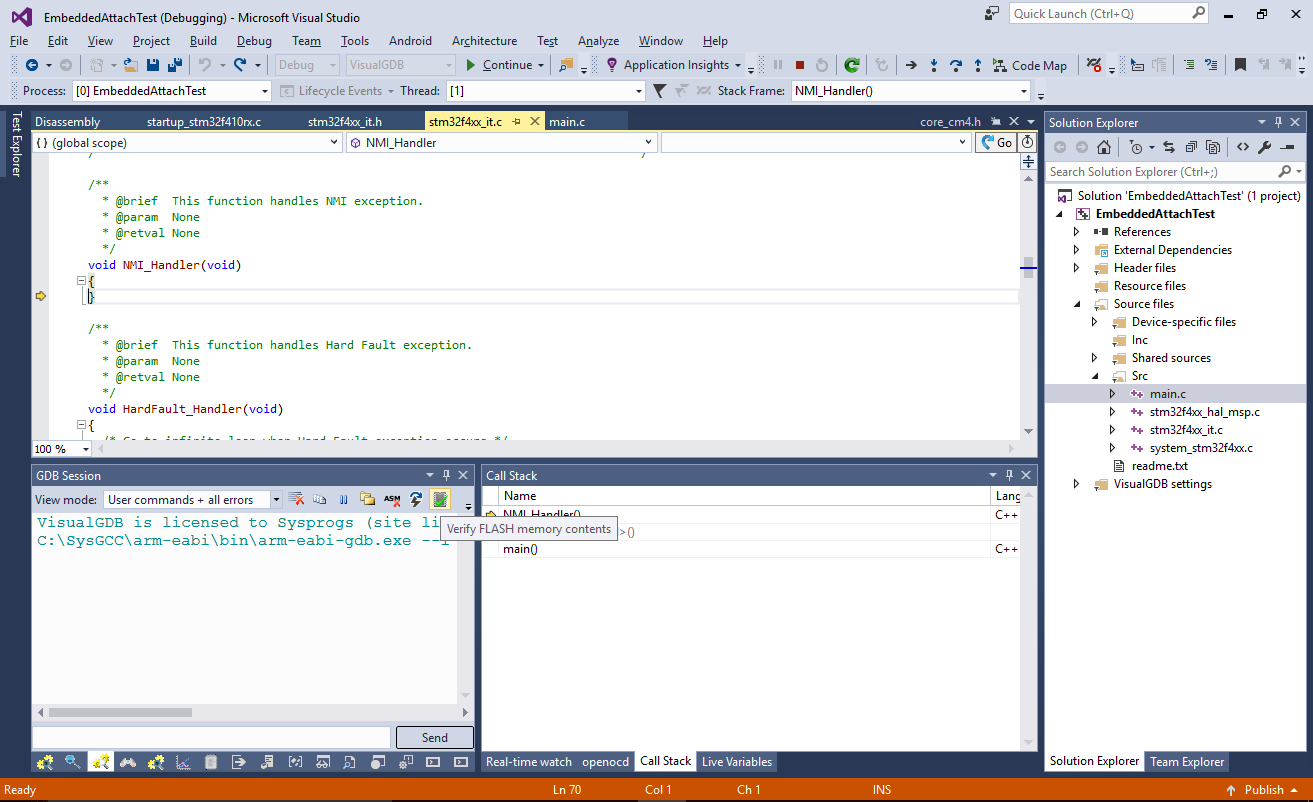
 - VisualGDB provides a convenient way to diagnose this type of errors. Click “Verify FLASH memory contents”:
- VisualGDB will read the FLASH memory on the device, compare it with the current build and will display a detailed list of differences if there are any:
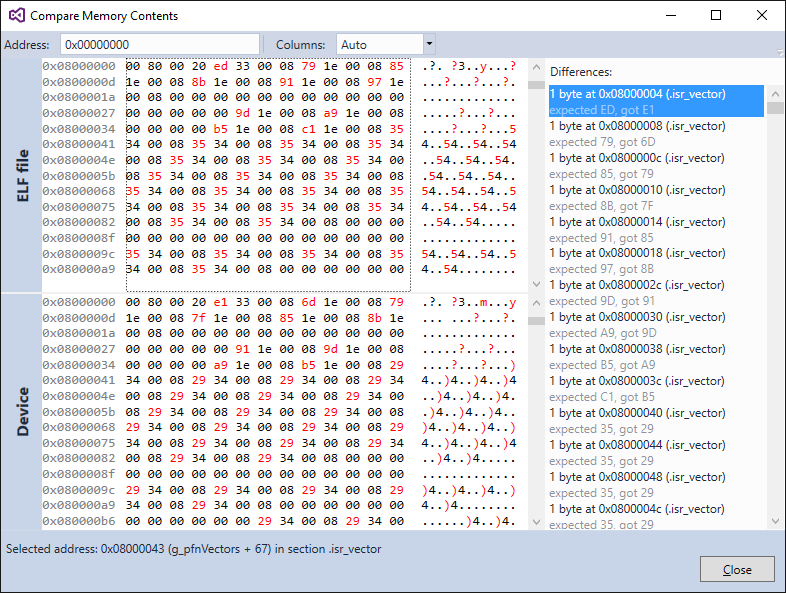 The pattern of differences could explain the reason behind the mismatch. E.g. having the FLASH memory filled with 0xFFs would mean that the memory was erased, but not programmed; having zero bits in place of one bits (as if contents of the FLASH was bitwise ANDed with something else) would indicate that FLASH erase was not performed; multiple random differences all across the code typically mean that a wrong version was programmed.
 - Simply re-program the new firmware to the device to ensure the FLASH memory is updated and it will run without any exceptions:
- Starting from VisualGDB 5.5, you can distinguish between starting a new embedded debug session and attaching to running firmware via the $(DebugMode) variable. VisualGDB will set it to “Attach” when attaching and to “NewInstance” otherwise. You can use it to run different sets of startup commands, depending on the way the debug session is started. E.g. you can add the following line to VisualGDB Project Properties -> Additional GDB Commands:
source $(ProjectDir.forwardslashes)/Startup-$(DebugMode).gdb
It will run commands from Startup-NewInstance.gdb file when starting a regular debug session, and commands from Startup-Attach.gdb otherwise.