Using Chronometer to Quickly Analyze your Program Timing
This tutorial shows how to use the VisualGDB Chronometer to quickly analyze the time elapsed between different events without involving heavy code instrumentation. Before you begin, install VisualGDB 5.3 or later and make sure you are using the Custom edition or higher.
We will show how to quickly compare the performance of the sinf() function with the software floating-point mode vs hardware floating-point mode.
- Start Visual Studio and open the VisualGDB Embedded Project Wizard:
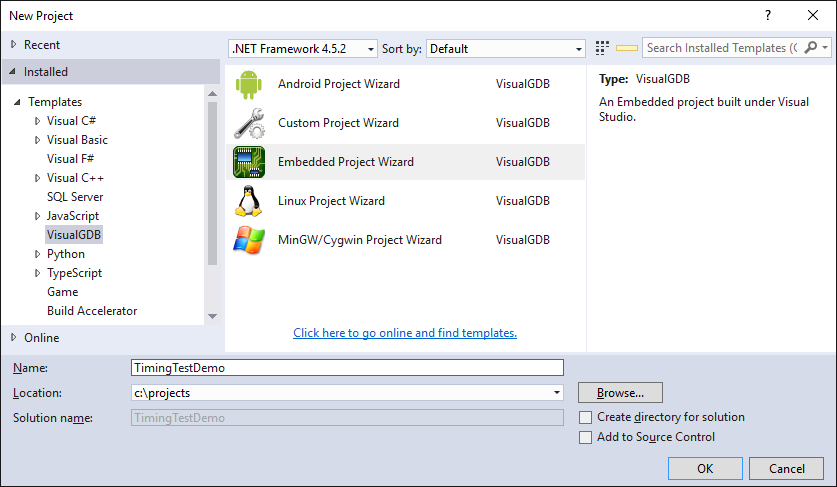
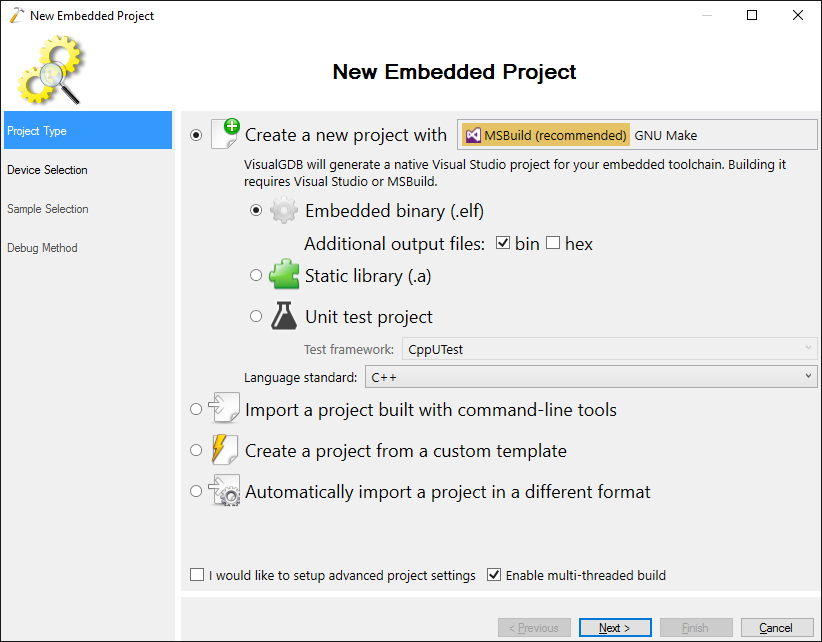
- Select “Create a new project with MSBuild -> Embedded binary”:
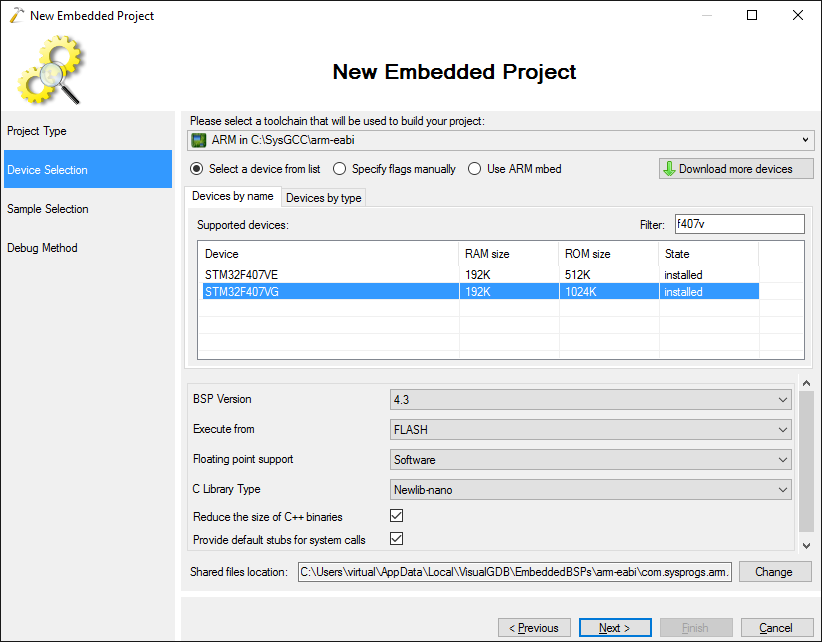
- Select the ARM toolchain and your device. In this tutorial we will use the STM32F4Discovery board with the STM32F407VG microcontroller:
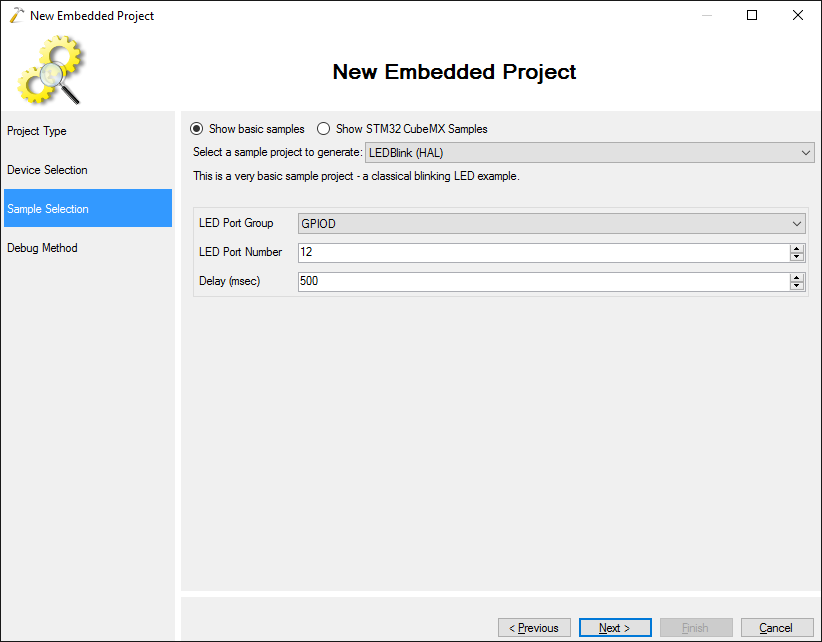
- Proceed with the default “LEDBlink (HAL)” sample:
- Connect your board to the computer via USB. VisualGDB will automatically detect your ST-Link type and configure OpenOCD to use it:
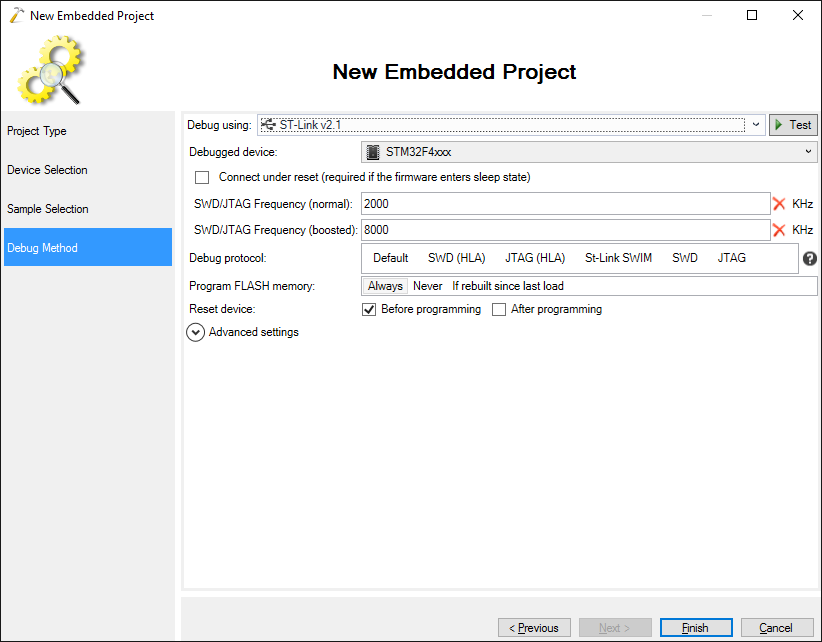
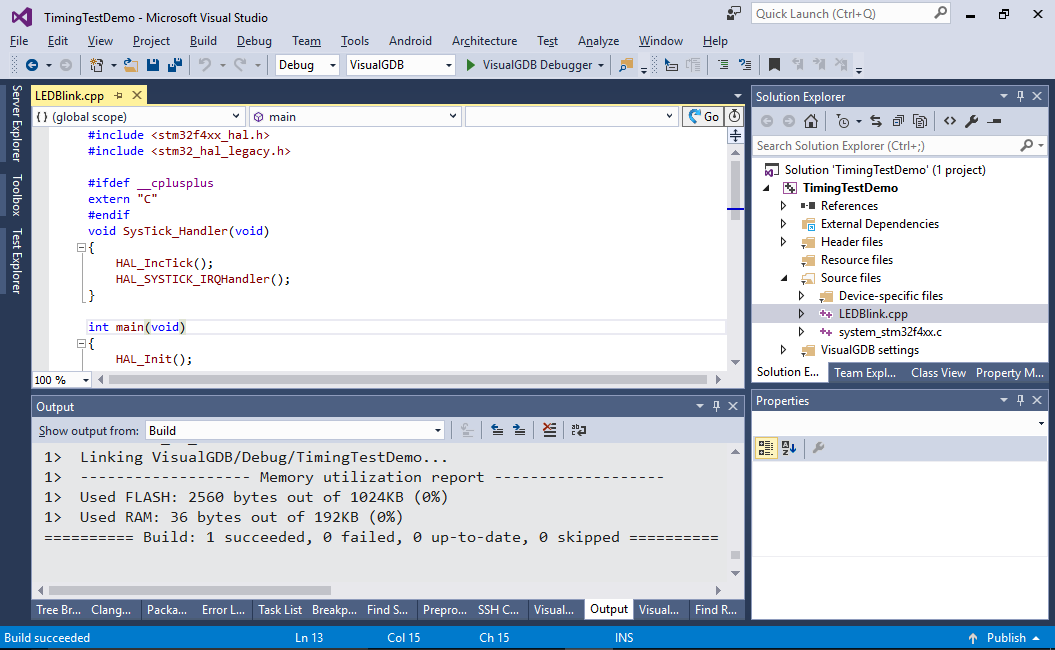
- Press “Finish” to create the project. Build it by pressing Ctrl-Shift-B:
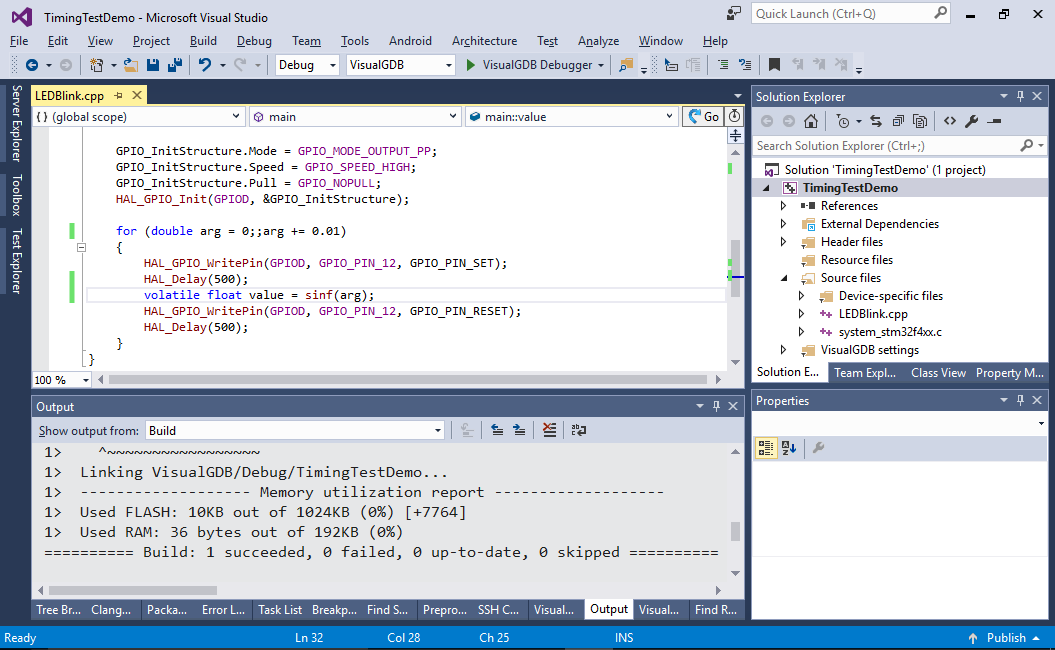
- Replace the main loop in the main() function with this:
    for (float arg = 0;;arg += 0.01)
    {
        HAL_GPIO_WritePin(GPIOD, GPIO_PIN_12, GPIO_PIN_SET);
        volatile float value = sinf(arg);
        HAL_GPIO_WritePin(GPIOD, GPIO_PIN_12, GPIO_PIN_RESET);
        HAL_Delay(500);
    }
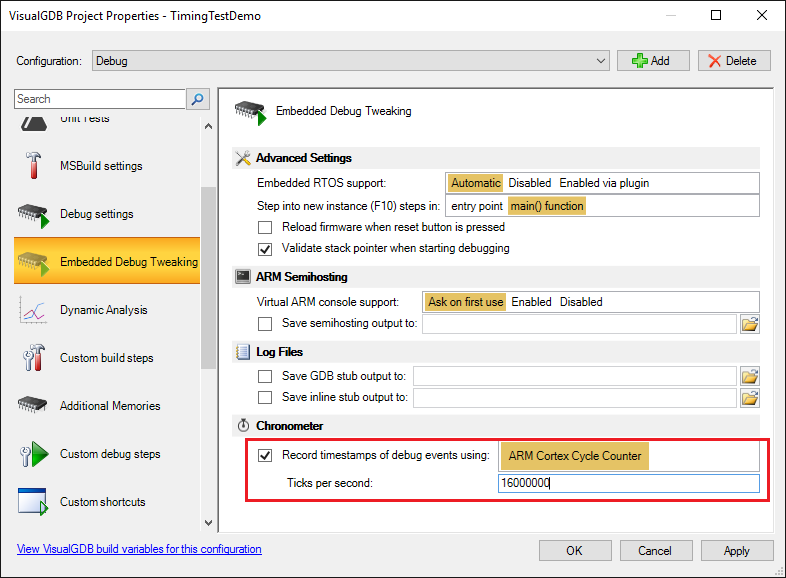
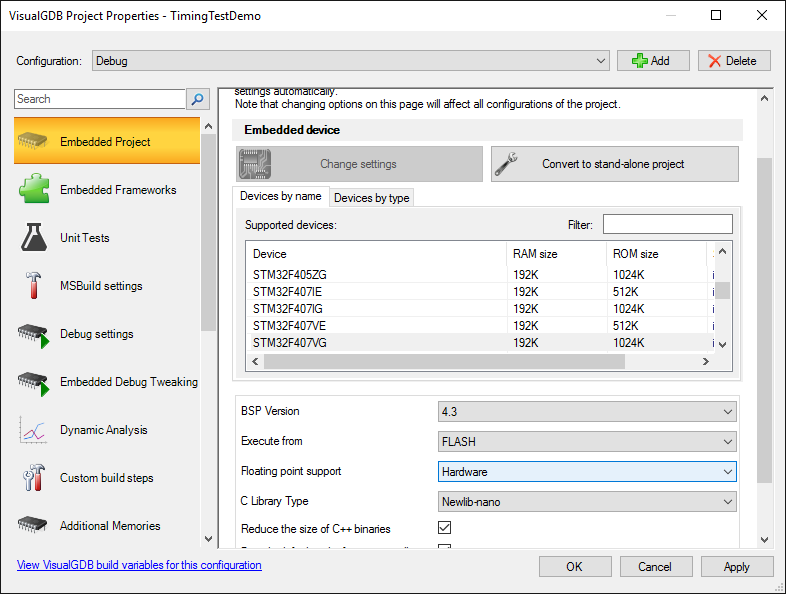
- We will now use the chronometer to count the amount of cycles used by the call to the sinf() function. Open VisualGDB Project Properties and enable the chronometer. Optionally enter the amount of CPU clock ticks per second so that VisualGDB can display the actual times instead of clock cycle counts:
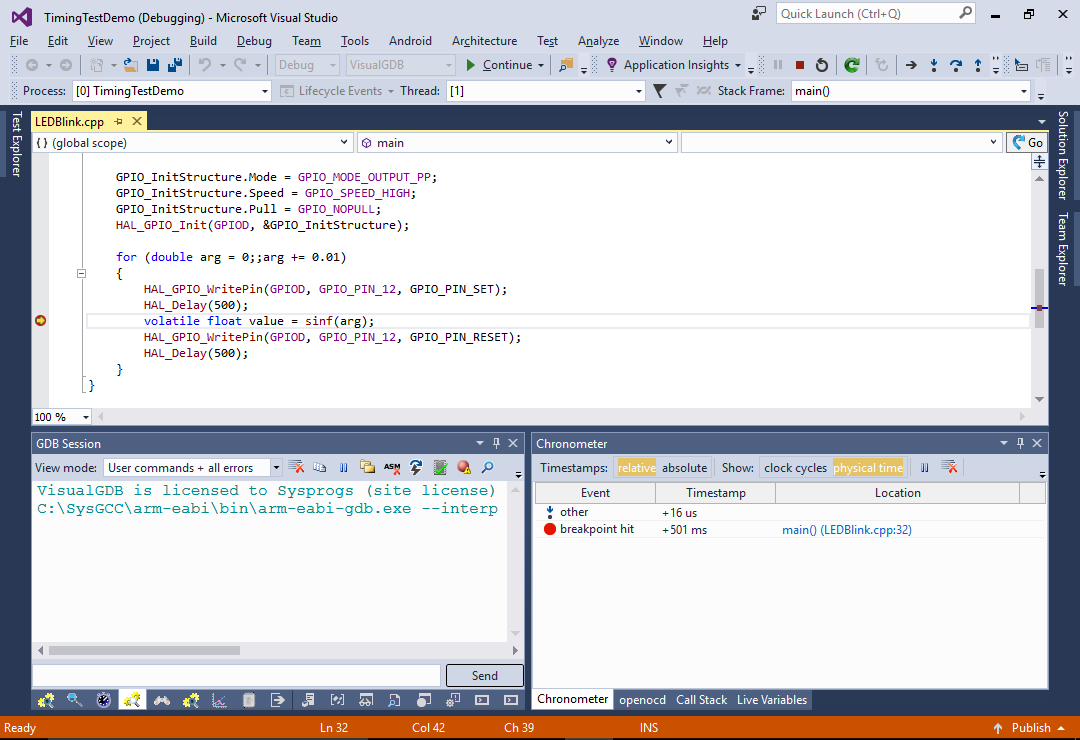
- Set a breakpoint on the line calling sinf() and let it hit:
- Step over the current line by pressing F10. Then press F5 to run another iteration of the loop and step over sinf() again:
 Observe the Chronometer window (you can always open it via Debug->Tool Windows if you closed it before). It will show the time elapsed between each debugger event. See how the first call to sinf() with the argument value of 0 took ~4 microseconds, while the second call with the value of 0.01 took ~43 microseconds. This happens due to internal optimizations in the sinf() function. Also note how the breakpoint got hit the second time 501 milliseconds after resuming execution (that corresponds to HAL_Delay()).
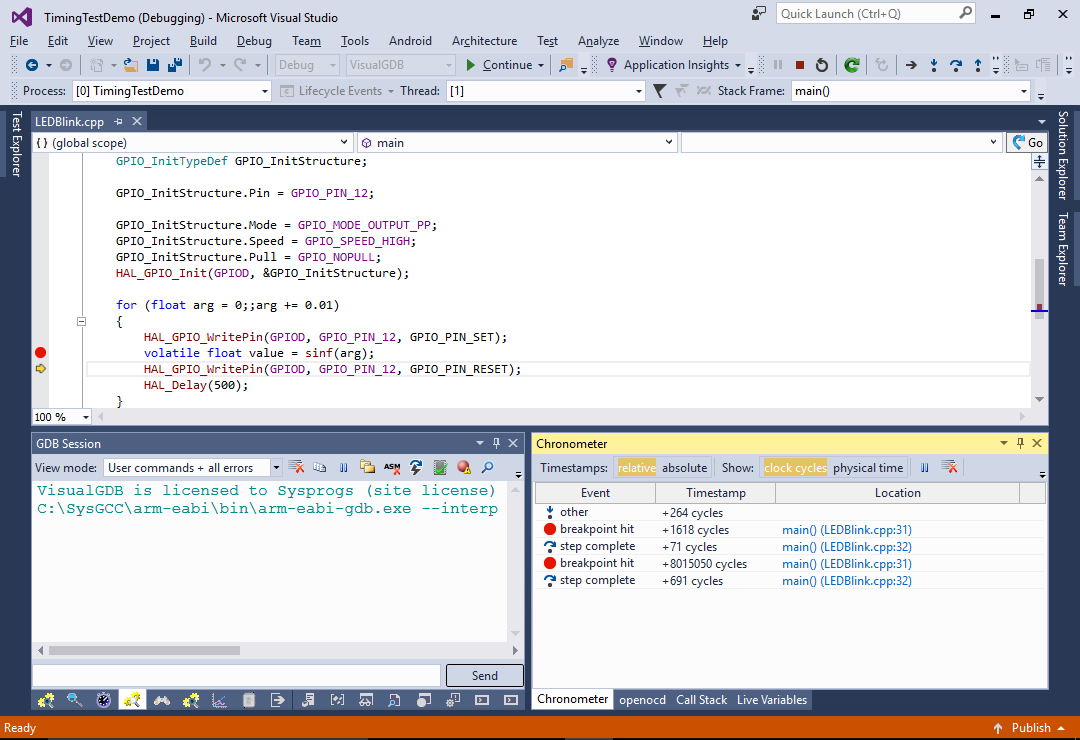
 - You can switch the view mode from physical time to clock cycles to see the exact clock cycles elapsed between different events.
- Open VisualGDB Project Properties and switch the floating point support to Hardware:
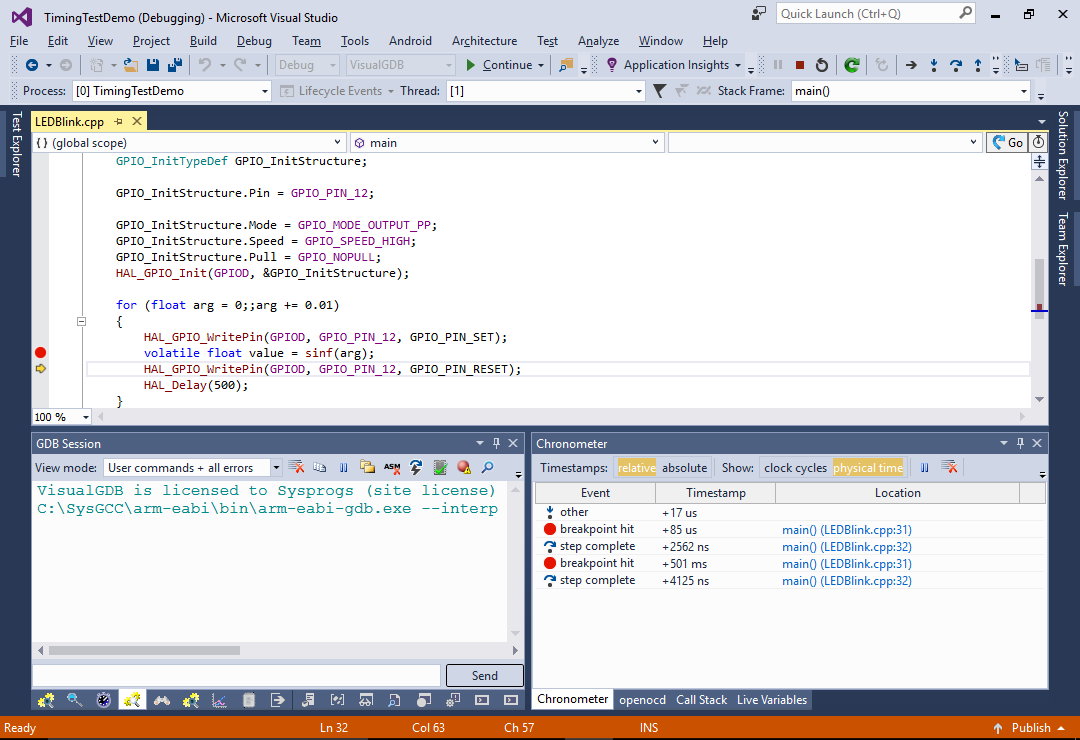
- Repeat the steps used to measure the sinf() performance. See how switching to hardware floating point mode makes the second call to sinf() more than 10 times faster:
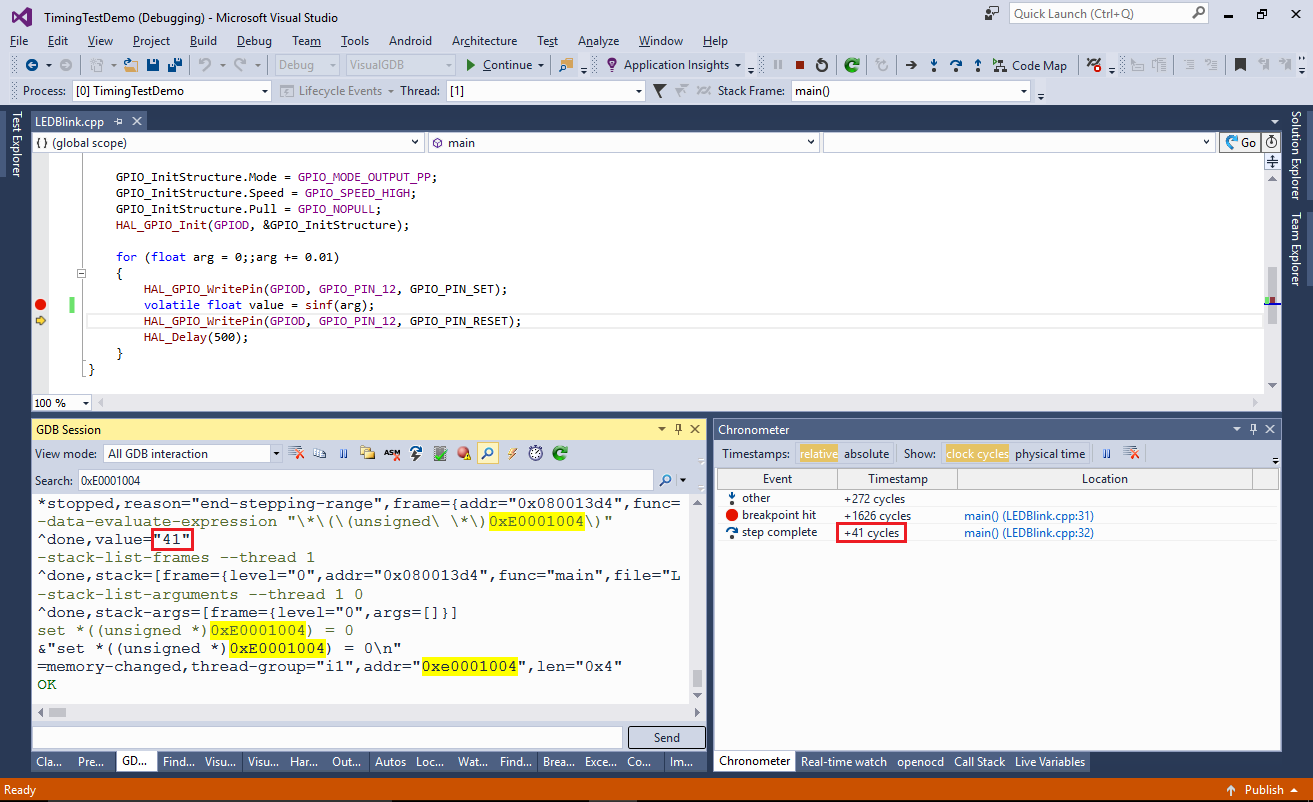
- The chronometer works by reading the ARM Cortex instruction counter register (DWT_CYCCNT) each time the debug session is stopped. You can see this by searching for 0xE0001004 (address of the register) in the GDB Session window:
 VisualGDB also automatically resets the register to 0 at each debug stop to avoid overflows. This eliminates the need to instrument the code and hence does not cause any overhead, although it can only be used to see the time between events that caused the debugger to stop (such as breakpoints).
 - The low-level chronometer behavior can be modified by copying the “C:\Program Files (x86)\Sysprogs\VisualGDB\TimestampProviders\DWT.xml” file and replacing the commands:
<?xml version="1.0"?>
<EmbeddedTimestampProvider xmlns:xsi="http://www.w3.org/2001/XMLSchema-instance" xmlns:xsd="http://www.w3.org/2001/XMLSchema">
    <Name>ARM Cortex Cycle Counter</Name>
    <ID>com.sysprogs.arm.dwt</ID>
    <InitializationCommands>
        <string>set *((unsigned *)0xe000edfc) = *((unsigned *)0xe000edfc) | 0x01000000</string>
        <string>set *((unsigned *)0xE0001000) = 1</string>
        <string>set *((unsigned *)0xE0001004) = 0</string>
    </InitializationCommands>
    <TickCountExpression>*((unsigned *)0xE0001004)</TickCountExpression>
    <TickCountResetCondition>1</TickCountResetCondition>
    <TickCountResetCommands>
        <string>set *((unsigned *)0xE0001004) = 0</string>
    </TickCountResetCommands>
</EmbeddedTimestampProvider>
If your device uses a different core or does not support the DWT_CYCCNT instruction counter, you can define your own timestamp provider and select it in VisualGDB Project Properties. We will show a detailed example of that in one of the next tutorials.
If you want a more real-world example of using Chronometer, see our tutorial on analyzing the STM32 memory performance.