Profiling RTX-based Projects with the Instrumenting Profiler
This tutorial shows how to profile the RTX-based projects built with the Keil compiler using the VisualGDB’s instrumenting profiler. Before you begin, install VisualGDB 5.4 Preview 10 or later and create a basic RTX-based project by following this tutorial.
The instrumenting profiler works by patching some, or all of the functions in your program so that they report their run times to VisualGDB. This provides more accurate and detailed results compared to the sampling profiler, but also results in higher run-time overhead, as the run time of each instrumented function needs to be measured separately.
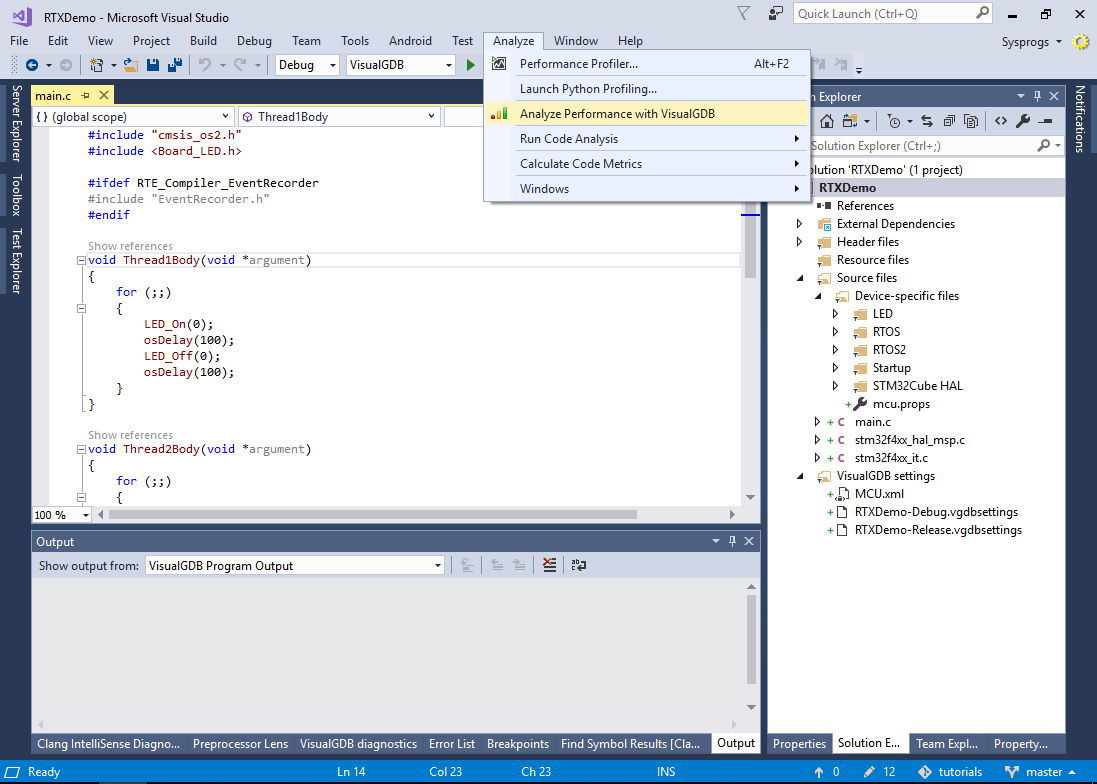
- Open the project in Visual Studio and select Analyze->Analyze Performance with VisualGDB:
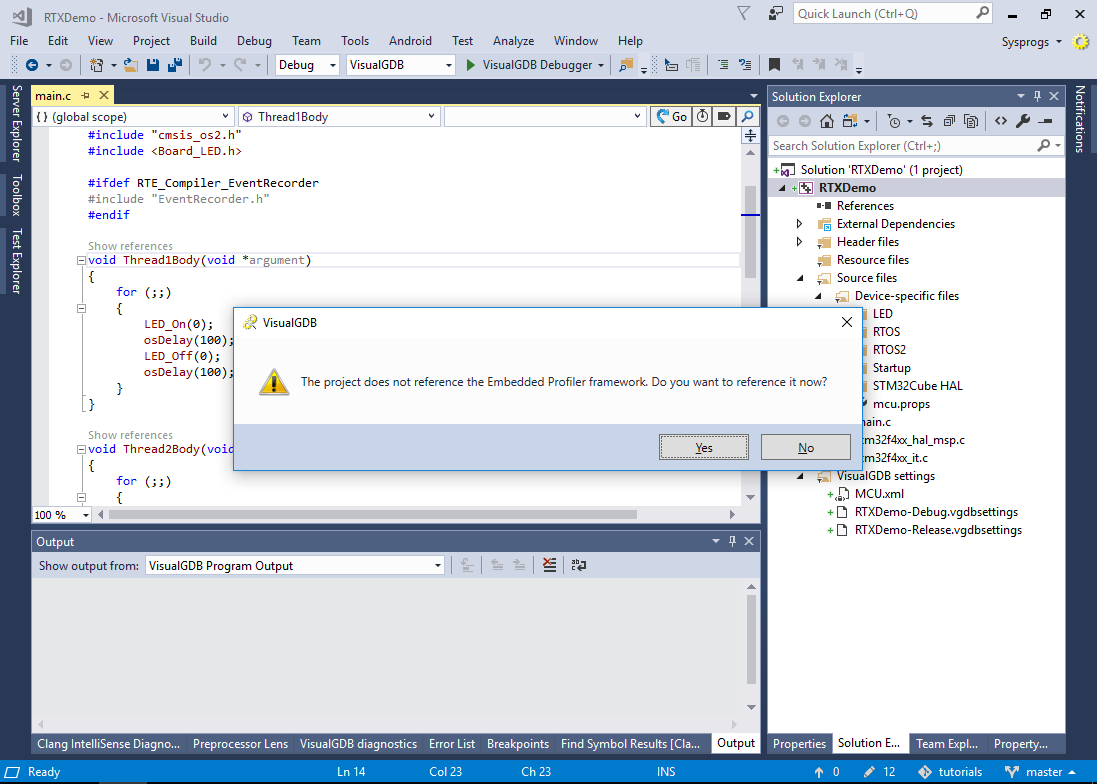
- If you have not profiled this project before, VisualGDB will suggest automatically referencing the Embedded Profiler framework. Proceed by pressing “Yes”:
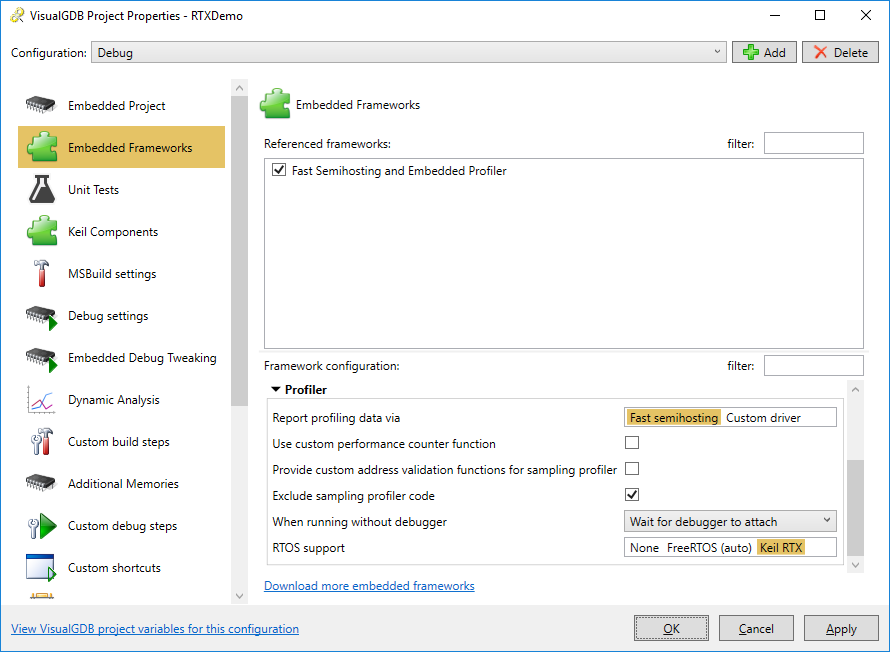
- Open VisualGDB Project Properties and go to the Embedded Frameworks page. As configuring the sampling profiler requires extra steps, we will disable it in this tutorial by checking “Exclude sampling profiler code”. Also set RTOS support to “Keil RTX”:
- Open the main file of your project, include the <SysprogsProfiler.h> file and call InitializeInstrumentingProfiler() from the main() function after you configure the system clock:
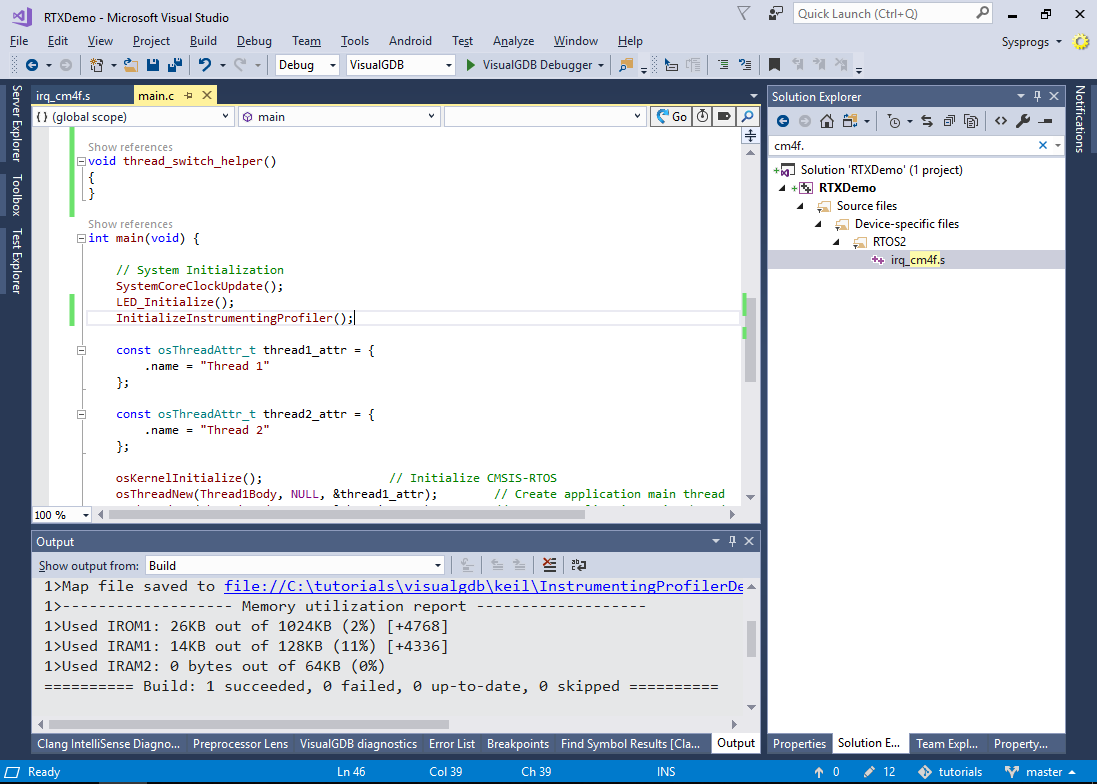
- Depending on the version of RTX you are using, you may encounter a “missing thread_switch_helper()” error. If this happens, follow the instructions in this tutorial to patch the RTX interrupt handler so that VisualGDB will be able to profile low-level RTX functions.
- Click Analyze->Analyze Performance with VisualGDB again, then click “Enable relocation record generation”:
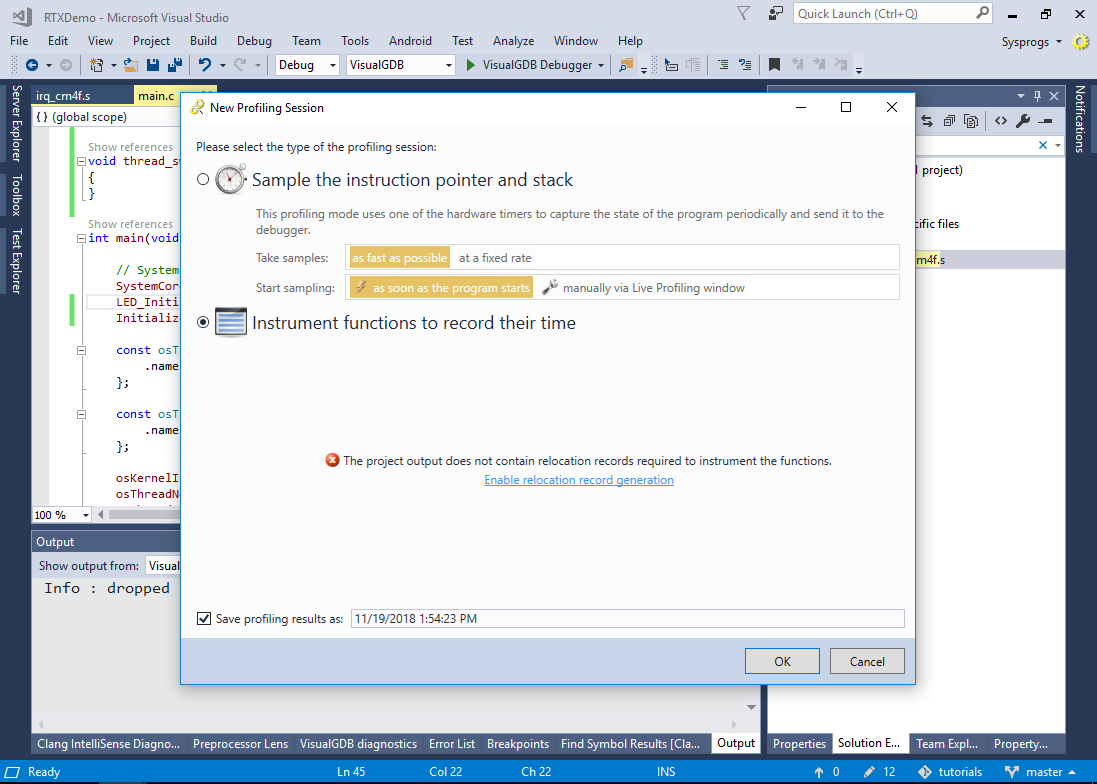
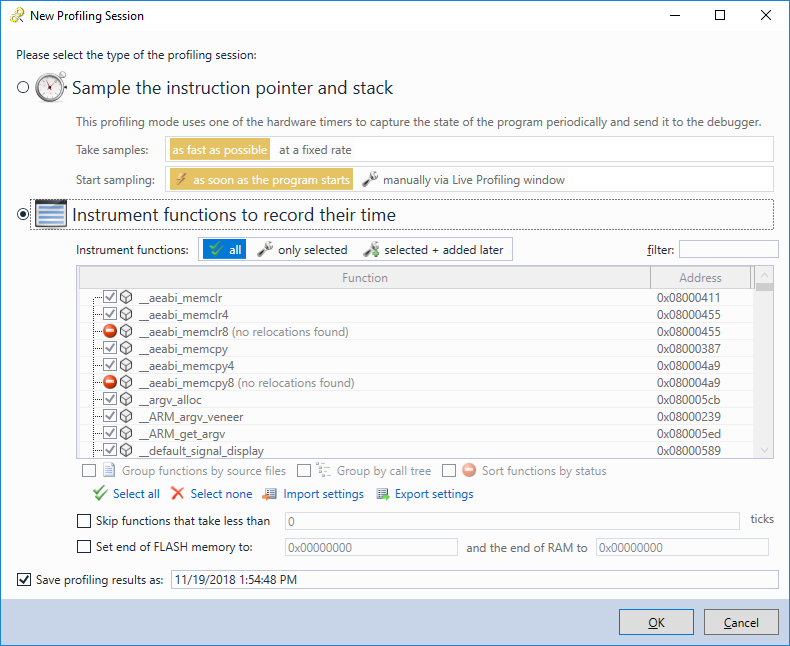
- Click “Analyze Performance with VisualGDB” again. Now you will be able to select the functions you would like to profile (VisualGDB will automatically exclude the functions that cannot be profiled). Click “OK” to begin profiling:
- If you are using the default RTX configuration, the initial profiling session will result in an error:
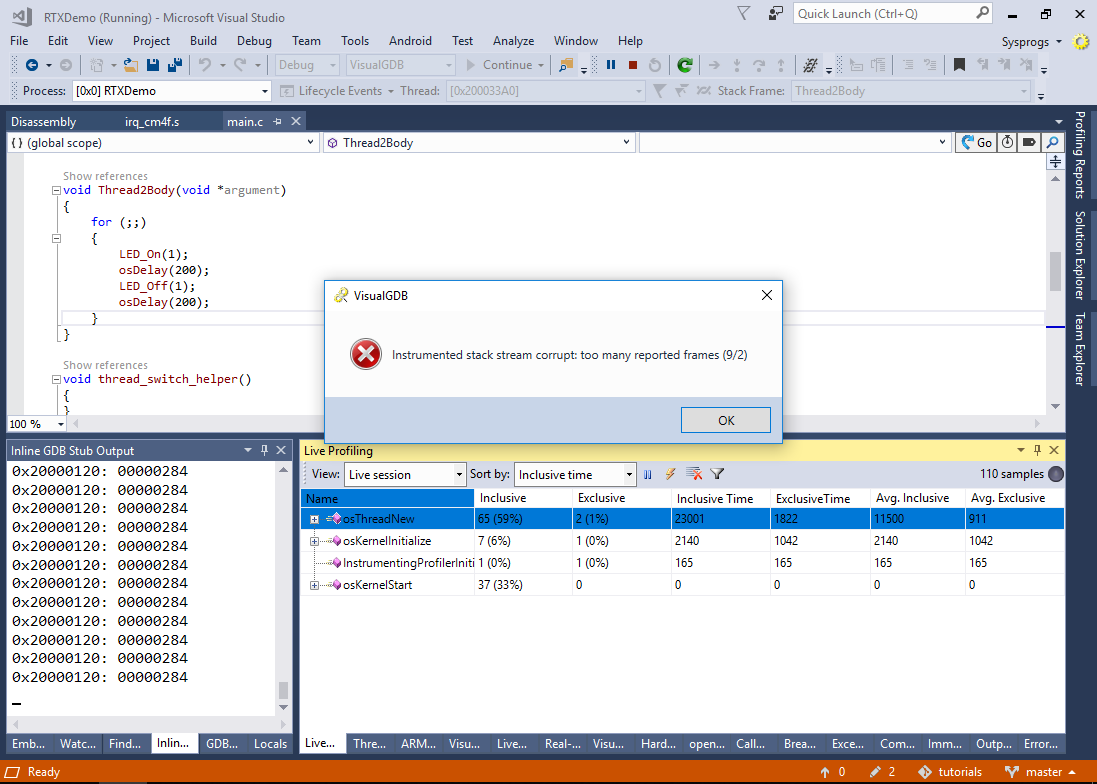
- Stopping the program in debugger will quickly reveal that RTX has detected a stack underflow:
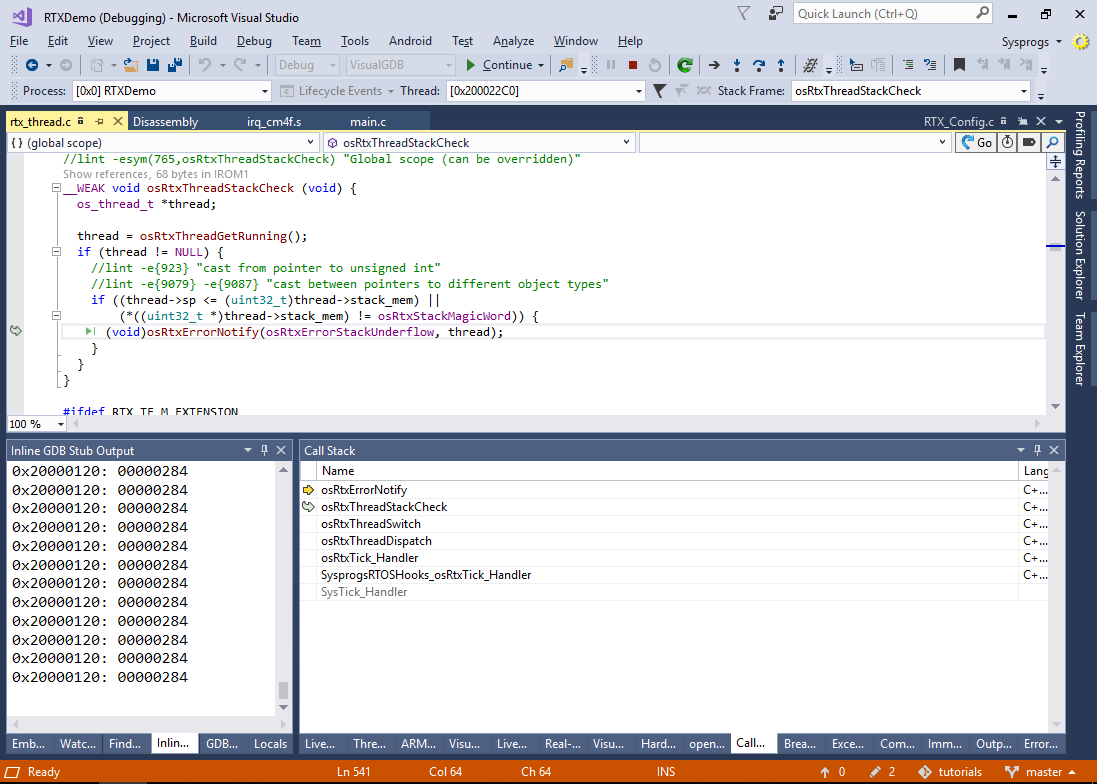
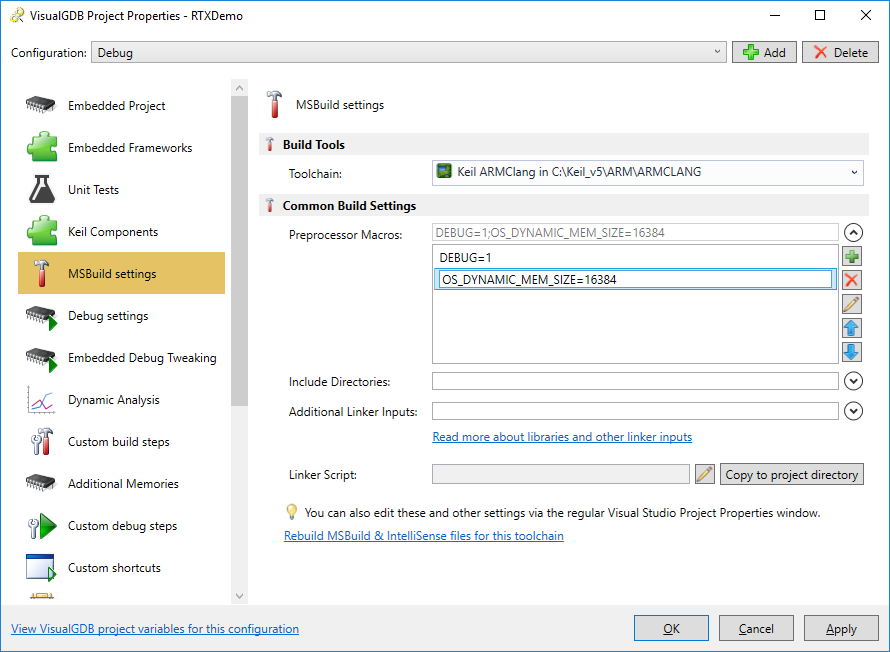
- This can be easily fixed by increasing the RTX dynamic memory size and then increasing the sizes of each thread you would like to profile (VisualGDB automatically excludes the idle thread). Add “OS_DYNAMIC_MEM_SIZE=16384” to the preprocessor macros and set the “.stack_size = 4096” attribute in the thread1_attr and thread2_attr structures:
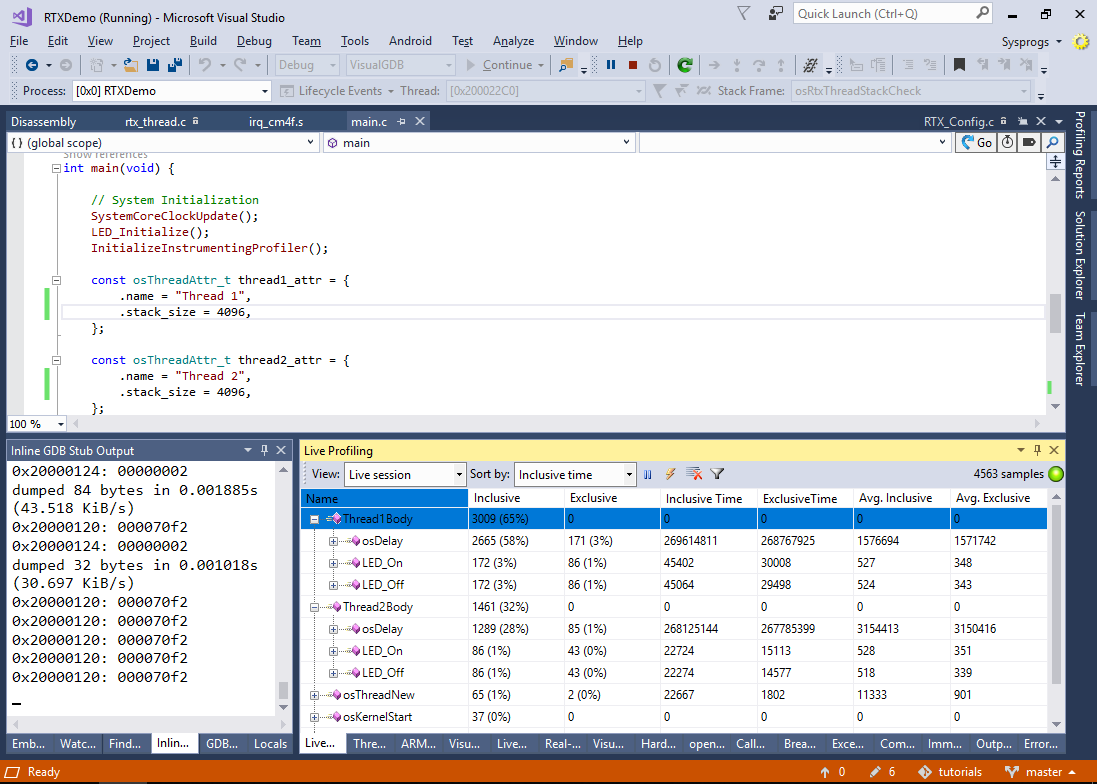
- Build the project and start another profiling session. VisualGDB will now show the real-time call tree for each of the threads, including the number of calls and the time spent in each of the called functions:
- You can analyze the stack overhead of the VisualGDB’s profiler by setting a breakpoint in the WriteRawFastSemihostingData() function and using the debug stack view in Embedded Memory Explorer:
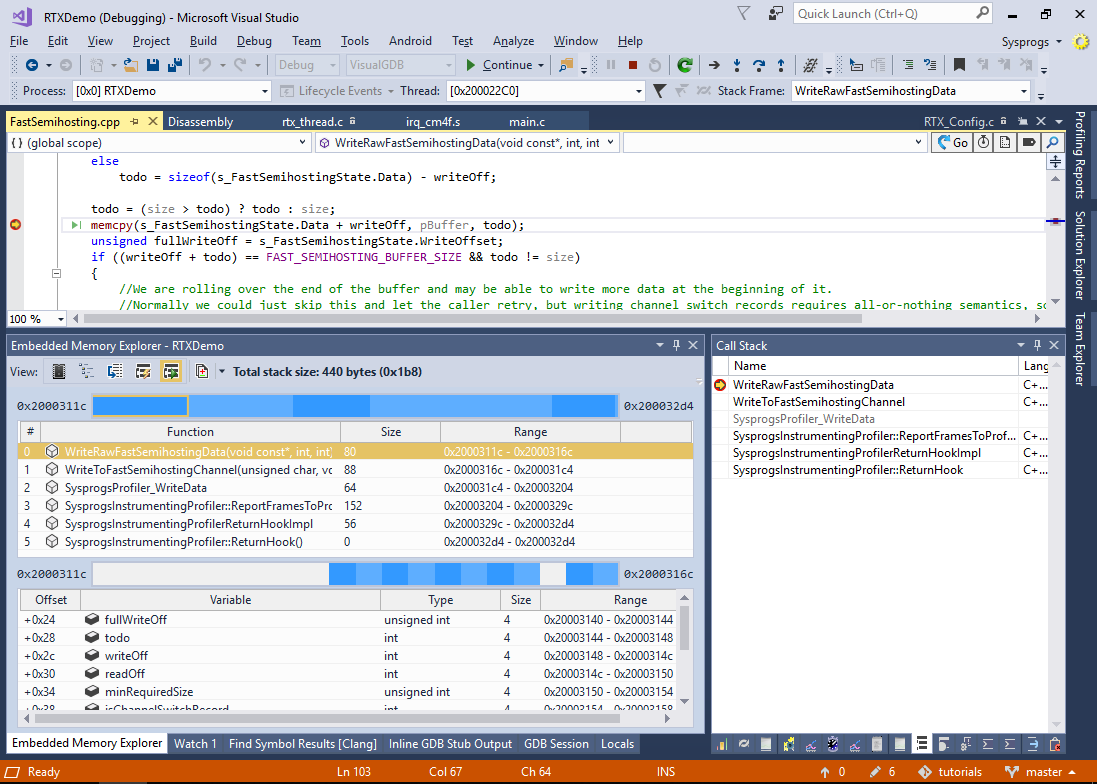 Note that this will only show the overhead (size required by the profiler framework functions), as the gdb debugger won’t be able to unwind the stack past the ReturnHook() function and show the actual stack.