Profiling RTX-based Projects with the Sampling Profiler
This tutorial shows how to use the VisualGDB’s sampling profiler to analyze the performance of the projects build with the Keil compiler using the RTX operating system.
The sampling profiler works by periodically capturing the contents of the processor’s stack and reporting it to VisualGDB. This produces less accurate results than the instrumenting profiler, however results in much less overhead, as it does not need to record each of the functions individually.
Before you begin, create a basic RTX-based “Blinking LED” project by following this tutorial.
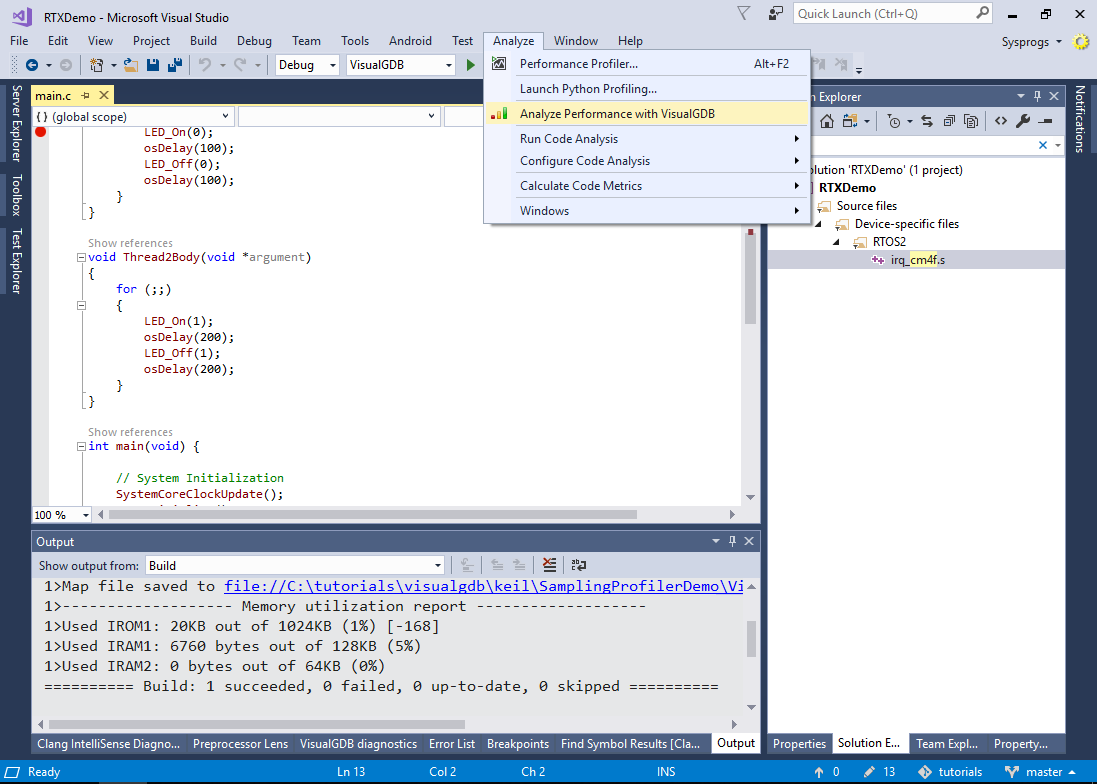
- Open your project in Visual Studio and click Analyze -> Analyze Performance with VisualGDB:
 Click “Yes” when VisualGDB prompts to add a reference to the profiler framework.
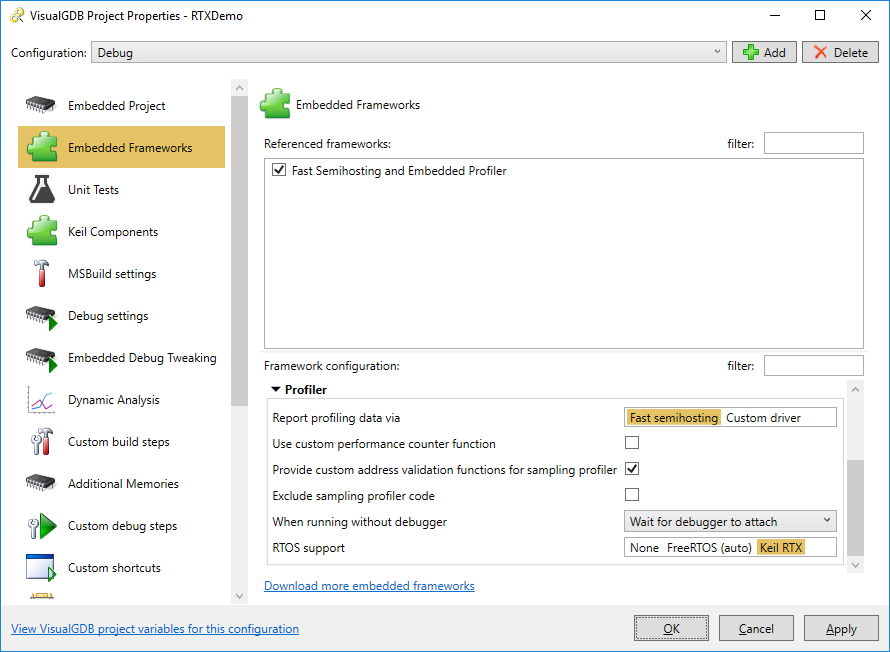
 - Open VisualGDB Project Properties and go to the Embedded Frameworks page. In order to avoid sending the entire stack to VisualGDB at each sample, the sampling profiler uses a pair of auxiliary functions to determine whether a certain value looks like a valid code or stack pointer. For GCC-based projects, this can be determined automatically based on the symbols generated by the GNU linker, however the projects built with the Keil compiler need to handle this explicitly. Check the “Provide custom address validation functions” checkbox to override the default GCC-based checks. Also set RTOS support to Keil RTX:
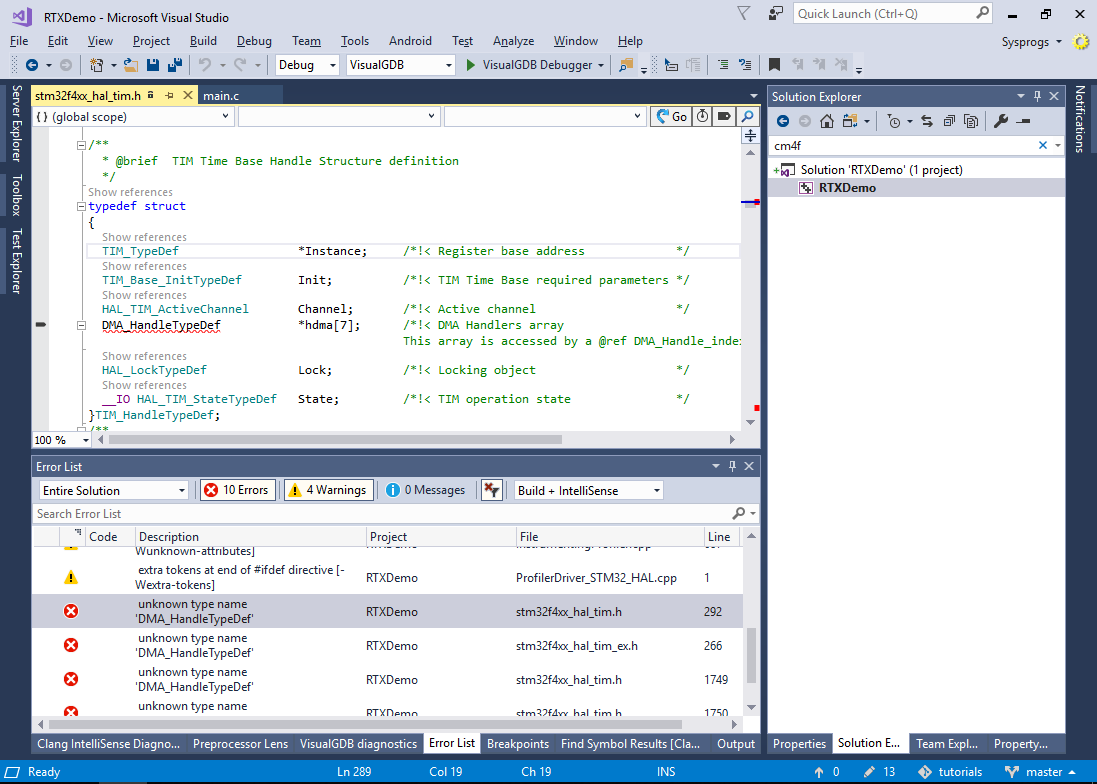
- Depending on your project configuration, you may get errors due to the missing STM32 components when trying to build the profiler code:
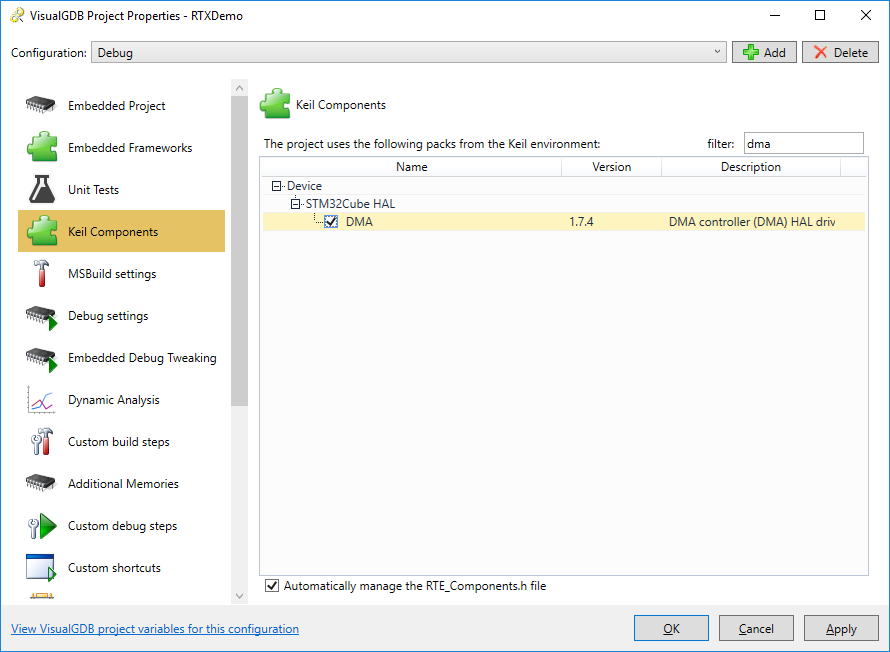
- If this happens, go to the Keil Components page of VisualGDB Project Properties and add the missing components to your project:
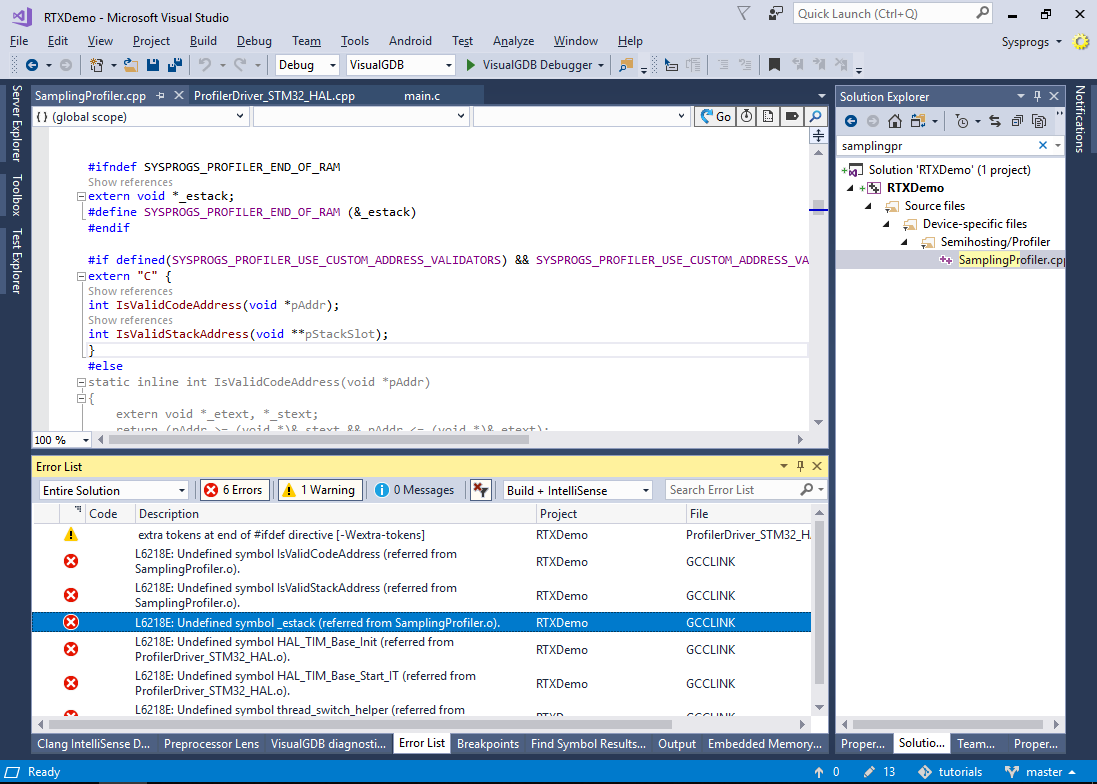
- If you try building the project now, it will fail due to missing _estack symbol and the address validation functions:
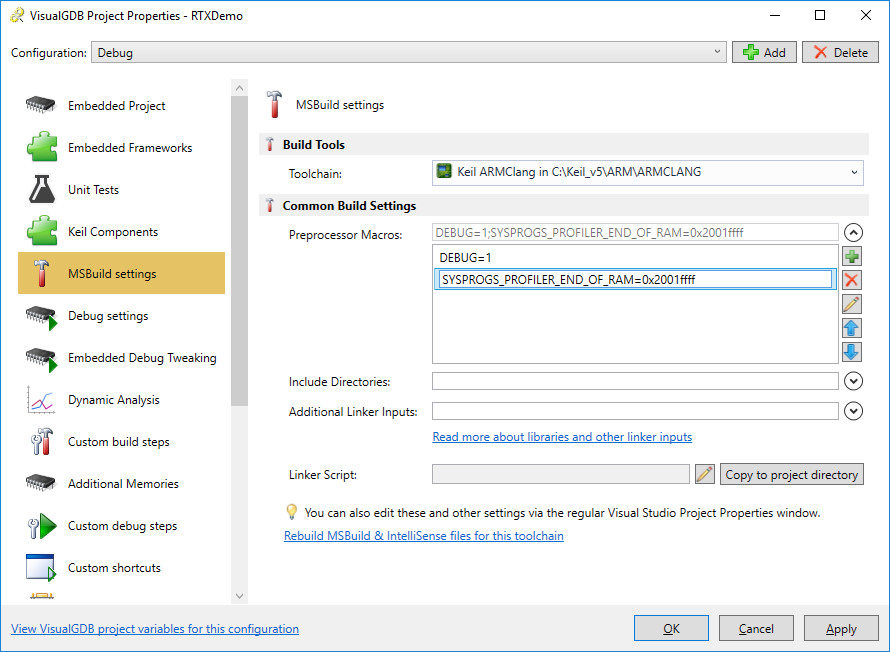
- Locate the end of the stack memory from your device specification (or the VisualGDB’s Memory Explorer) window and define the SYSPROGS_PROFILER_END_OF_RAM macro to point there:
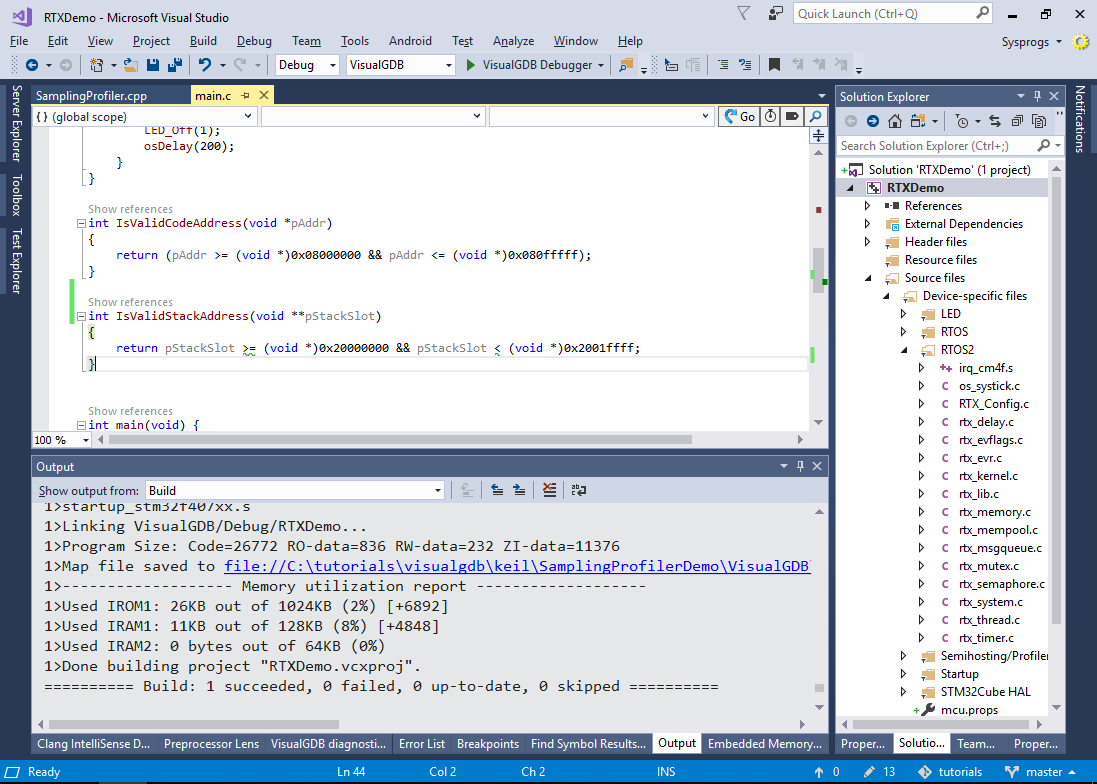
- Then add the address checking functions to your main file. For the STM32F407VG device shown in this tutorial, the functions will look as follows:
int IsValidCodeAddress(void *pAddr)
{
    return (pAddr >= (void *)0x08000000 && pAddr <= (void *)0x080fffff);
}

int IsValidStackAddress(void **pStackSlot)
{
    return pStackSlot >= (void *)0x20000000 && pStackSlot < (void *)0x2001ffff;
}
Now you should be able to build the project:
- Select Analyze -> Analyze Performance with VisualGDB again and choose the sampling profiler. Set the sampling rate at 100 times per second:
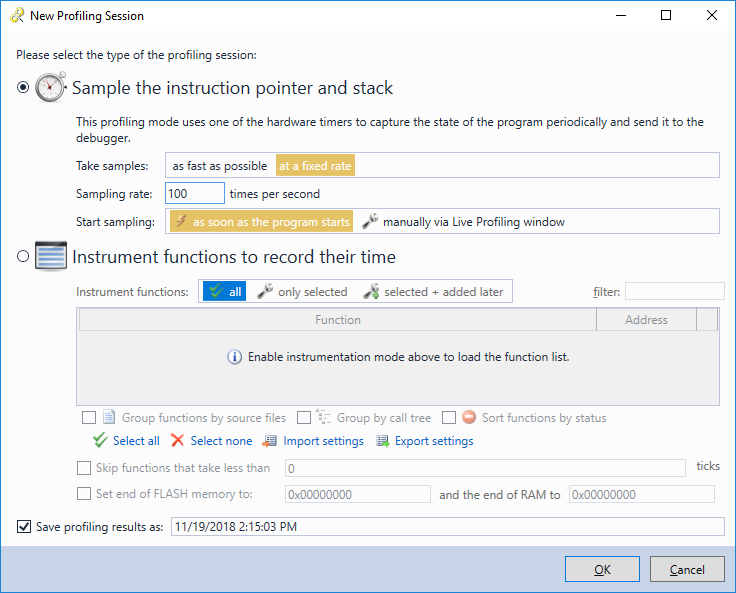
- Press OK to begin profiling. VisualGDB will capture the snapshots of the CPU’s stack 100 times per second, will unwind them and display them in the Live Profiling window:
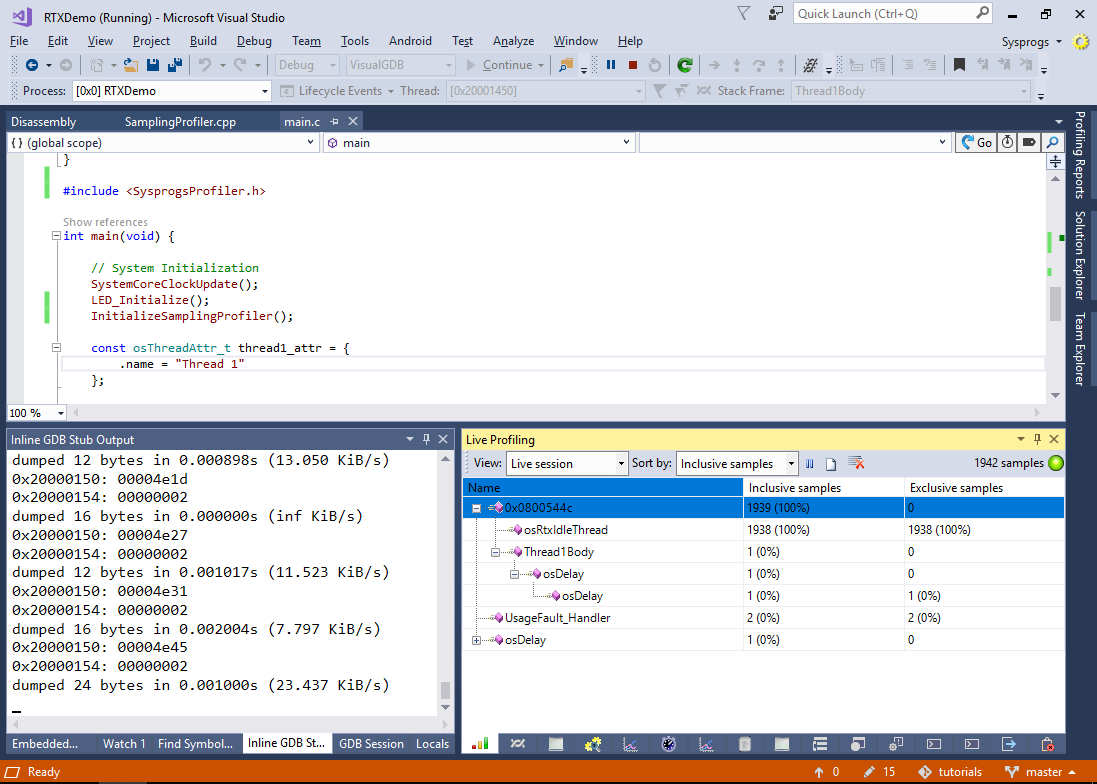 As most of the time both threads are sleeping, the periodic sampling of the stack will almost exclusively show the idle thread. To get more detailed performance information, use the instrumenting profiler as shown in this tutorial.