Tracing the Real-Time Events in RTX-based Projects with Real-Time Watch
This tutorial shows how to use the real-time watch feature of VisualGDB to trace the thread and function run times as well as the mutex and queue use for projects based on the RTX operating system. We will create a basic project using the Keil compiler, add the RTX5 pack to it and will show how to use real-time watch to trace various events in it.
Before you begin, install VisualGDB 5.4 Preview 10 or later and create a basic “Blinking LED” project using the RTX operating system by following this tutorial.
- Open VisualGDB Project Propertes for your project and go to the Embedded Frameworks page. Then reference the “Fast Semihosting and Embedded Profiler” framework:
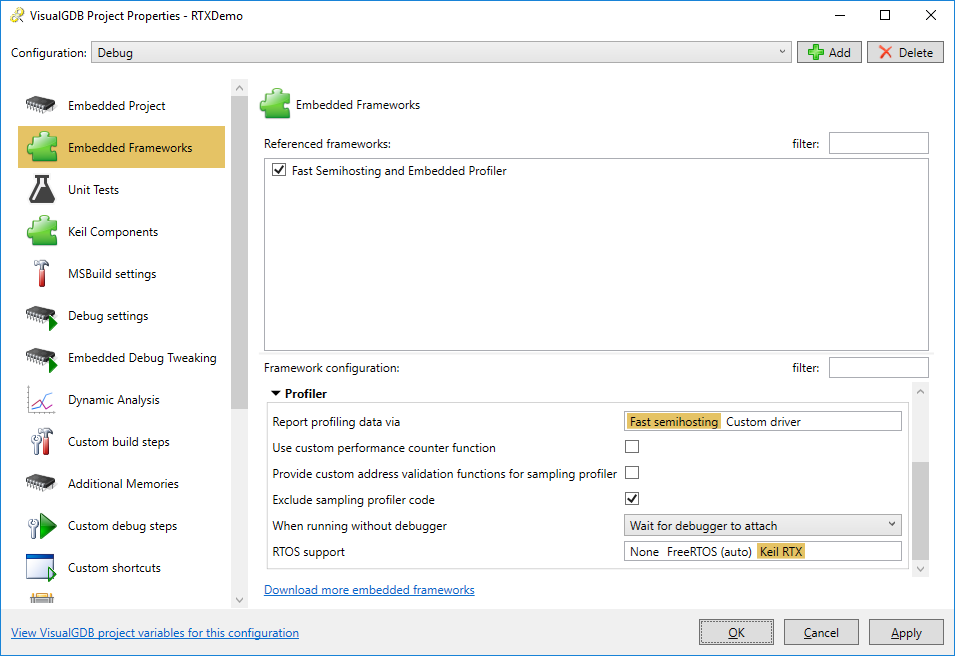 As configuring the sampling profiler under the Keil compiler requires extra steps, select “Exclude sampling profiler code” in the framework configuration. Also set RTOS support to “Keil RTX”.
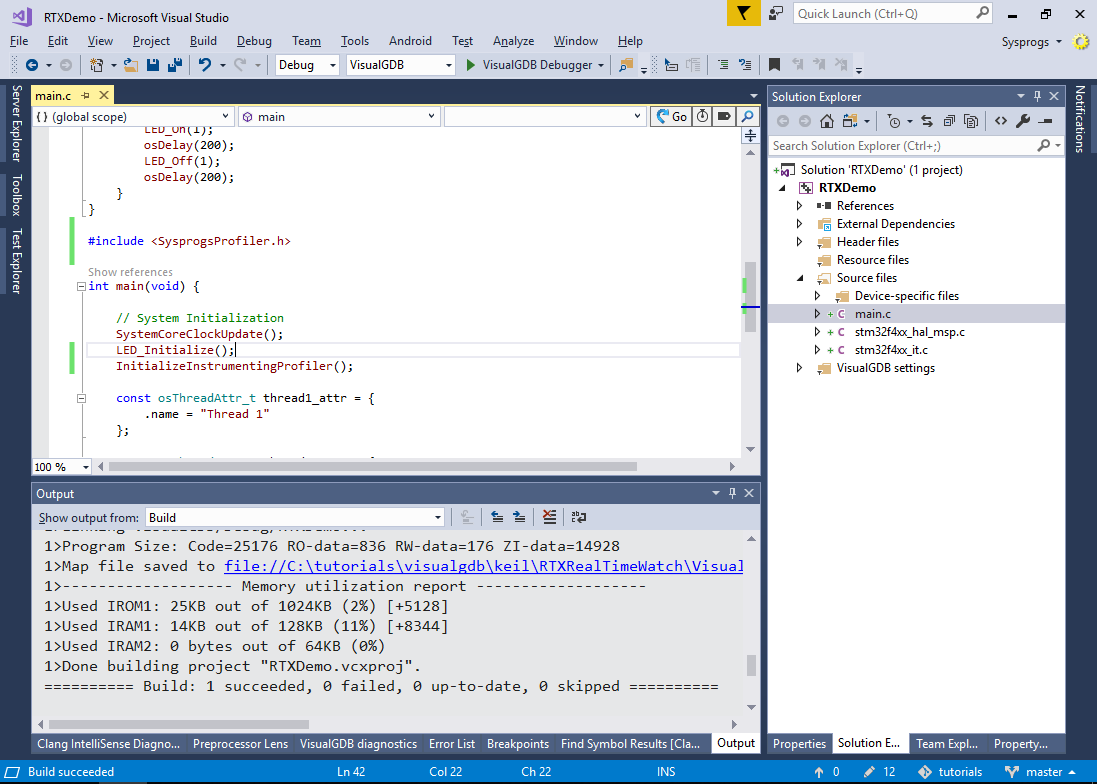
 - Include the <SysprogsProfiler.h> file from your main() function and call InitializeInstrumentingProfiler() after you set the system clock frequency:
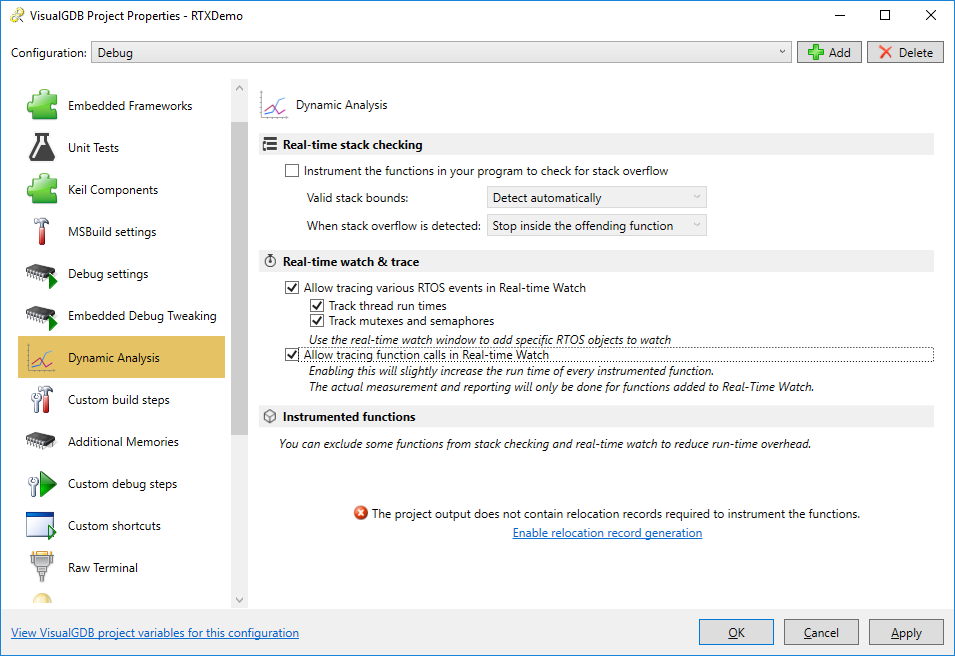
- Open VisualGDB Project Properties again, go to the Dynamic Analysis page and enable tracing of RTOS events and function calls. If the project is not configured to generate relocation records, click on the link at the bottom of the page to automatically enable them:
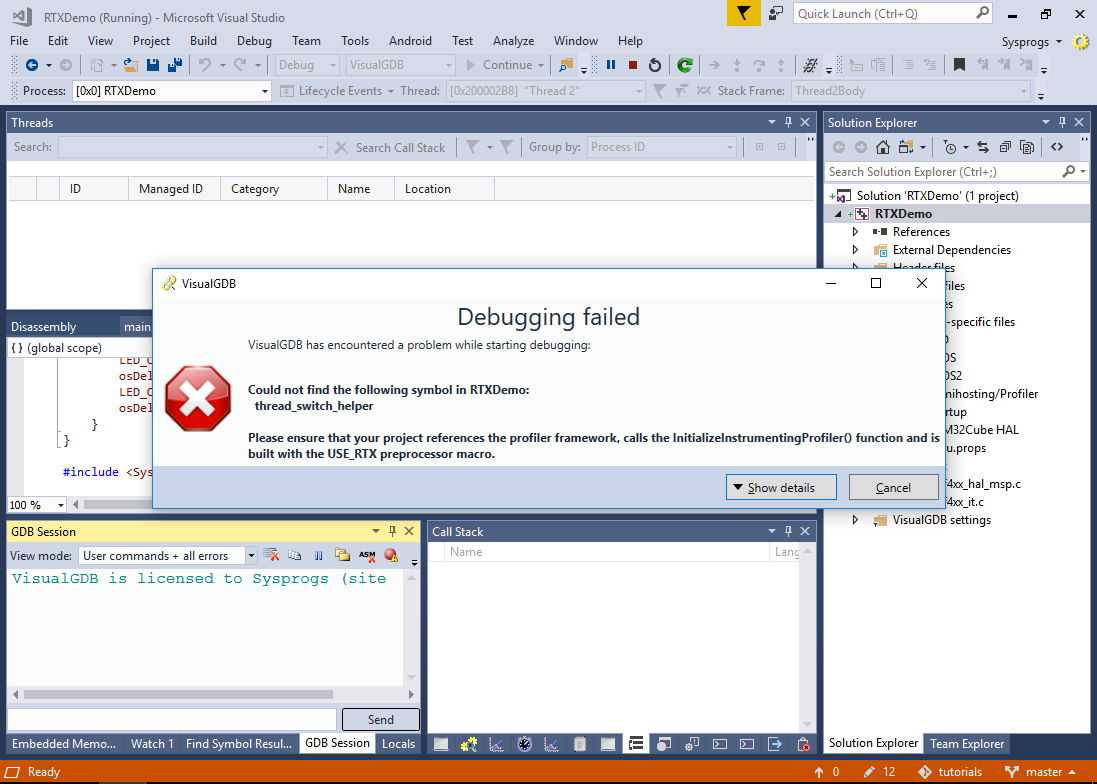
- Build the project and start debugging it. If you are using a version of RTX that does not include a low-level thread switch hook, the debugging will fail complaining about the missing thread_switch_helper() function:
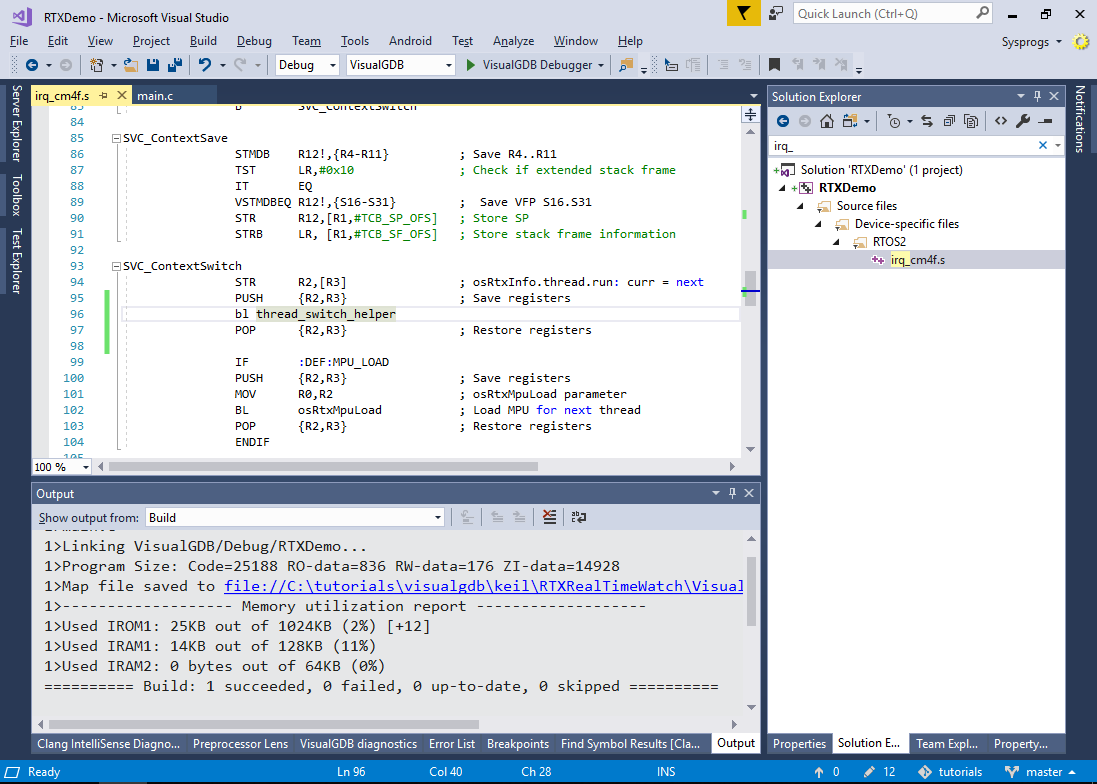
- In order to fix it, locate the RTX interrupt handler file (e.g. irq_cm4f.s) and find the SVC_ContextSwitch label. Add the following code after the “STR R2,[R3]” instruction:
PUSH {R2,R3} ; Save registers
bl thread_switch_helper
POP {R2,R3} ; Restore registers
Also add the “IMPORT thread_switch_helper” statement after the “IMPORT osRtxInfo” statement in the beginning of the SVC_Handler call:
 Finally, add an empty thread_switch_helper() function in one of your source files (don’t forget to mark it with extern “C” if you are using C++):
void thread_switch_helper()
{
}
When you start a profiling or real-time watch session with VisualGDB, the it will hook the thread_switch_helper() function redirecting it to SysprogsRTOSHooks_RTX_thread_switch_helper(), that will allow the profiler framework to maintain separate contexts for each of the RTOS threads. Hooking the low-level thread_switch_helper() instead using a higher-level EvtRtxThreadSwitched() callback allows instrumenting not only the user-mode code, but the RTX functions related to the high-level thread switching logic.
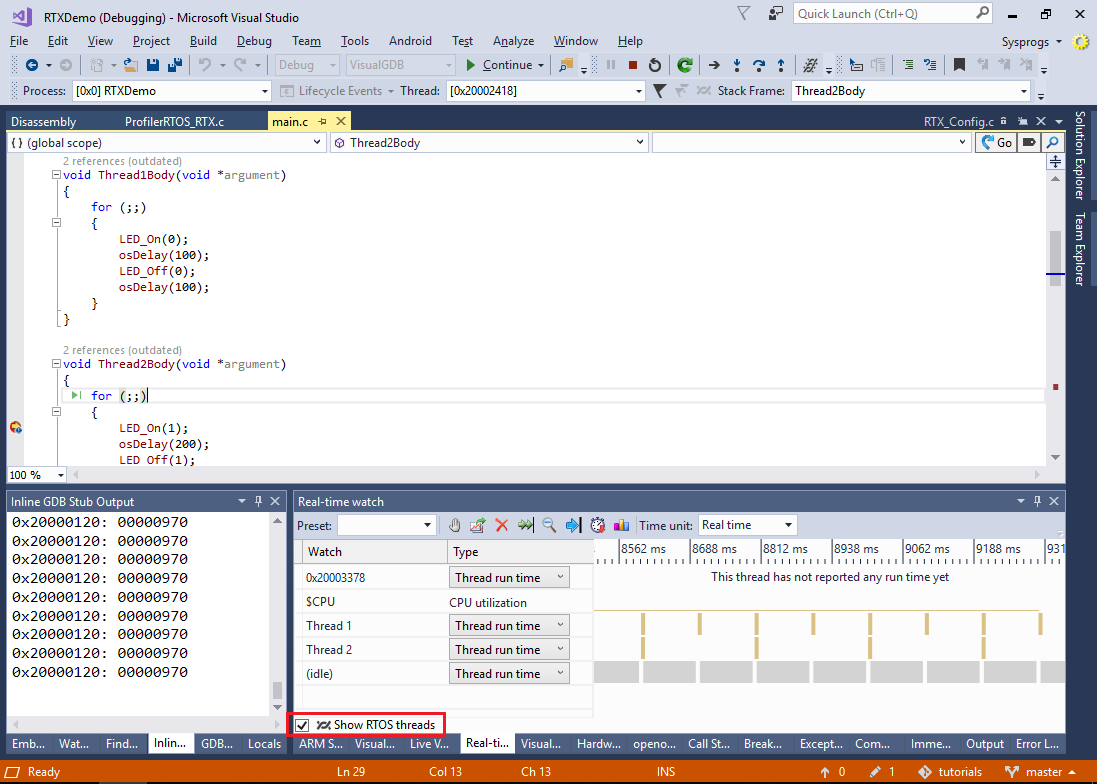
- Press F5 to begin debugging. Set a breakpoint in one of the threads and wait for it to trigger. Then open the real-time watch window and enable the “Show RTOS threads” checkbox. Once you resume the program, VisualGDB will visualize the run times of your threads. In this example, thread #1 runs twice more frequently than thread #2 as it uses twice shorter sleep delays:
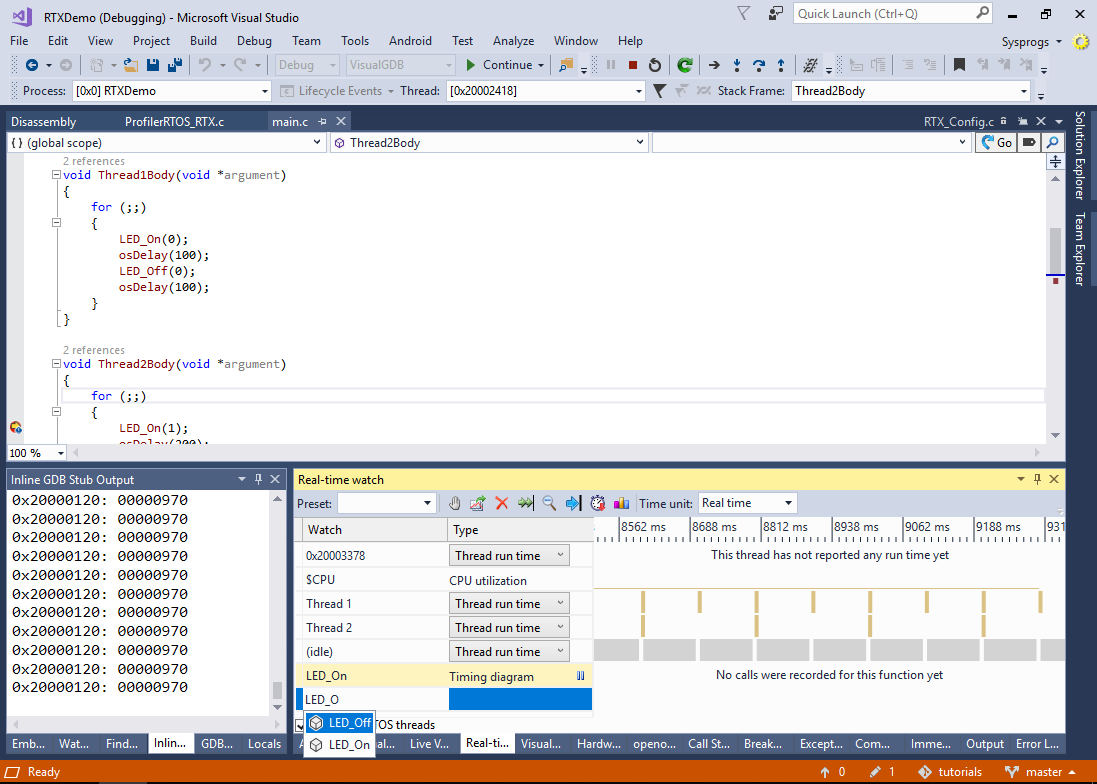
- Add the LED_On() and LED_Off() functions to the real-time watch:
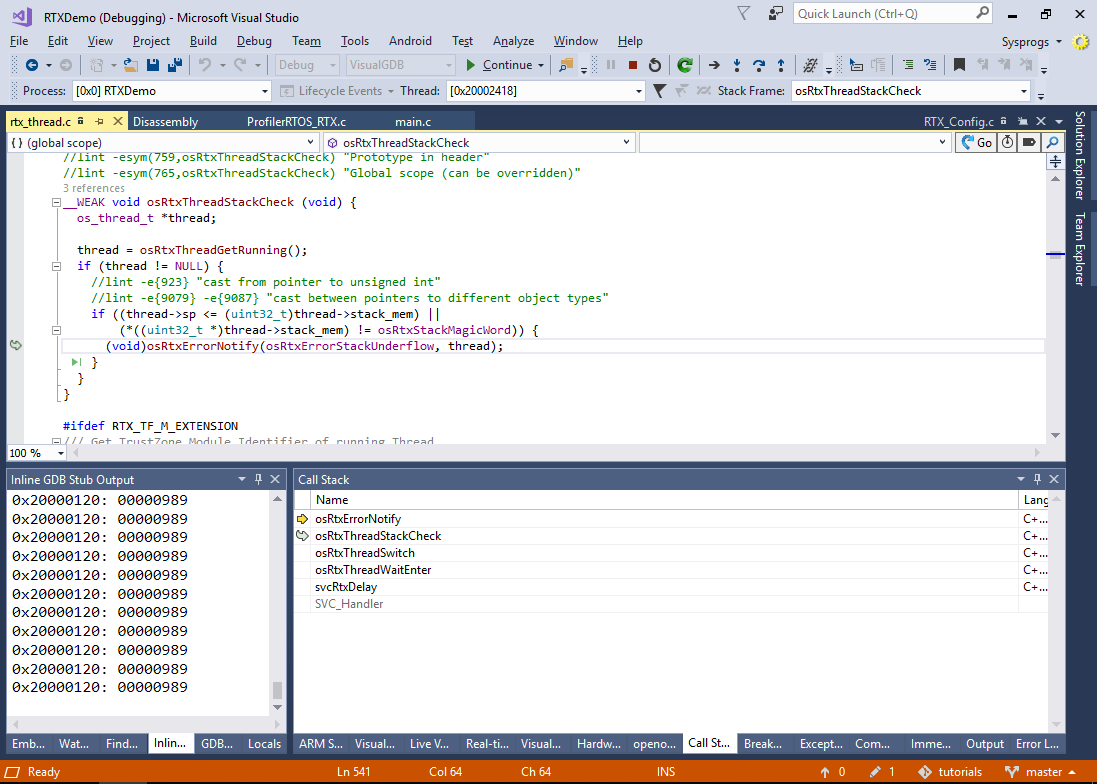
- If you try resuming the session now, the program will fail with the “Stack underflow” condition:
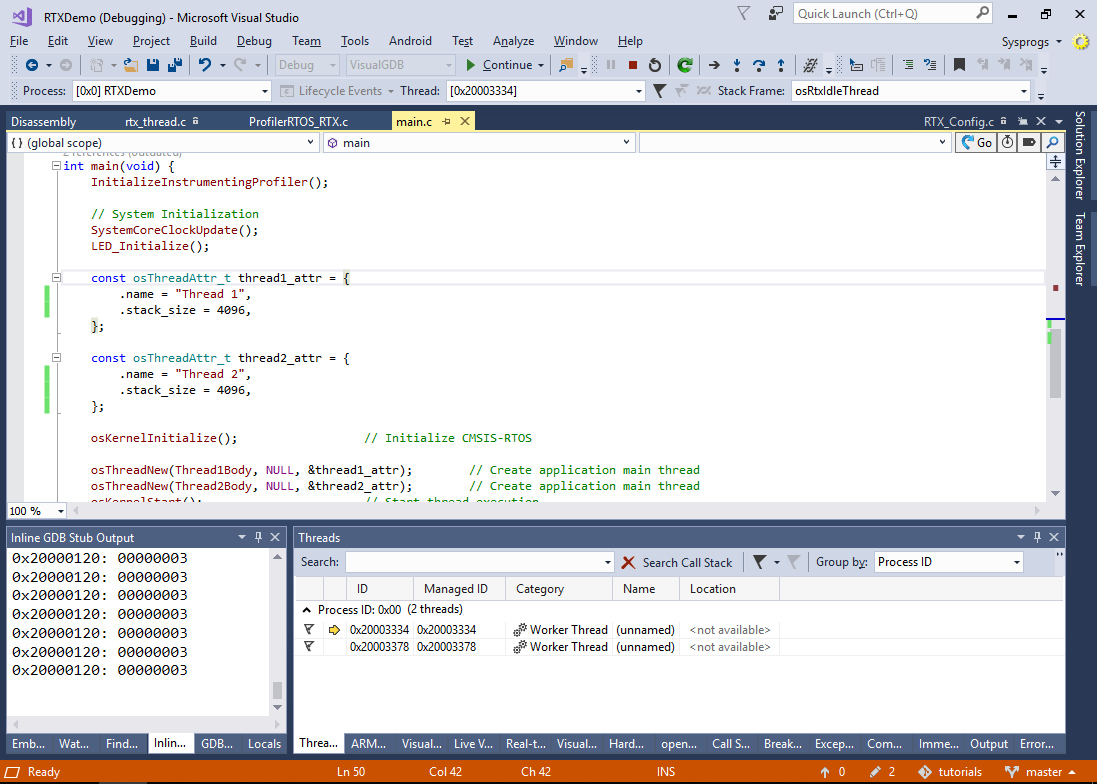
- This happens because the default RTX stack size is too small for the VisualGDB’s profiler framework functions in the debug configuration (with no optimization). You can fix this by adding “.stack_size = 4096” to the thread attributes of both threads. However, if you try running this version of the program, you will observe that the 2 user threads were never created:
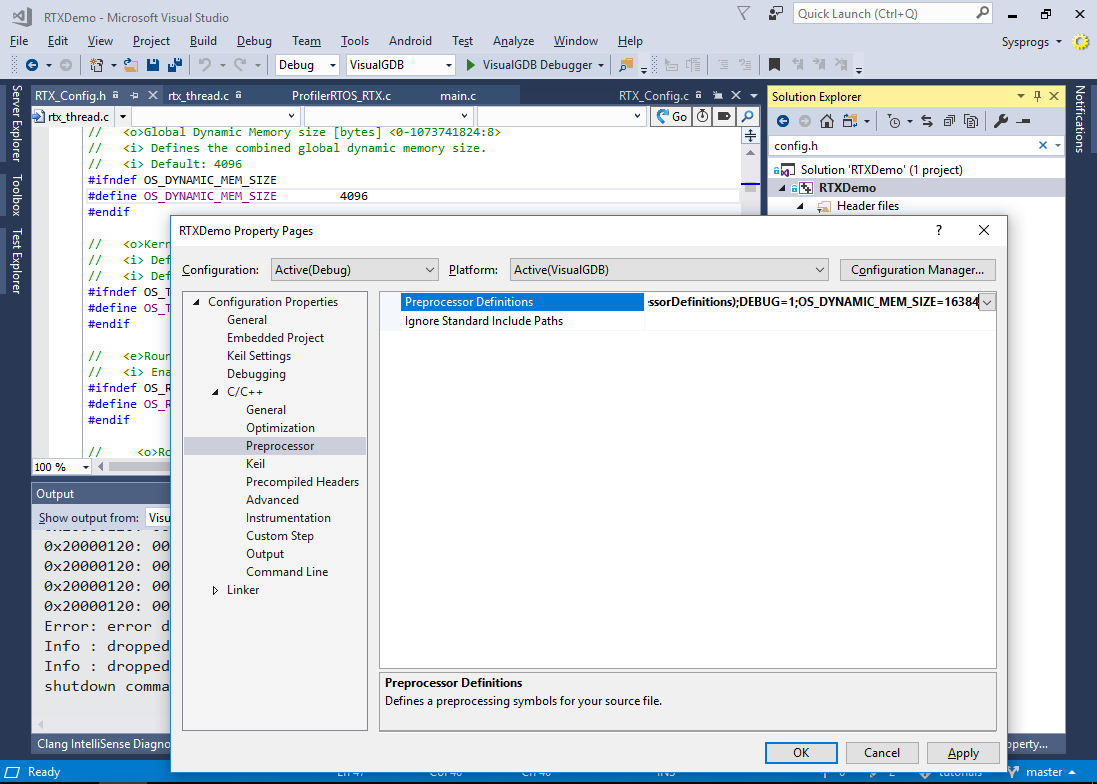
- This happens because the default RTX dynamic memory size it too small. You can increase it by adding “OS_DYNAMIC_MEM_SIZE=16384” to the preprocessor definitions:
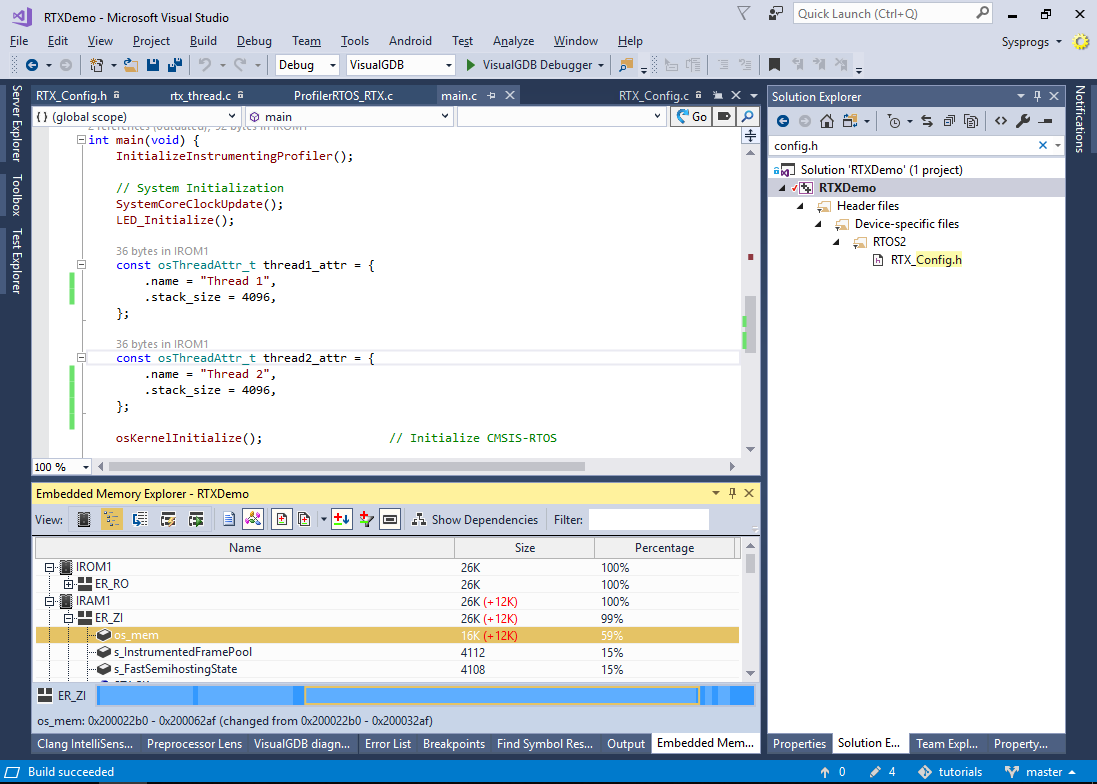
- Note how this increases the size of the os_mem variable by 12KB:
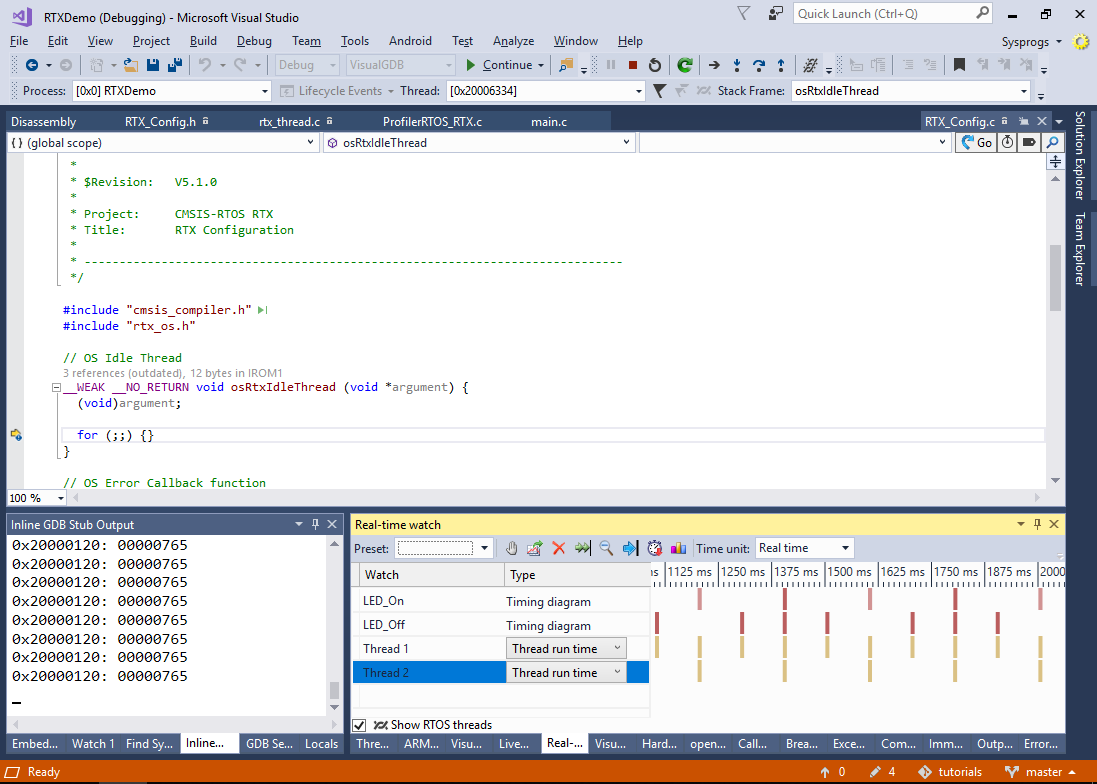
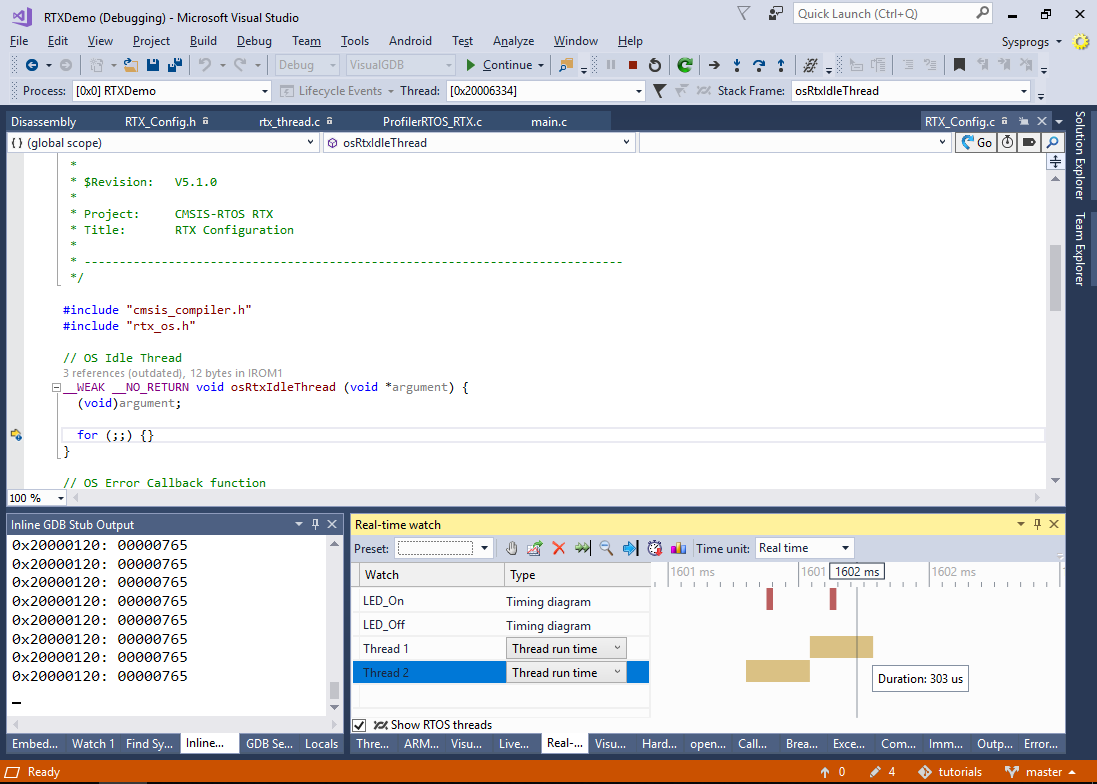
- Now you can run the program and see the timing diagram for the LED_On() and LED_Off() functions along with the thread times:
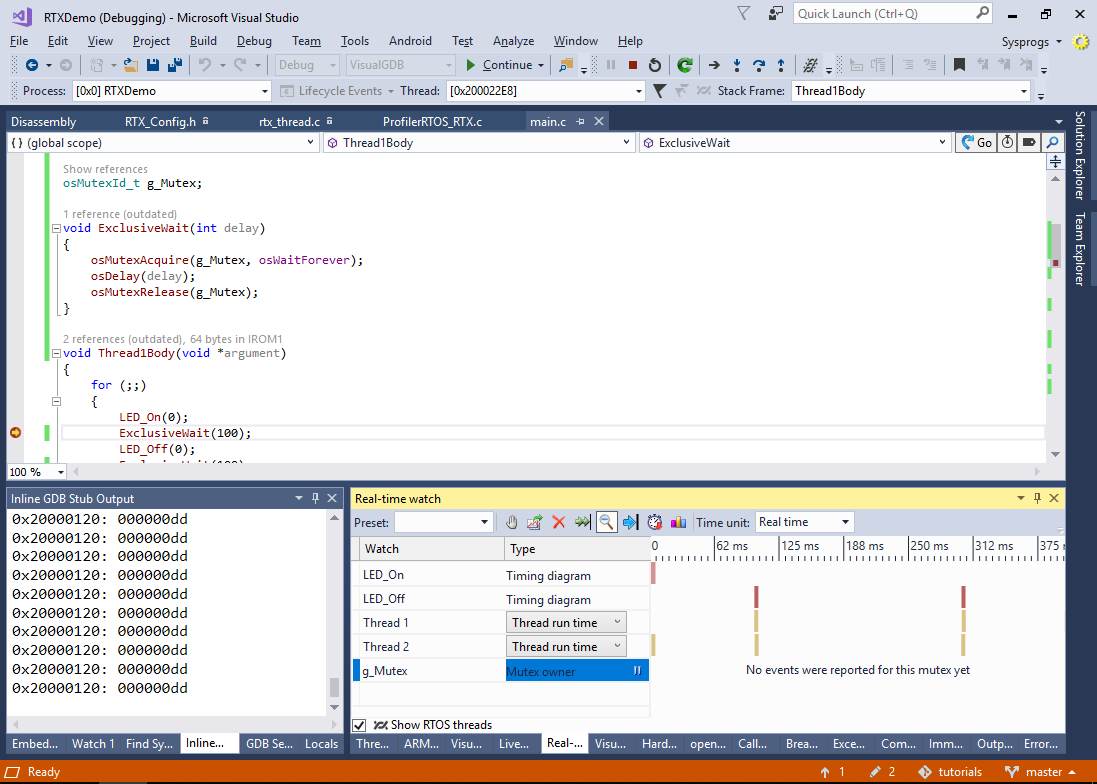
- Now we will show how to track the ownership of RTX mutexes with real-time watch. Add the following code to your project:
osMutexId_t g_Mutex;

void ExclusiveWait(int delay)
{
    osMutexAcquire(g_Mutex, osWaitForever);
    osDelay(delay);
    osMutexRelease(g_Mutex);
}

//...

int main(void)
{
    //...
    osMutexAttr_t mutexAttr = { .name = "TestMutex" };
    g_Mutex = osMutexNew(&mutexAttr);
}
Then change the thread functions to call ExclusiveWait() instead of osDelay(). This will ensure that only one thread at a time will be able to call ExclusiveWait(), so the wait times of the threads will be added.
- Start debugging and add g_Mutex to the real-time watch window:
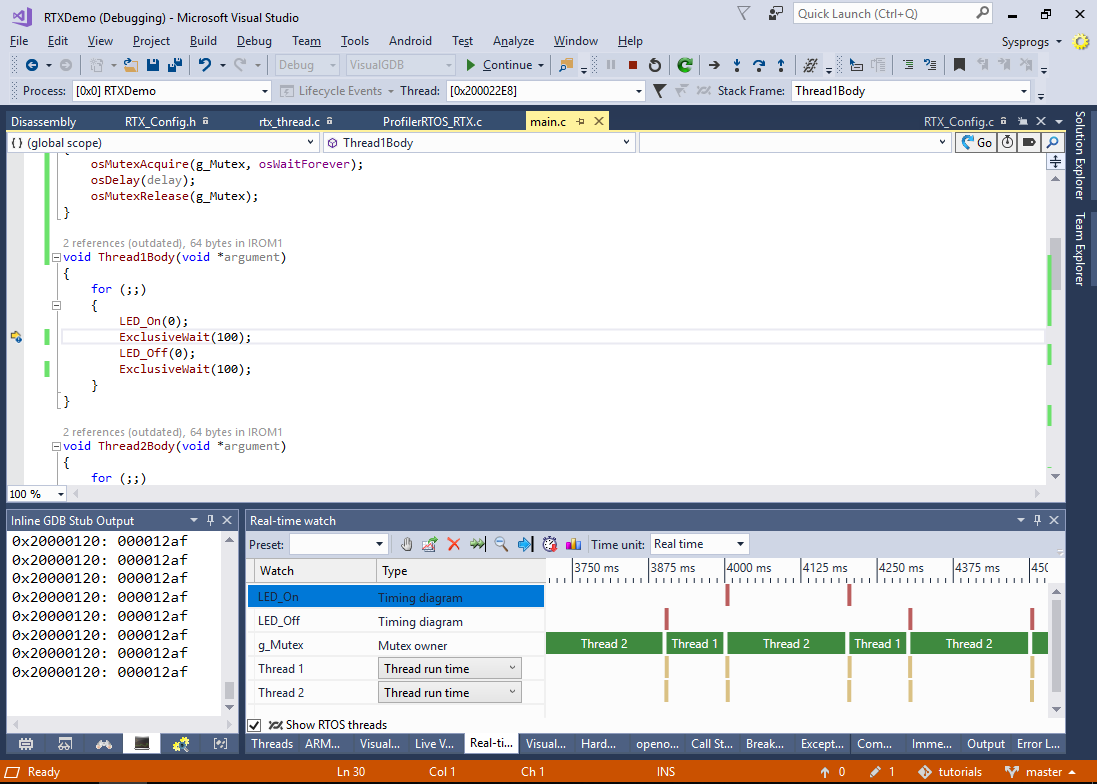
- Let the program run for a few seconds and observe the real-time watch. Note how the two threads take turns in owning the mutex:
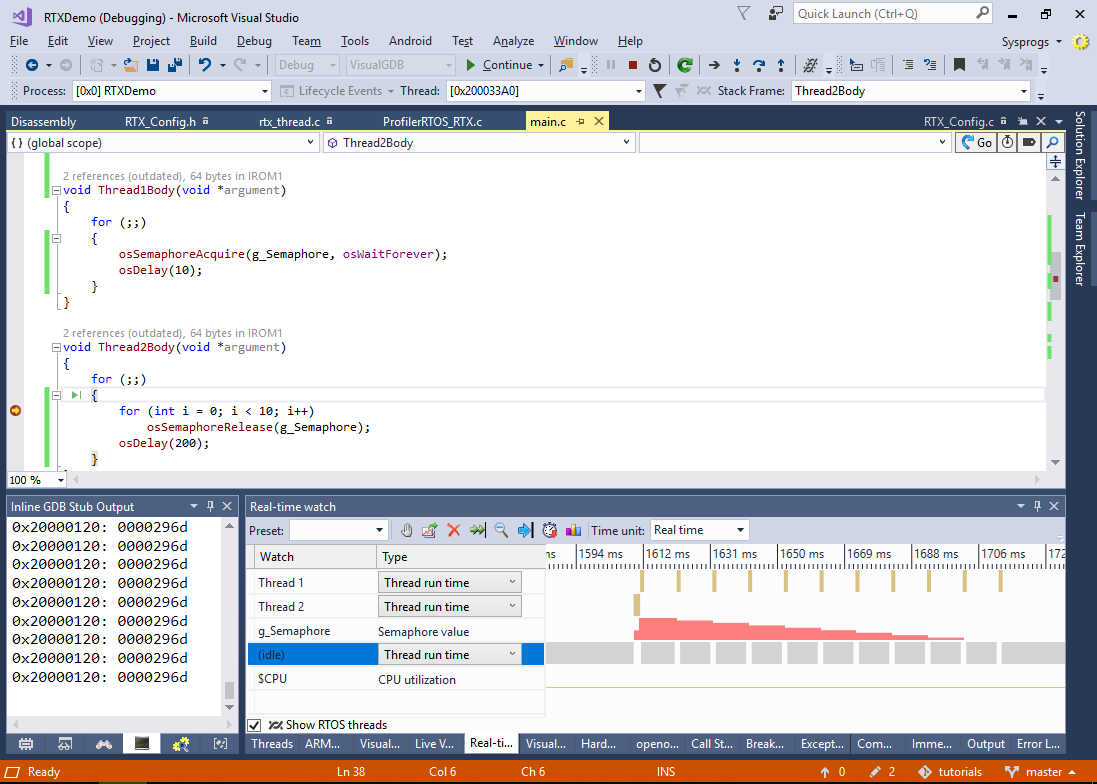
- Finally, we will demonstrate the use of a semaphore. Change the code in your main file as shown below:
osSemaphoreId_t g_Semaphore;

void ExclusiveWait(int delay)
{
    osMutexAcquire(g_Mutex, osWaitForever);
    osDelay(delay);
    osMutexRelease(g_Mutex);
}

void Thread1Body(void *argument)
{
    for (;;)
    {
        osSemaphoreAcquire(g_Semaphore, osWaitForever);
        osDelay(10);
    }
}

void Thread2Body(void *argument)
{
    for (;;)
    {
        for (int i = 0; i < 10; i++)
            osSemaphoreRelease(g_Semaphore);
        osDelay(200);
    }
}

int main(void)
{
    osSemaphoreAttr_t semaphoreAttr = { .name = "TestSemaphore" };
    g_Semaphore = osSemaphoreNew(1000, 0, &semaphoreAttr);
    //..
}
This will demonstrate a very basic producer/consumer scenario where thread #1 quickly produces 10 tokens and waits for a long time while thread #1 is consistently consuming the tokens at a slower rate.
- Start debugging and add g_Semaphore to real-time watch. Observe how the semaphore value quickly reaches the maximum and then slowly decreases as thread #1 keeps on consuming the tokens: