Profiling Linux C++ Code with Visual Studio
This tutorial shows how to profile C++ code using Visual Studio, valgrind and VisualGDB. We will show how to import the JSON for Modern C++ parser (as of 31 October 2017) into a Visual Studio project, build it under Linux, run a benchmark, quickly identify the code consuming most of the time and optimize it. We will increase the performance of the release build by over 1.5x by locating and eliminating a few bottlenecks.
The techniques shown in this tutorial can work with any other C/C++ code as well; we are using the JSON parser to simply demonstrate the functionality on a real-world project rather than on a synthetic example.
Before you begin, install Visual Studio and VisualGDB 5.3 or later. Also prepare a Linux machine that will be used to build and profile the JSON benchmark.
- Start Visual Studio and open the VisualGDB Linux Project Wizard:

- On the first page of the wizard select “Import a project -> Import a CMake project -> Use the advanced CMake Project Subsystem”:

- On the next page select the Linux machine you want to use for building:

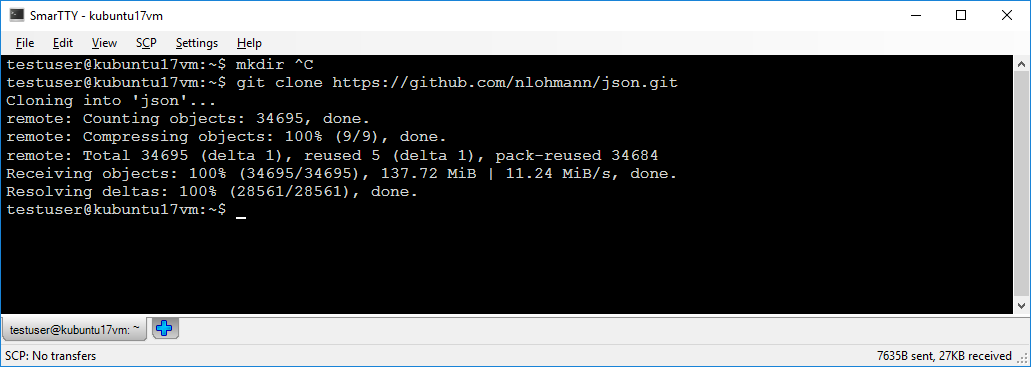
- Connect to your Linux machine over SSH and clone the https://github.com/nlohmann/json repository to a local directory:
- Get back to VisualGDB Project Wizard and specify the directory where you cloned the repository:

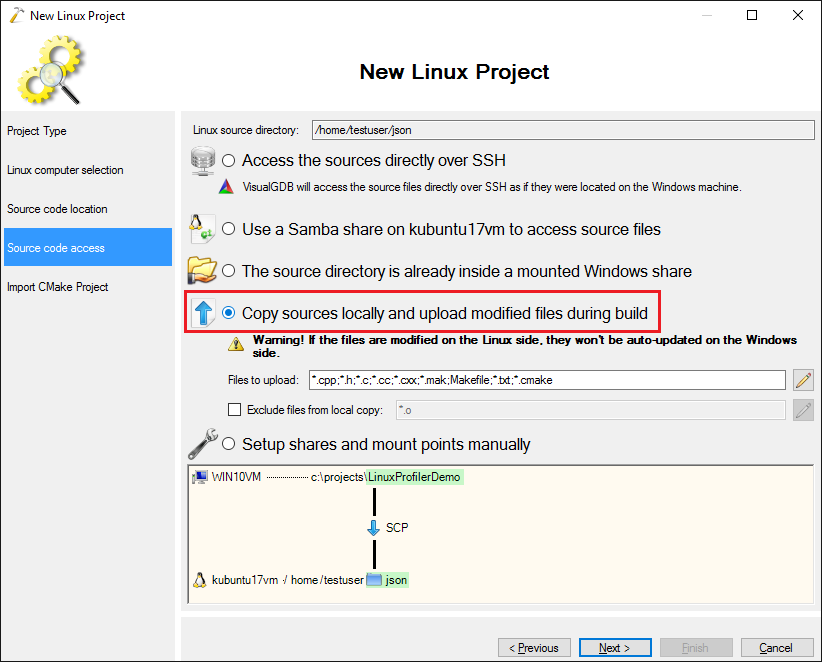
- Although VisualGDB can access the remote files directly over SSH, it is recommended to copy them locally if you want to use the profiler. This will help VisualGDB adjust the function locations reported by valgrind based on the actual function declarations:
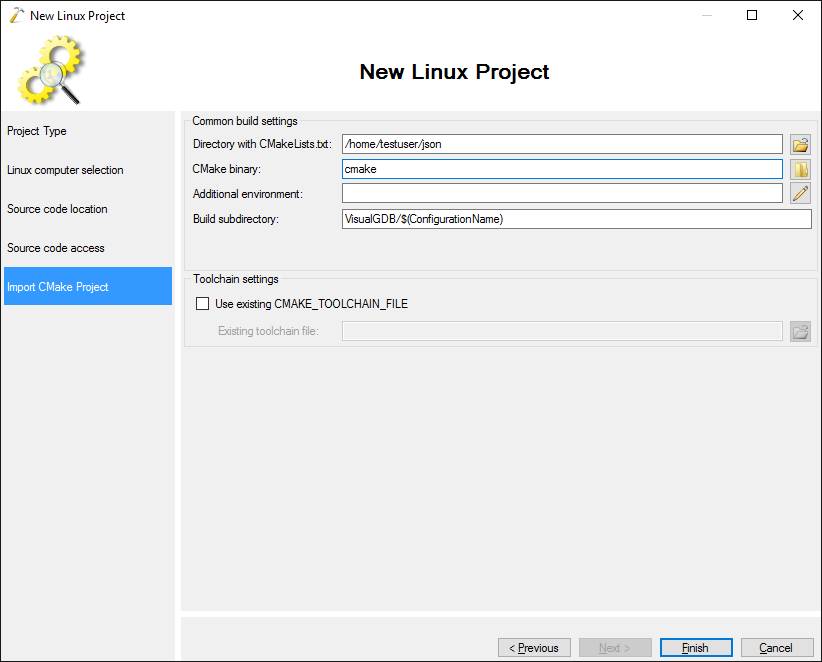
- Proceed with the default settings on the last page:
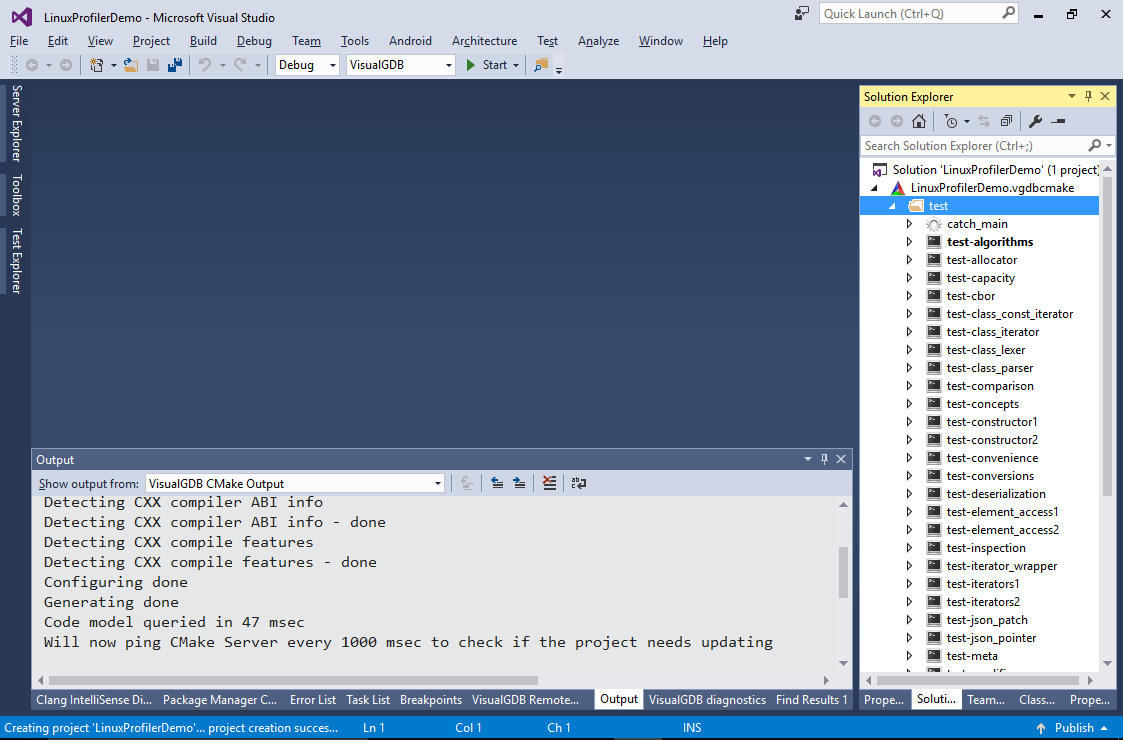
- Press “Finish” to create the project. VisualGDB will automatically detect the targets declared in the original CMakeLists.txt file and show them in Solution Explorer:
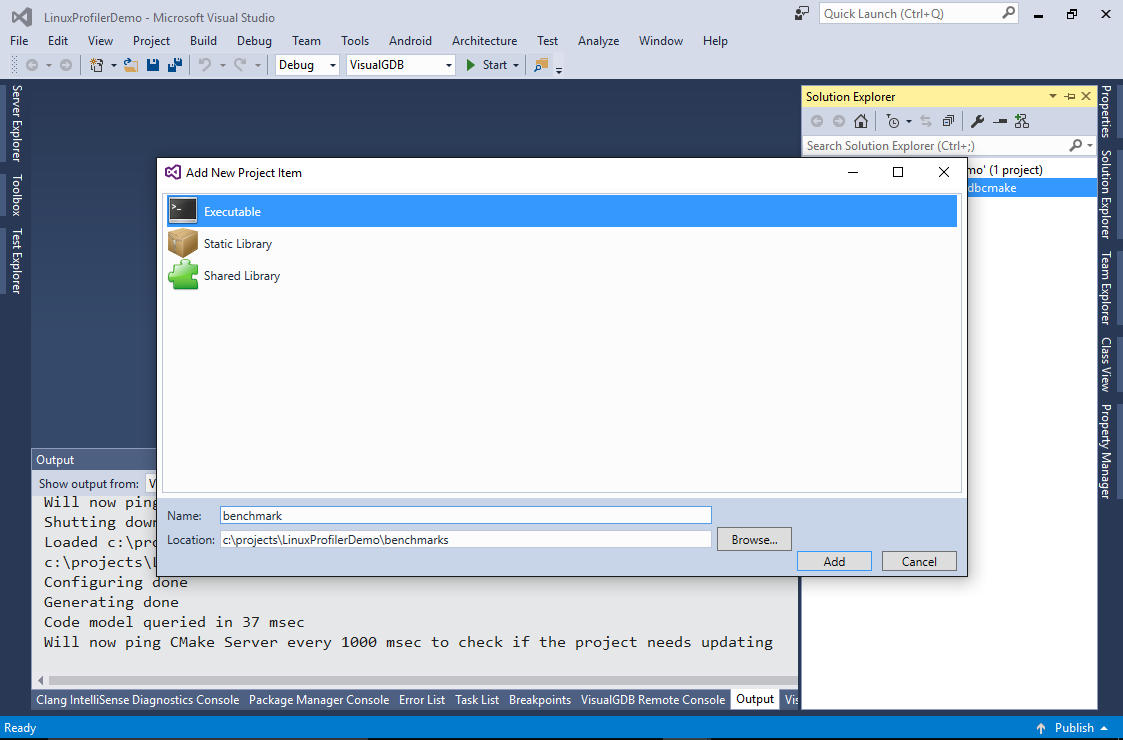
- The original CMakeLists.txt files don’t contain the targets for the benchmark. You can add it manually by right-clicking on the .vgdbcmake project and selecting “Add->New Items->Executable”. Add an executable called “benchmark” in the “benchmarks” subdirectory:
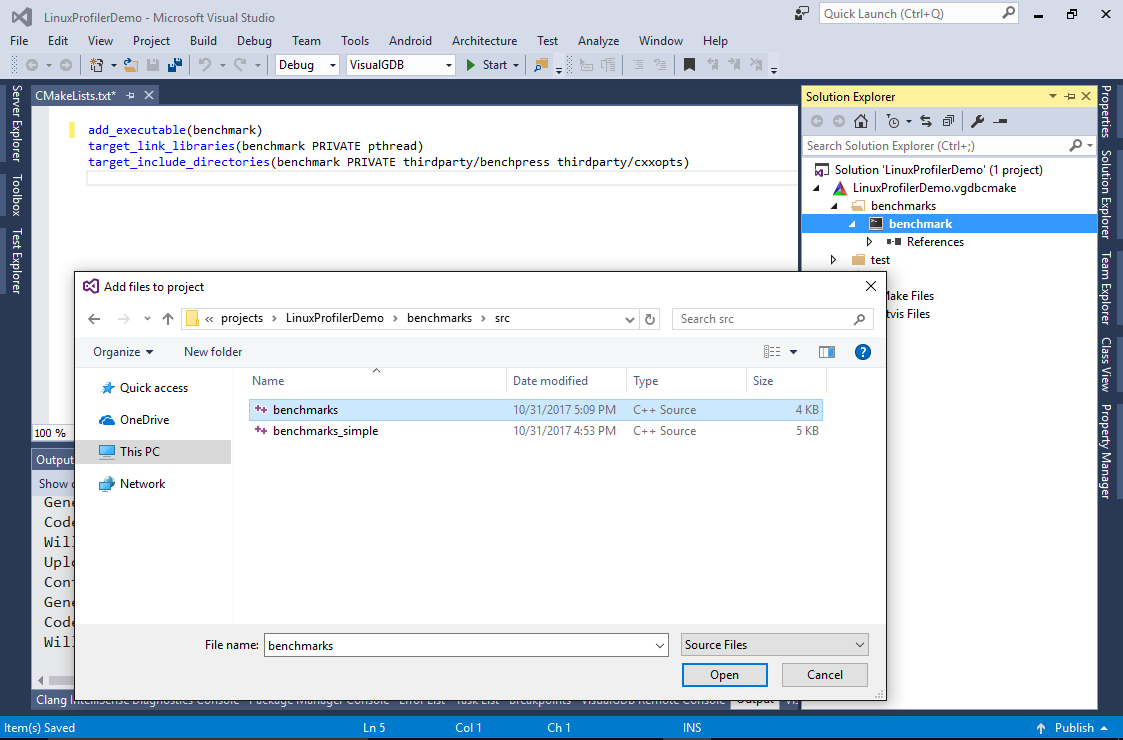
- VisualGDB will automatically create the CMakeLists.txt file in that subdirectory. Remove the auto-generated source file and reference the benchmarks.cpp file instead:
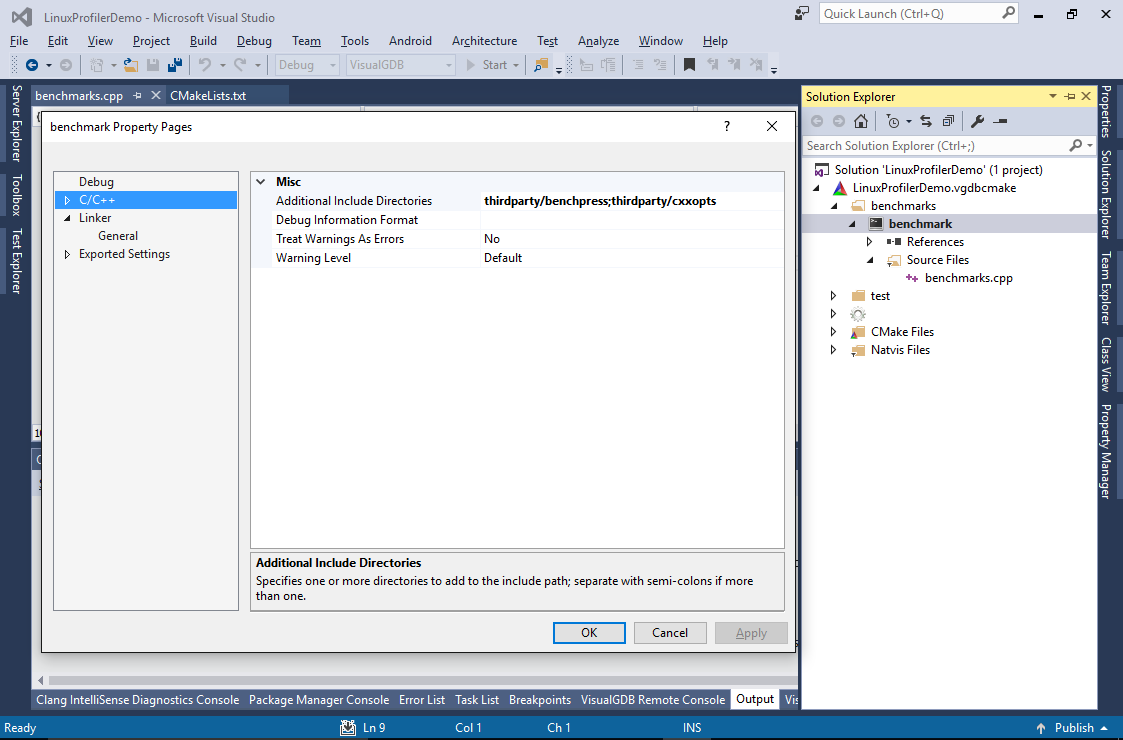
- Add “thirdparty/benchpress” and “thirdparty/cxxopts” to the include directories for the new target:
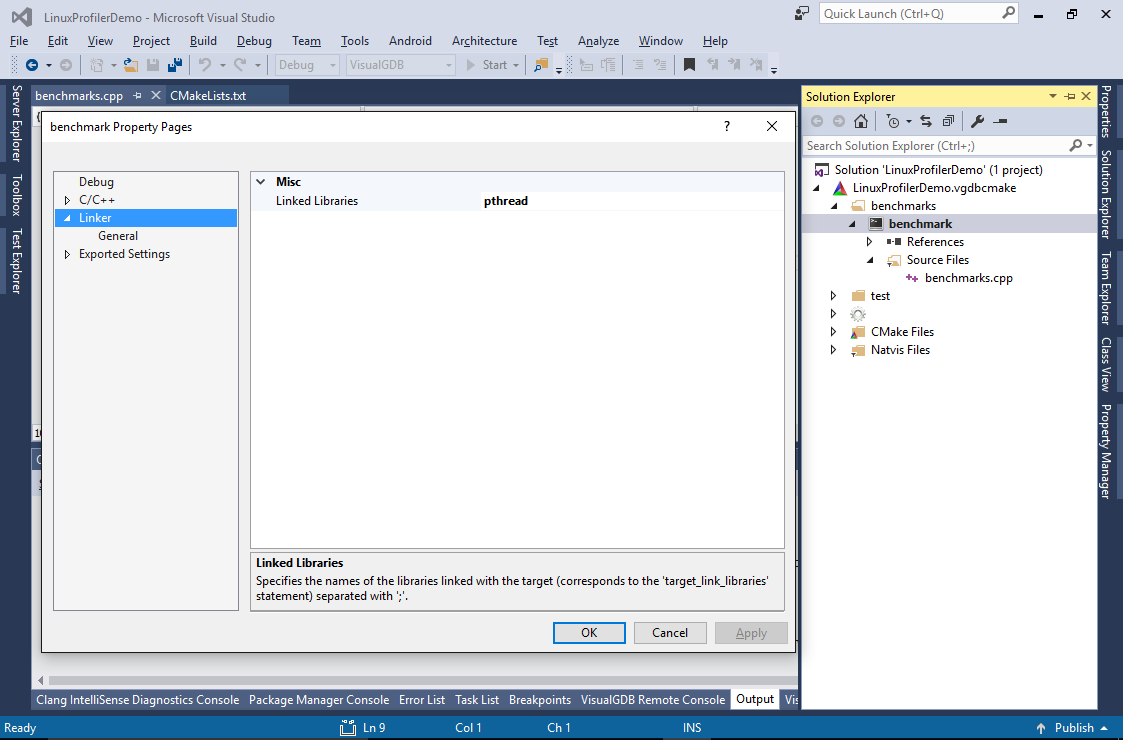
- Add “pthread” to the linked library names:
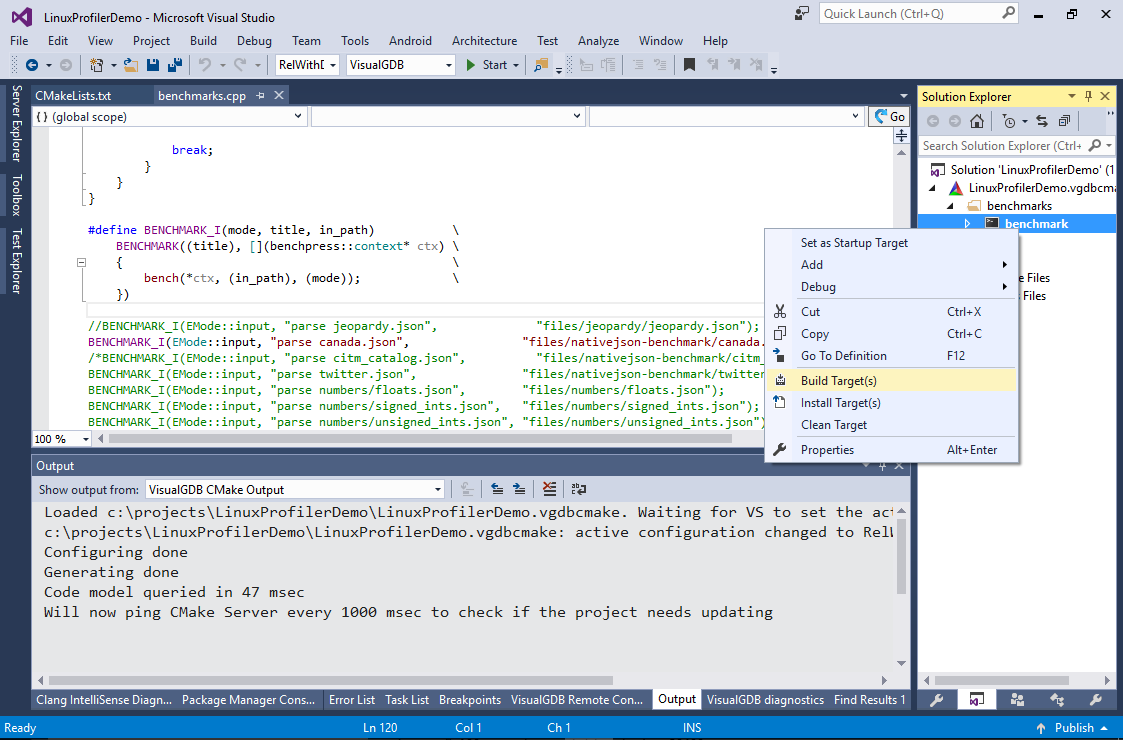
- To make profiling faster, we will comment out all benchmarks except “parse canada.json” and focus on optimizing the parser for this set. Build the target by selecting “Build Target(s)” in Solution Explorer:
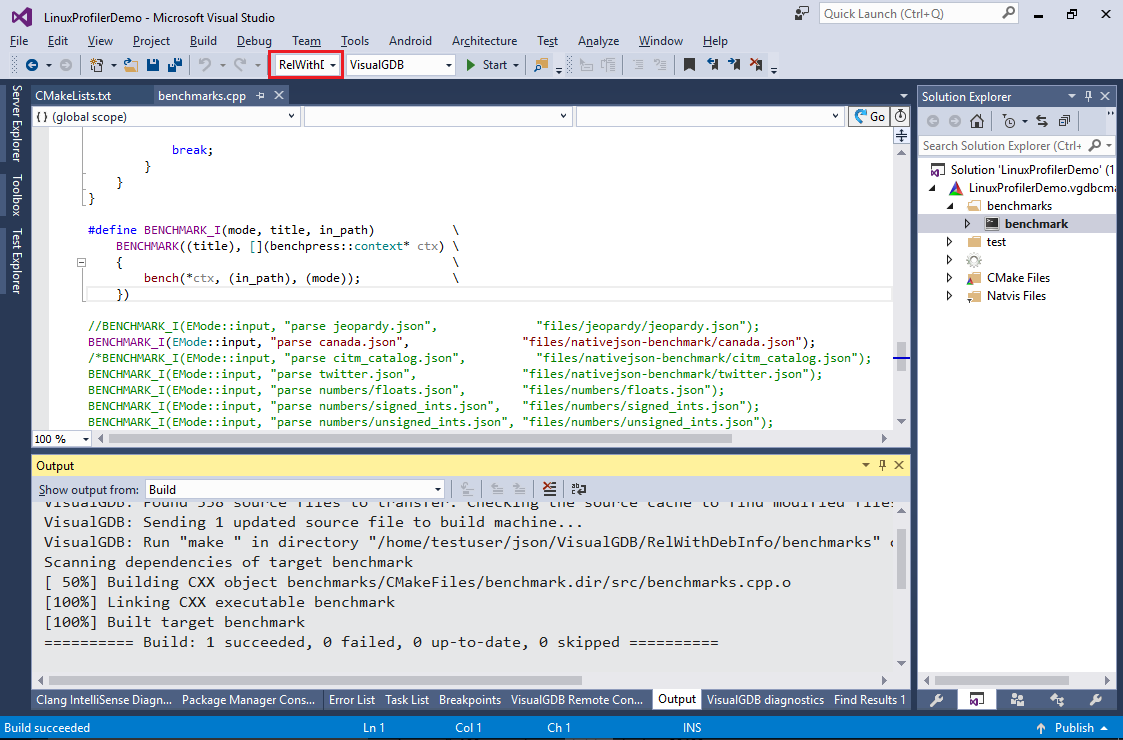
- Ensure you have the RelWithDebInfo configuration selected. The regular Release configuration doesn’t generate debug symbols, so VisualGDB won’t be able to highlight performance of individual code lines:
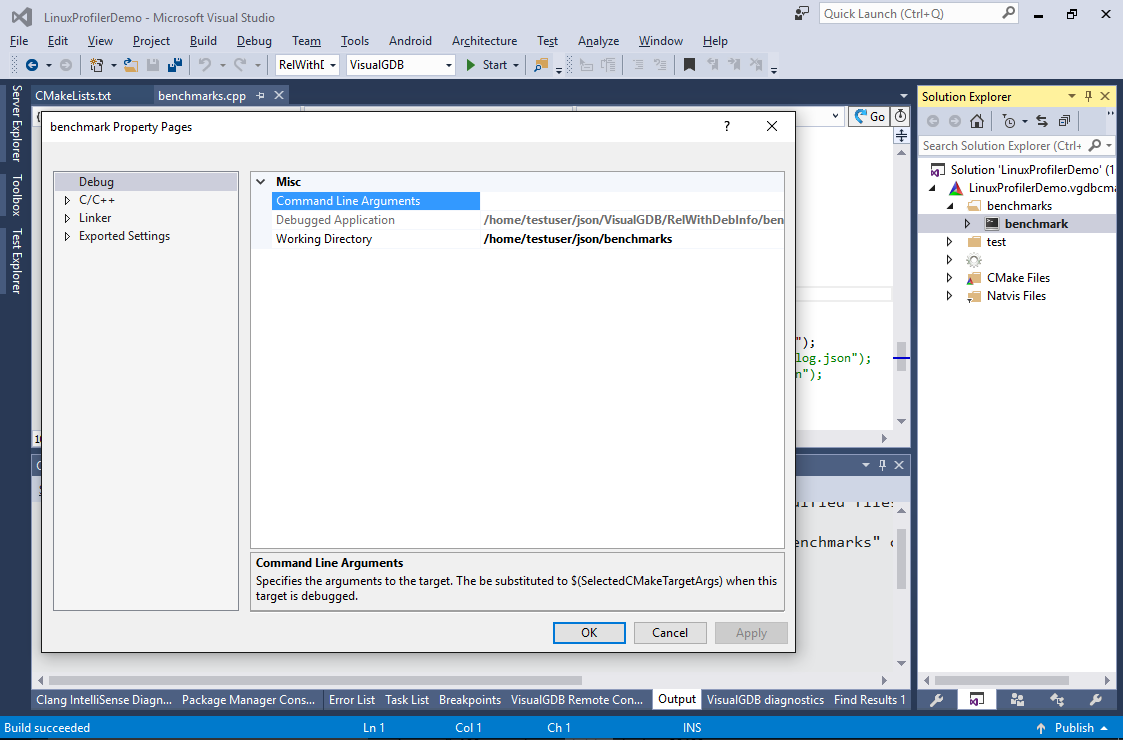
- Open Debug Properties for the target and set the working directory to the “benchmarks” subdirectory:
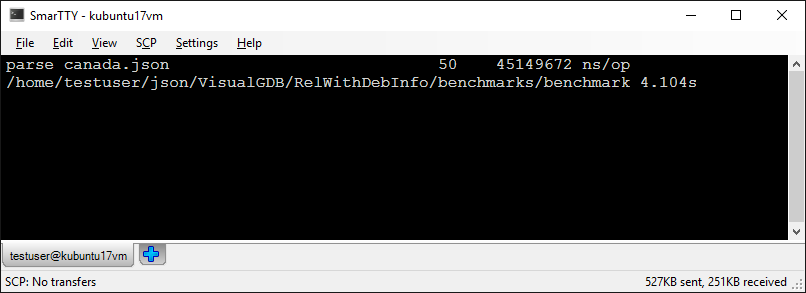
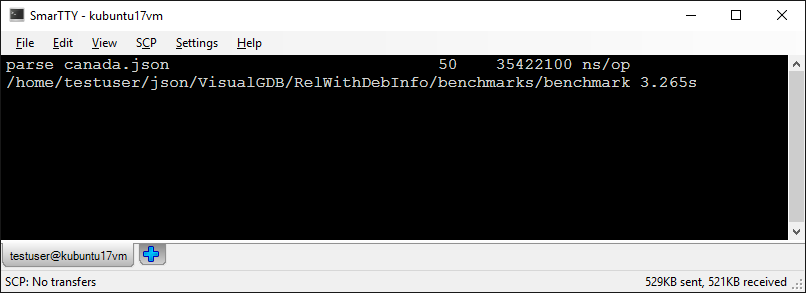
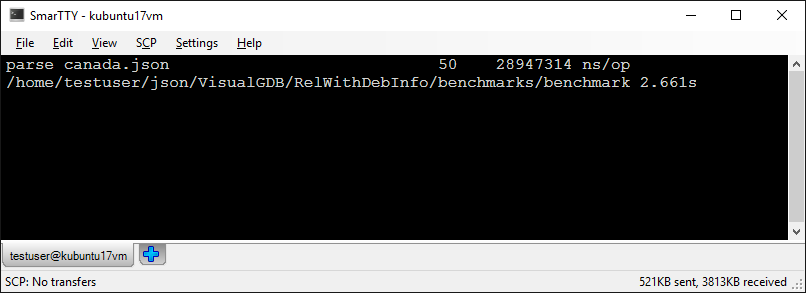
- Run the program without debugger by pressing Ctrl-F5 and take note of the parsing time:
- Now we will begin optimizing the program performance. Select Analyze->Analyze Performance with VisualGDB:
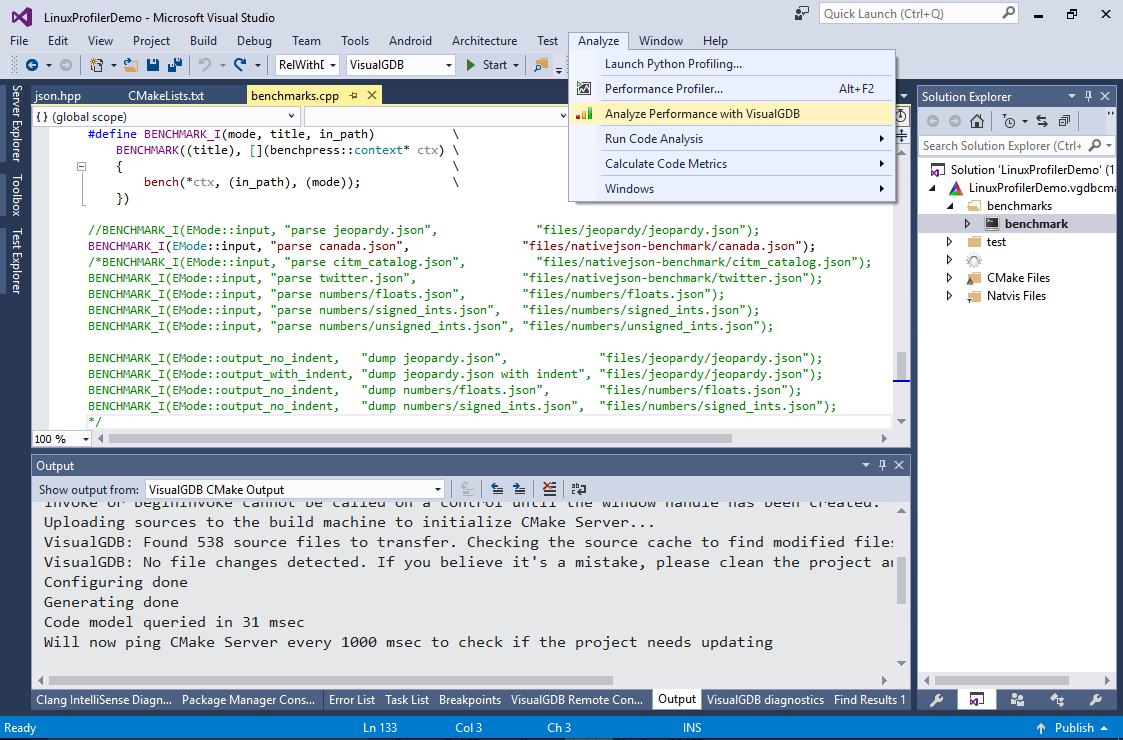 Ensure that the “benchmark” target is selected as the startup target, as VisualGDB always profiles the startup target.
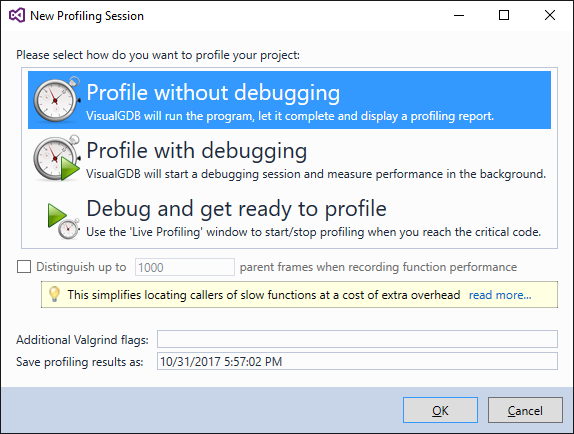
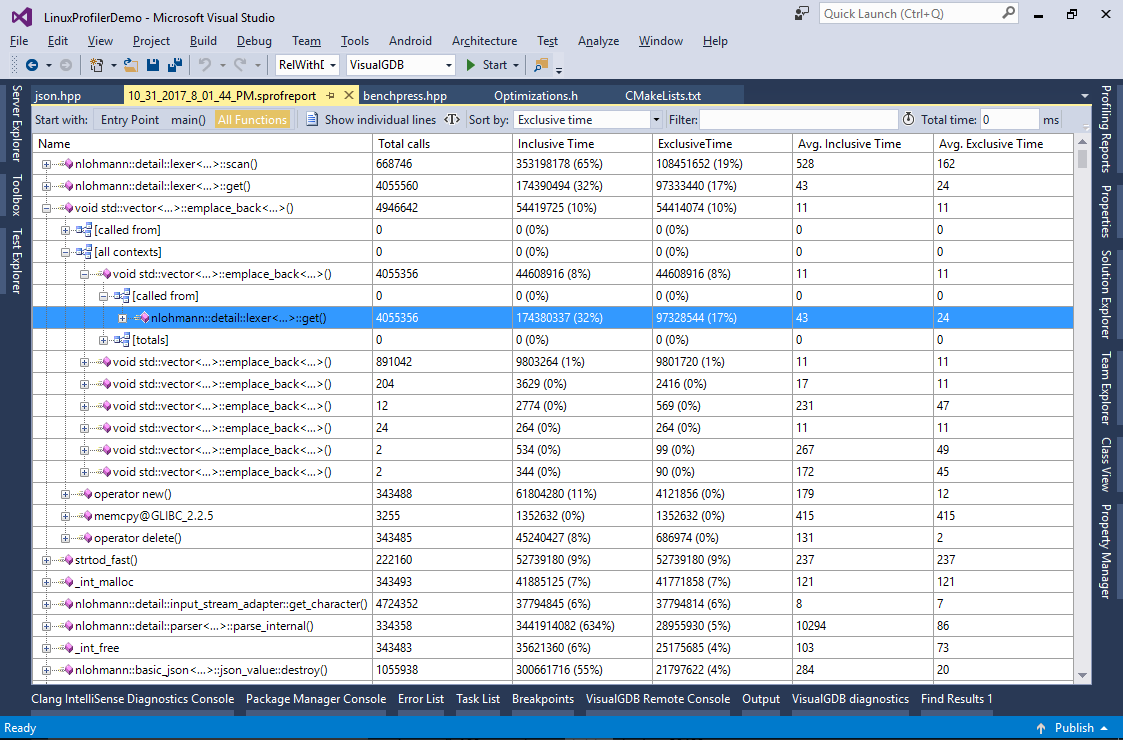
 - Select “Profile without debugging” and press “OK”:
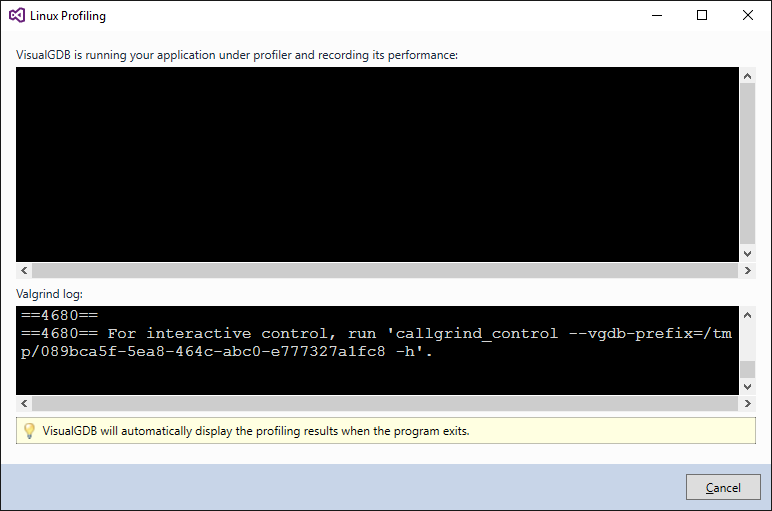
- VisualGDB will launch the benchmark under profiler and begin collecting performance data:
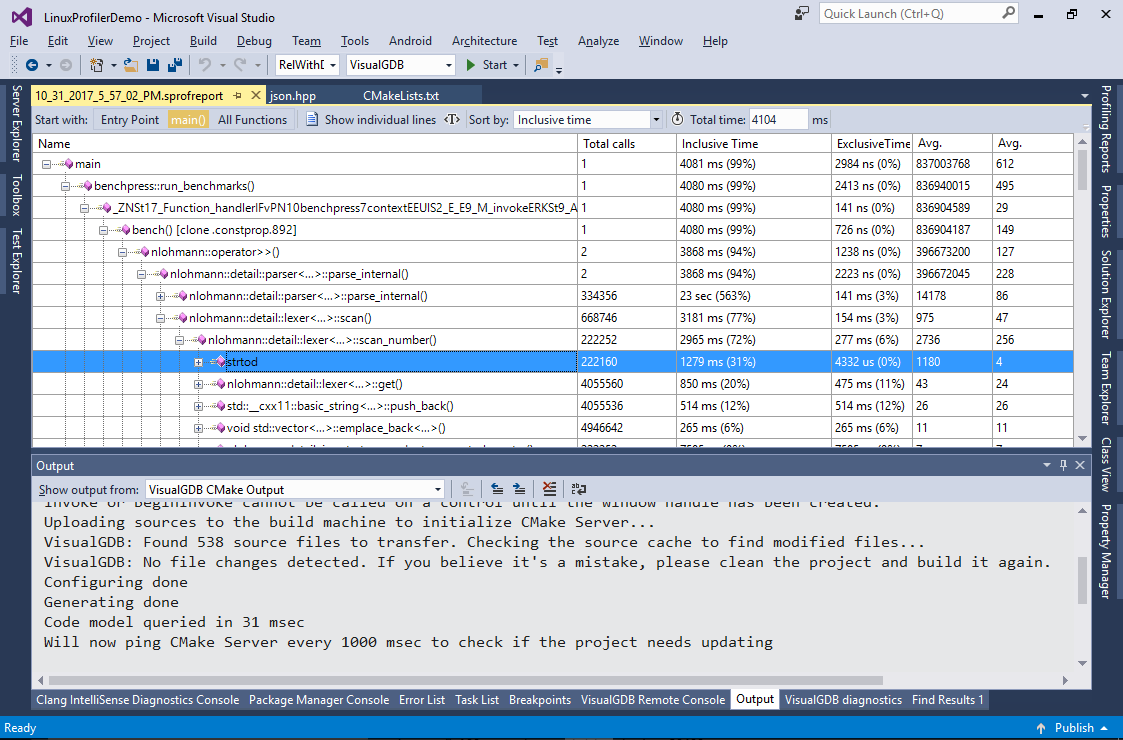
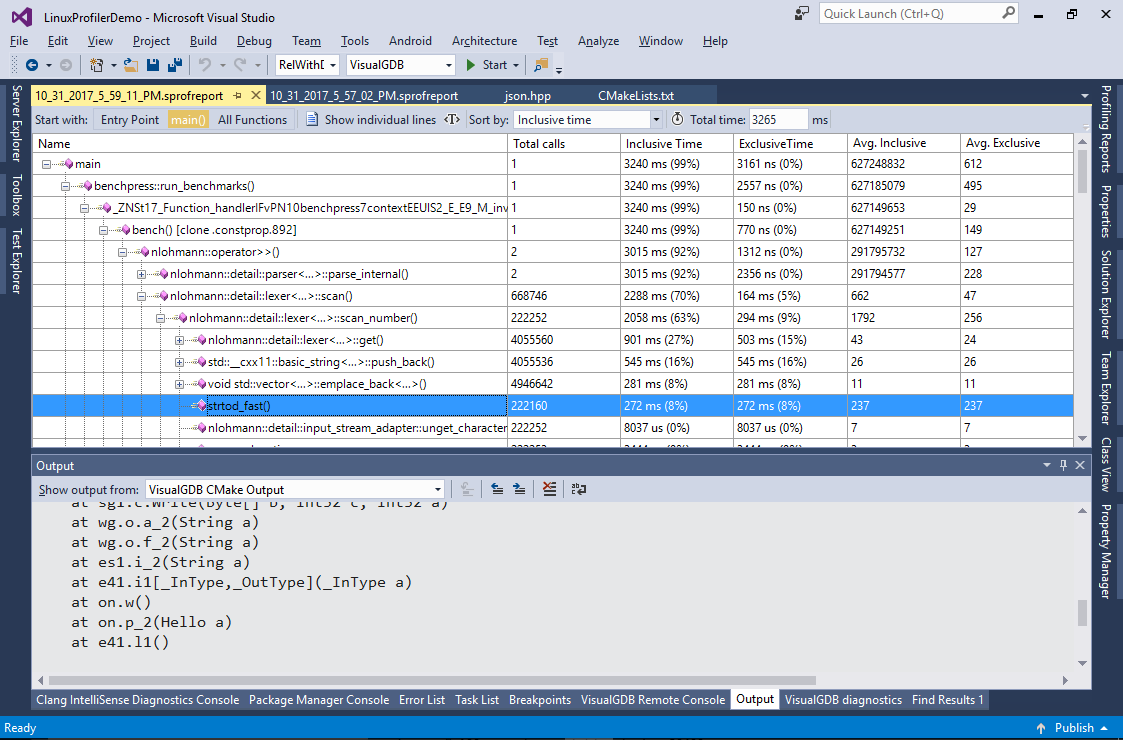
- Once the profiling is complete, VisualGDB will automatically display function call tree sorted by the inclusive time. Expand the critical path until you see the “strtod” function. The function is responsible for parsing string representations of the floating point numbers (e.g. “1.2345”):

- You can enter the total time observed without profiling in the “total time” field so that VisualGDB will try to estimate how much time each function would take under normal circumstances (without profiler). Note that this estimate is not 100% accurate as VisualGDB (and valgrind) counts CPU instructions that don’t always translate 1-to-1 to CPU cycles:
- A quick research shows that the strtod() function is indeed relatively slow as it handles the advanced ‘E’ syntax. We will address this by replacing it with a simpler implementation handling normal cases that will fall back to calling strtod() if it encounters the ‘e’ character (the implementation is based on this one). Create a file called “Optimizations.h” with the following contents:
#pragma once
#include <sys/types.h>
#include <string>
#include <vector>

double strtod_fast(const char *start, char **end)
{
    const char *p = start;
    double r = 0.0;
    bool neg = false;
    if (*p == '-') {
        neg = true;
        ++p;
    }

    while (*p >= '0' && *p <= '9') {
        r = (r * 10.0) + (*p - '0');
        ++p;
    }
    if (*p == '.') {
        double f = 0.0;
        double coef = 1.0;
        ++p;
        while (*p >= '0' && *p <= '9') {
            f = (f * 10.0) + (*p - '0');
            ++p;
            coef /= 10.0;
        }
        r += f * coef;
    }
    if (neg) {
        r = -r;
    }

    if ((*p | 0x20) == 'e')
        return strtod(start, end);

    if (end)
        *end = const_cast<char *>(p);
    return r;
}
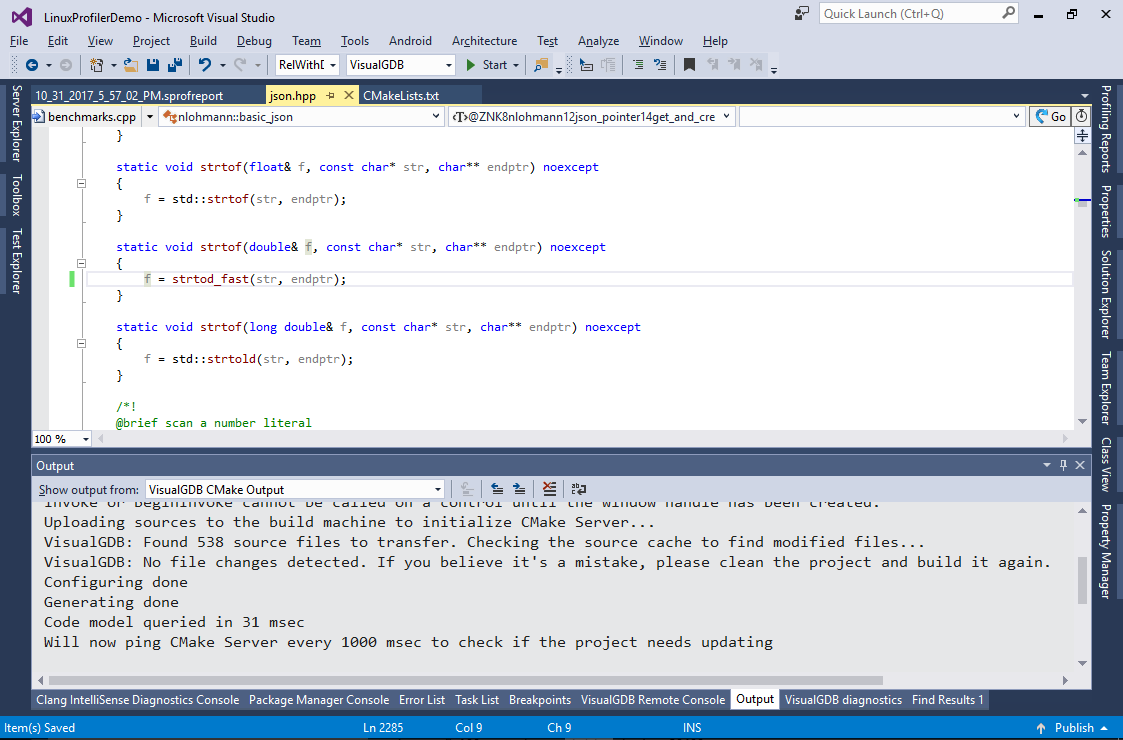
- Include the file from json.hpp and replace the call to std::strtod() with a call to strtod_fast():
- Build the program and run it without debugging. See how the execution time got ~20% faster:
- Doing another profiling session will quickly reveal that strtod_fast() is indeed much faster than strtod() and now takes only 8% of the total program run time:
- You can double-click on the function in the report and then click “annotate lines” to highlight performance of each individual line:
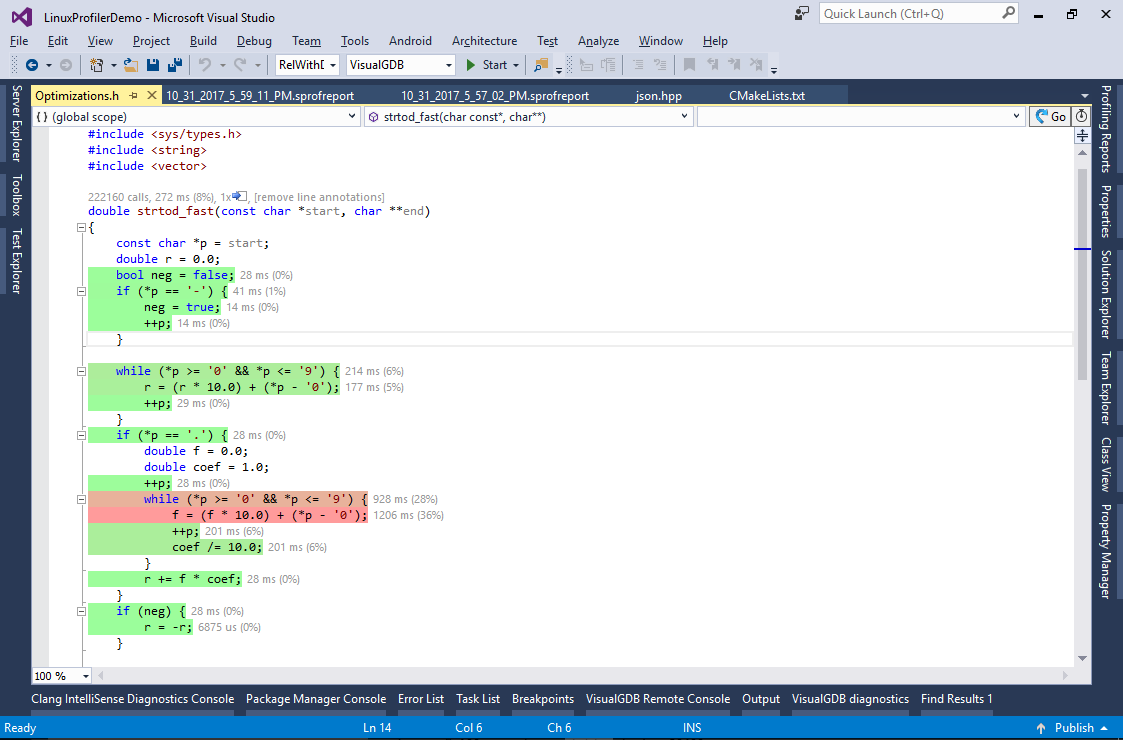 See how most of the time is spent parsing digits after the decimal point. If we wanted to optimize this function further, we could use a lookup table to handle 2 characters at once or try first converting all digits to an integral value and then dividing it in on FP operation.
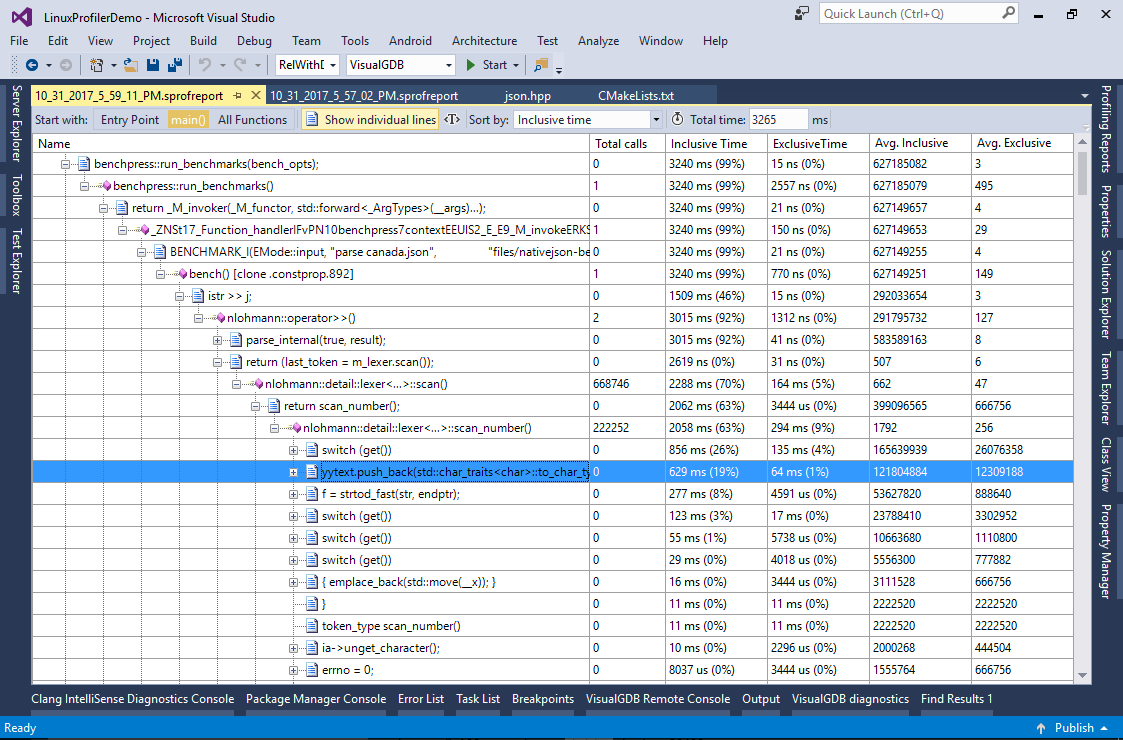
 - Now we will show a few more optimizations. Enable the “show individual lines” switch and navigate to the “scan_number()” method. See that the “yytext.push_back()” line is now taking almost 20% of the entire program run time:
- Double-click on the line to open the corresponding source code. Note how yytext is defined as a string:
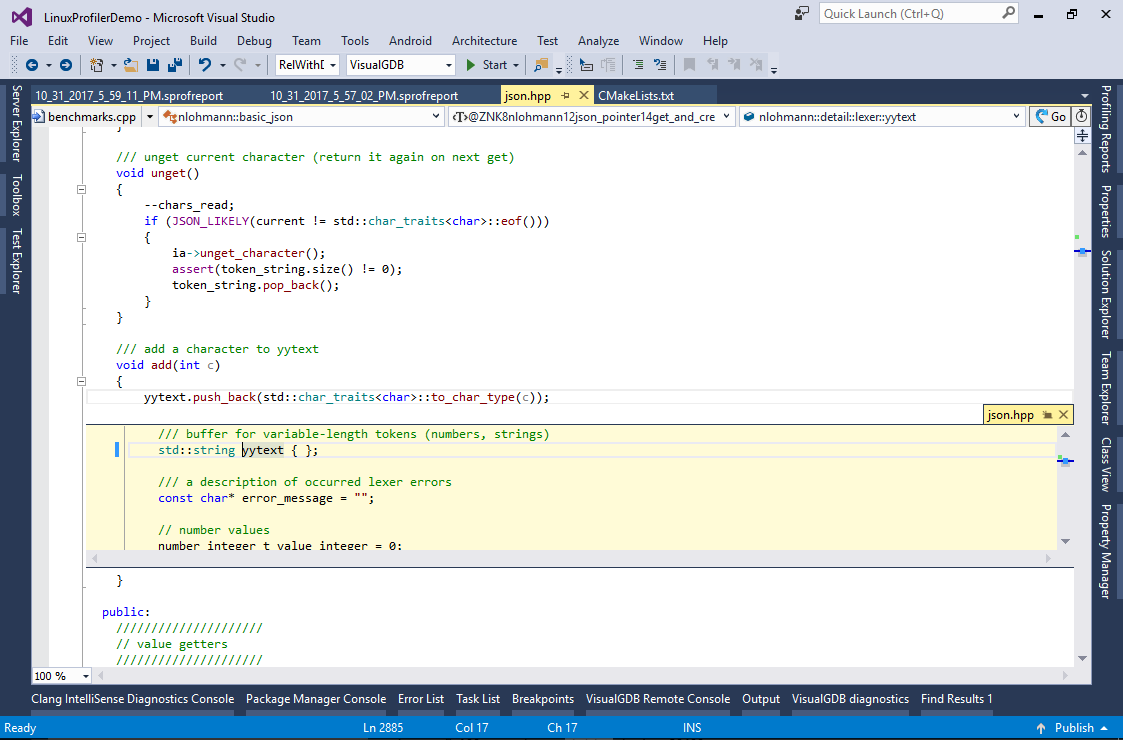
- As appending a character to it is considerably slowing down our program, we can replace it with a custom container optimized for quick appending characters one-by-one:
- The custom container will not be null-terminated until its contents is explicitly requested
- It will initially allocate a large chunk of data for the string to avoid reallocating it when appending characters
Add the following code to Optimizations.h:
class FastAppendableString
{
protected:
    char *m_pData;
    mutable char *m_pEnd;
    char *m_pEndOfAlloc;
    mutable bool m_NullTerminated = false;

    void DoAppendChar(char ch)
    {
        if (m_pEnd >= m_pEndOfAlloc)
            asm("int3");
        *m_pEnd++ = ch;
    }

    void EnsureRawForm() const
    {
        if (m_NullTerminated)
        {
            m_pEnd--;
            m_NullTerminated = false;
        }
    }

public:
    FastAppendableString()
    {
        m_pData = (char *)malloc(4096);
        m_pEnd = m_pData;
        m_pEndOfAlloc = m_pData + 4096;
    }

    ~FastAppendableString()
    {
        free(m_pData);
    }

    FastAppendableString(const FastAppendableString &) = delete;
    void operator=(const FastAppendableString &) = delete;

    const char *data()
    {
        if (!m_NullTerminated)
        {
            DoAppendChar(0);
            m_NullTerminated = true;
        }
        return m_pData;
    }

    const size_t size()
    {
        if (m_NullTerminated)
            return m_pEnd - m_pData - 1;
        else
            return m_pEnd - m_pData;
    }

    void clear()
    {
        m_pEnd = m_pData;
        m_NullTerminated = false;
    }

    void push_back(char ch)
    {
        EnsureRawForm();
        DoAppendChar(ch);
    }

    operator std::string()
    {
        return data();
    }
};
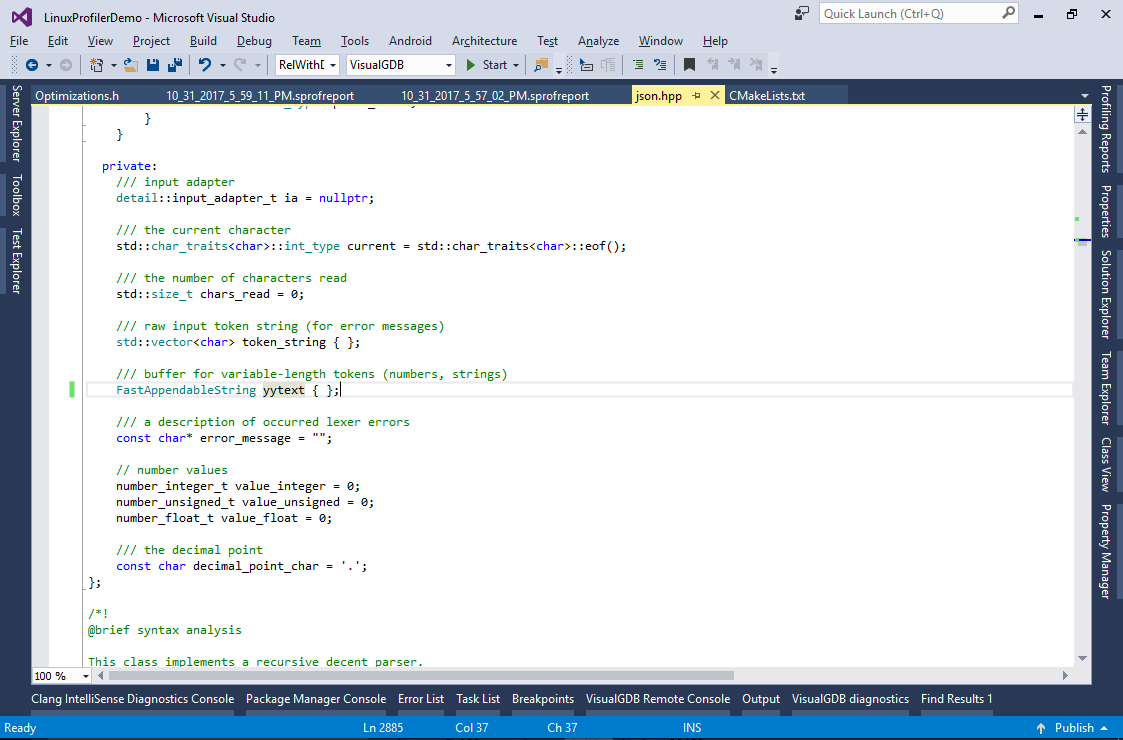
Then replace the declaration of yytext to use the new custom container type:
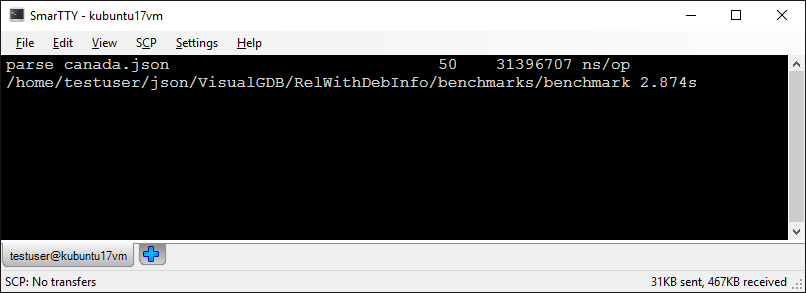
- Run the program again and see another 12% increase in the performance:
 Note that we have intentionally left the reallocation case unimplemented (it will trigger a breakpoint via the “int3” instruction). Adding code to reallocate the buffer will slightly reduce the performance as it will force the GCC to save the registers modified by realloc() before checking whether a call to realloc() is needed. This could be resolved by making a non-inlineable function saving all CPU registers on entry and calling it via inline assembly.
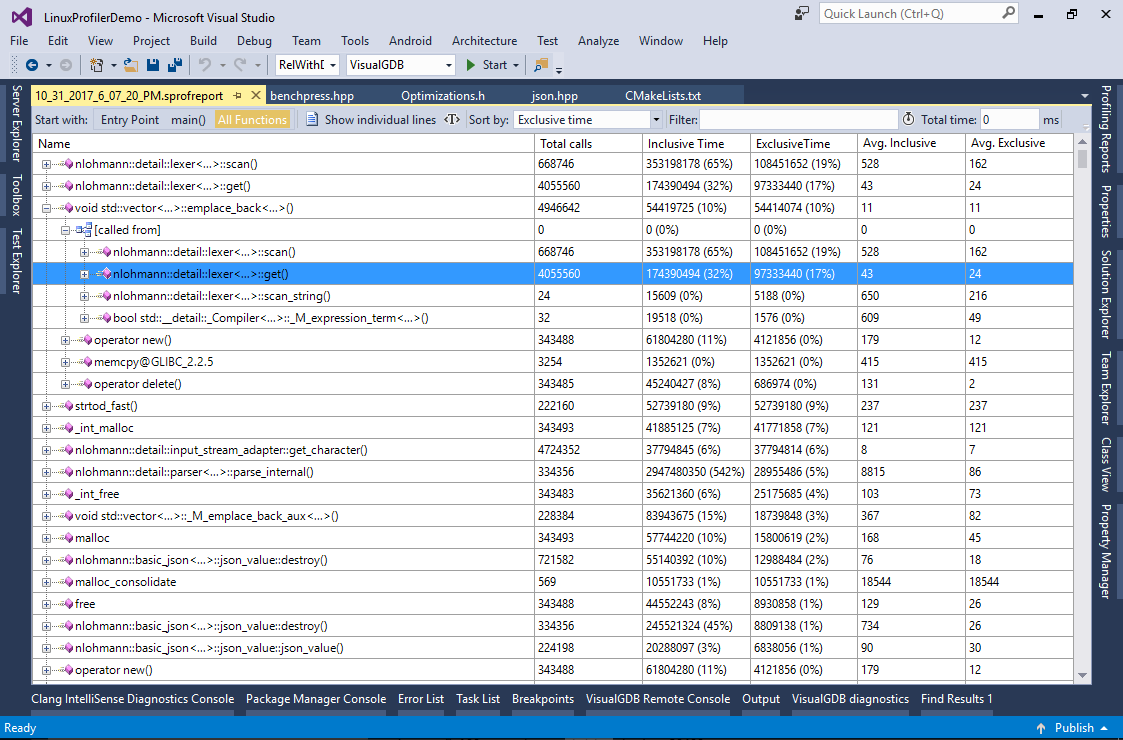
 - The JSON parser example shown in this tutorial contains another relatively easy optimization opportunity. Switch to the “All functions” view and sort the functions by exclusive time. See how the emplace_back() method is taking 10% of the time. It is called from 4 different locations and Valgrind normally doesn’t distinguish which of them contributes the most to the execution time:
- To easily distinguish between different invocation paths of emplace_back(), run another profiling session enabling the “distinguish up to 1000 parent frames” option:
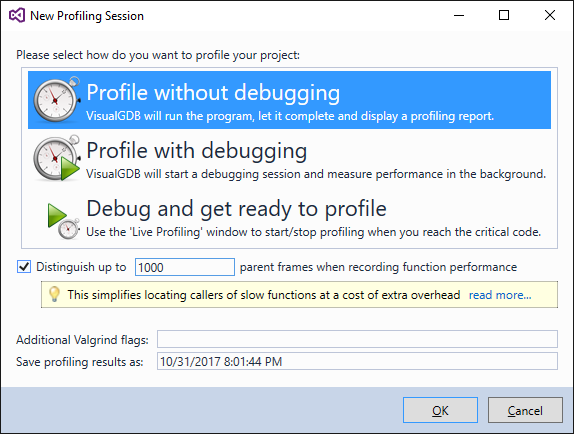
- Now you can expand the [all contexts] node and see that 8% of the total program runtime is spent on the emplace_back() call from lexer::get():
- This scenario is similar to the previous one (slow character-by-character appending):
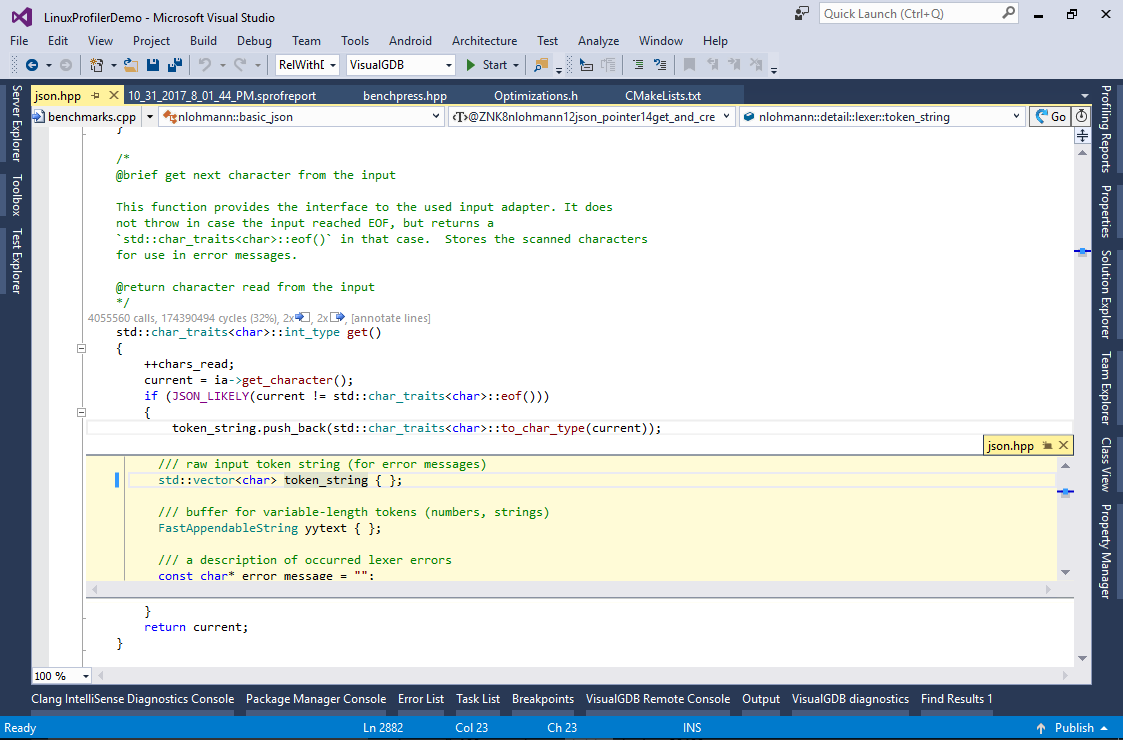
- Add another optimized container to Optimizations.h and edit token_string to use it:
class FastAppendableString2 : public FastAppendableString
{
public:
    void pop_back()
    {
        EnsureRawForm();
        if (m_pEnd >= m_pData)
            m_pEnd--;
    }

    const char *begin() const
    {
        EnsureRawForm();
        return m_pData;
    }

    const char *end() const
    {
        return m_pEnd;
    }
};
- Run the program again. See how we have reduced the runtime by another 7.5% (35% down from the original version):
 Note that profiling helps you optimize the program for a specific scenario. E.g. one of 3 optimizations in this tutorial relied on heavy use of floating-point numbers in the dataset and would not give much improvement for data sets containing mostly integral numbers and strings. Remember to always use real data sets (or proportionally scaled down subsets) when you profile your code to get the best final results.