Profiling Advanced mbed-based Projects with VisualGDB
This tutorial shows how to use the VisualGDB’s instrumenting profiler and Real-time Watch to analyze the performance of mbed-based projects. We will create a default “Blinking LED” project using the mbed framework, link it with VisualGDB’s profiler framework and show how to obtain the execution times of various functions and see detailed thread timing diagrams.
Before you begin, install VisualGDB 5.5 or later.
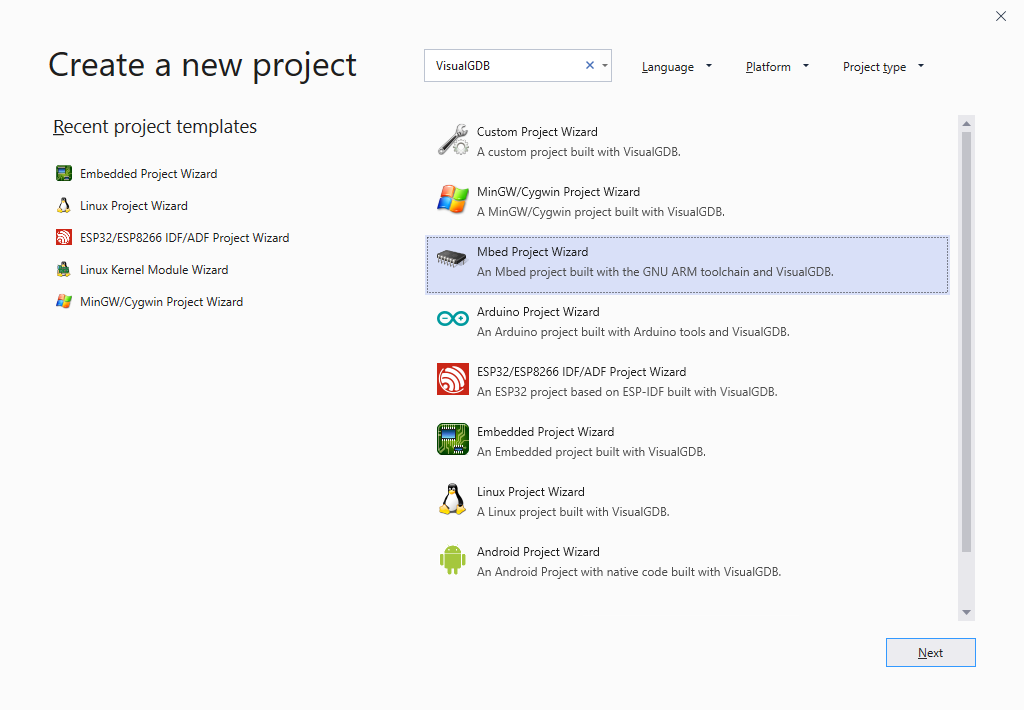
- Start Visual Studio and select the VisualGDB Mbed Project Wizard:
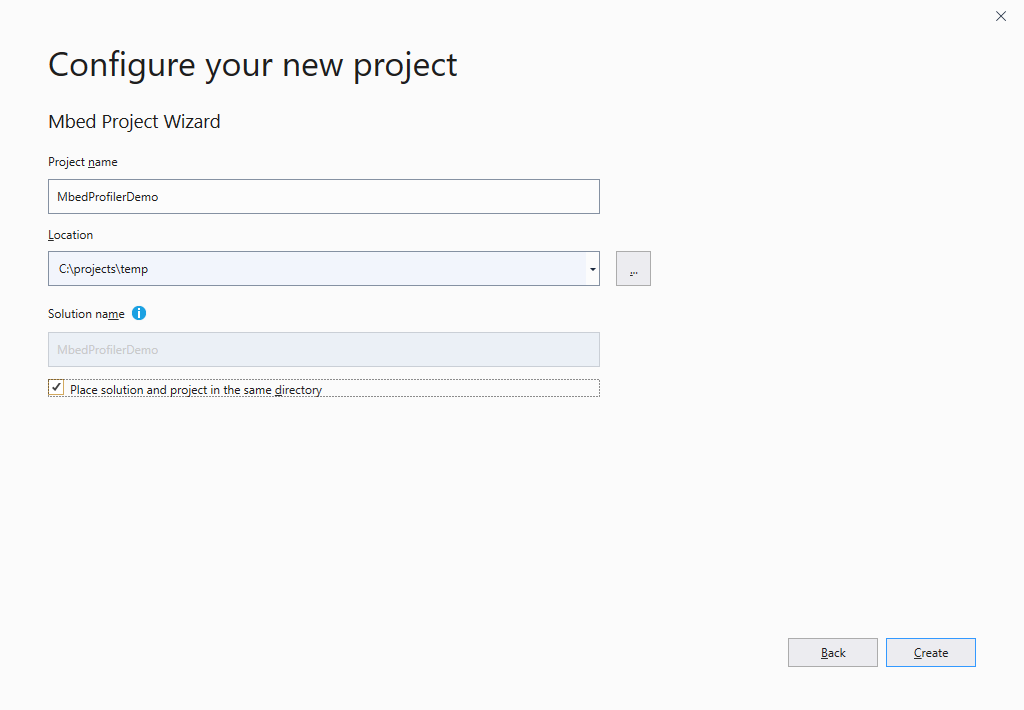
- Enter the name and location for your project and click “Create” to launch the VisualGDB’s portion of the wizard:
- On the first page specify how do you want to reference the mbed framework. VisualGDB can either clone the entire mbed repository under the project directory, or check it out in a separate folder and reuse that checkout between multiple projects:

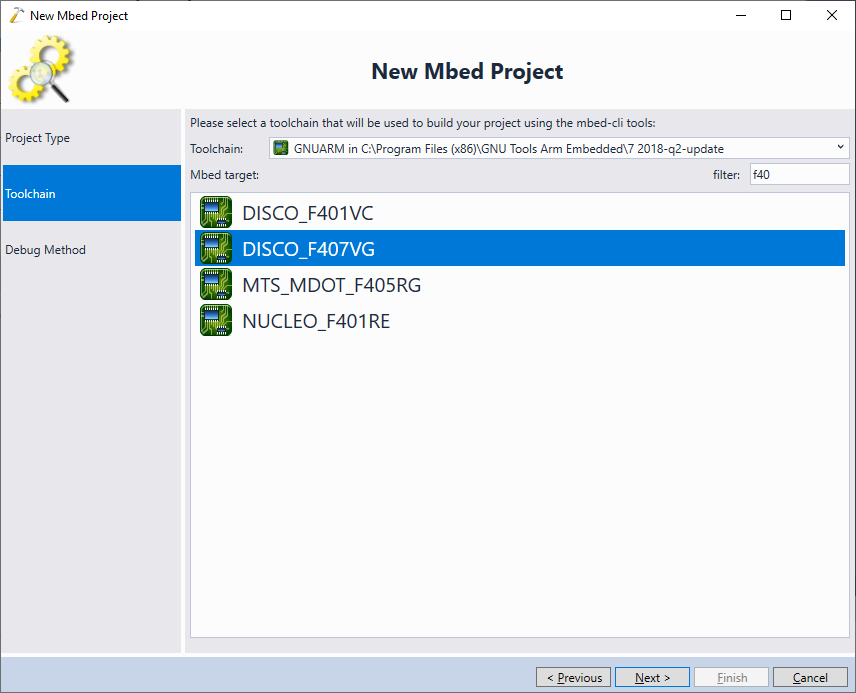
- On the next page select your primary target and click “Next”:
- Finally, connect your debugger to the USB port and let VisualGDB detect it, or alternatively specify the debugging settings manually:
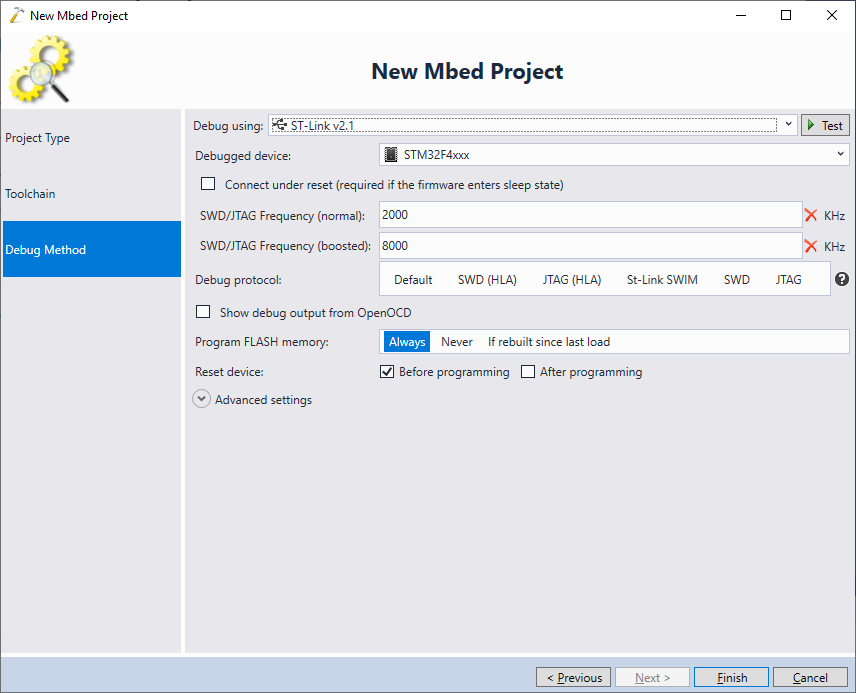 Once you have selected the debugging settings, press “Finish” to create the project.
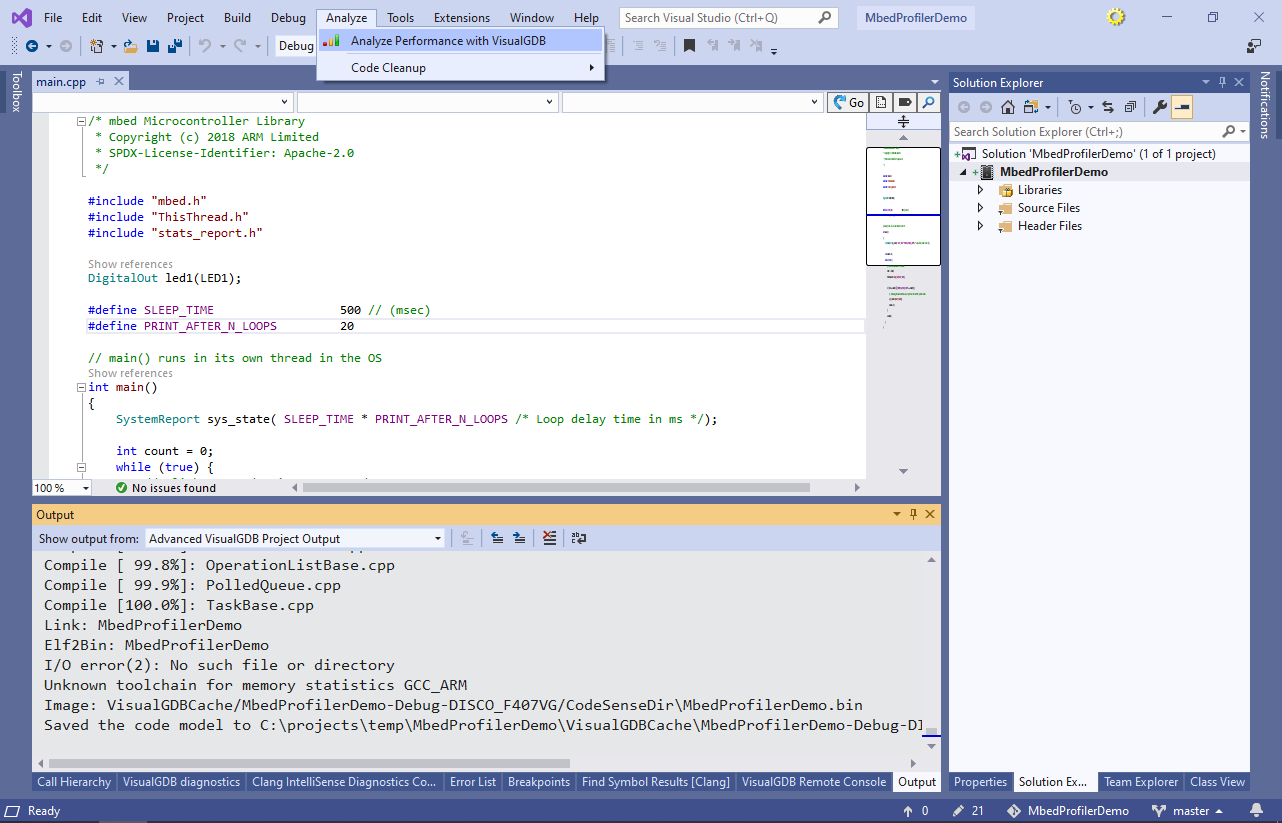
 - Before you can start profiling the project, it needs to reference the VisualGDB’s profiler framework. You can do this automatically by selecting Analyze->Analyze Performance with VisualGDB:
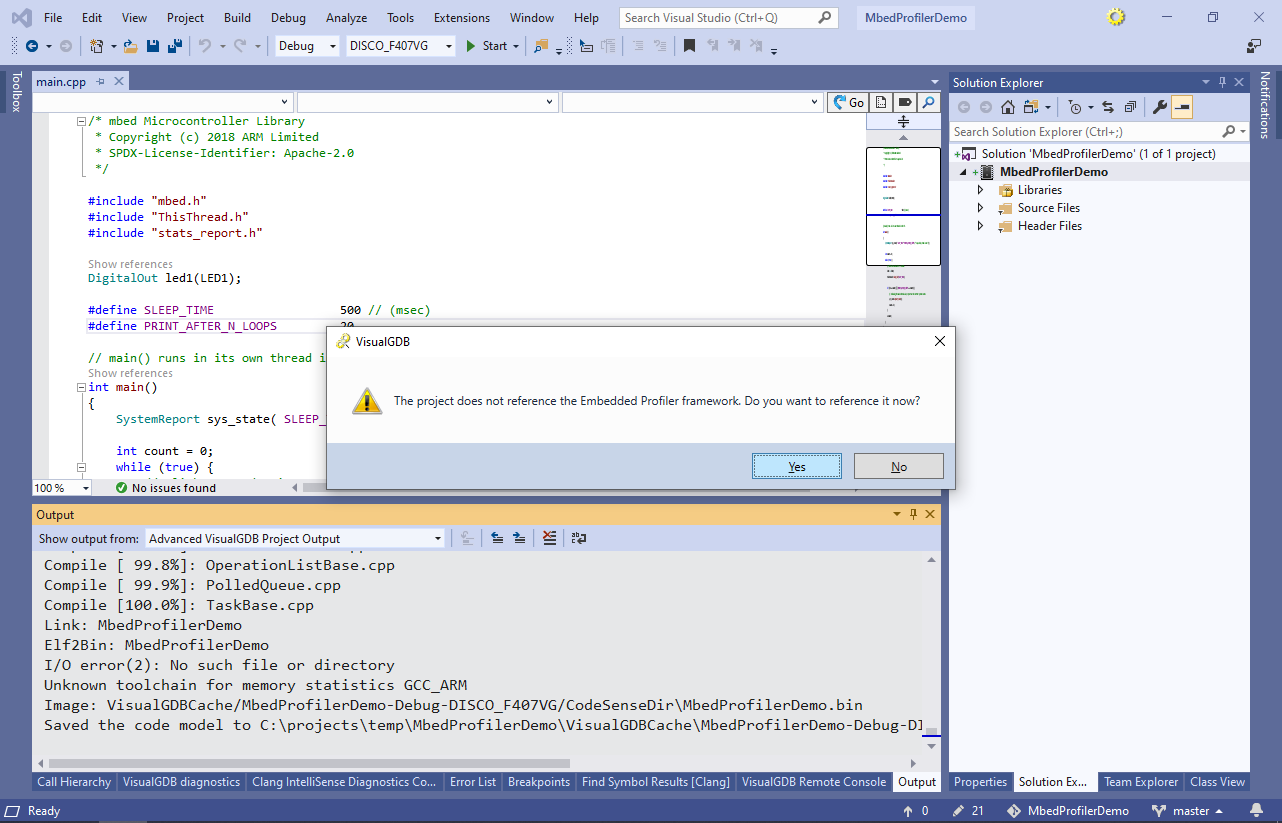
- Answer “Yes” once VisualGDB suggests referencing the framework:
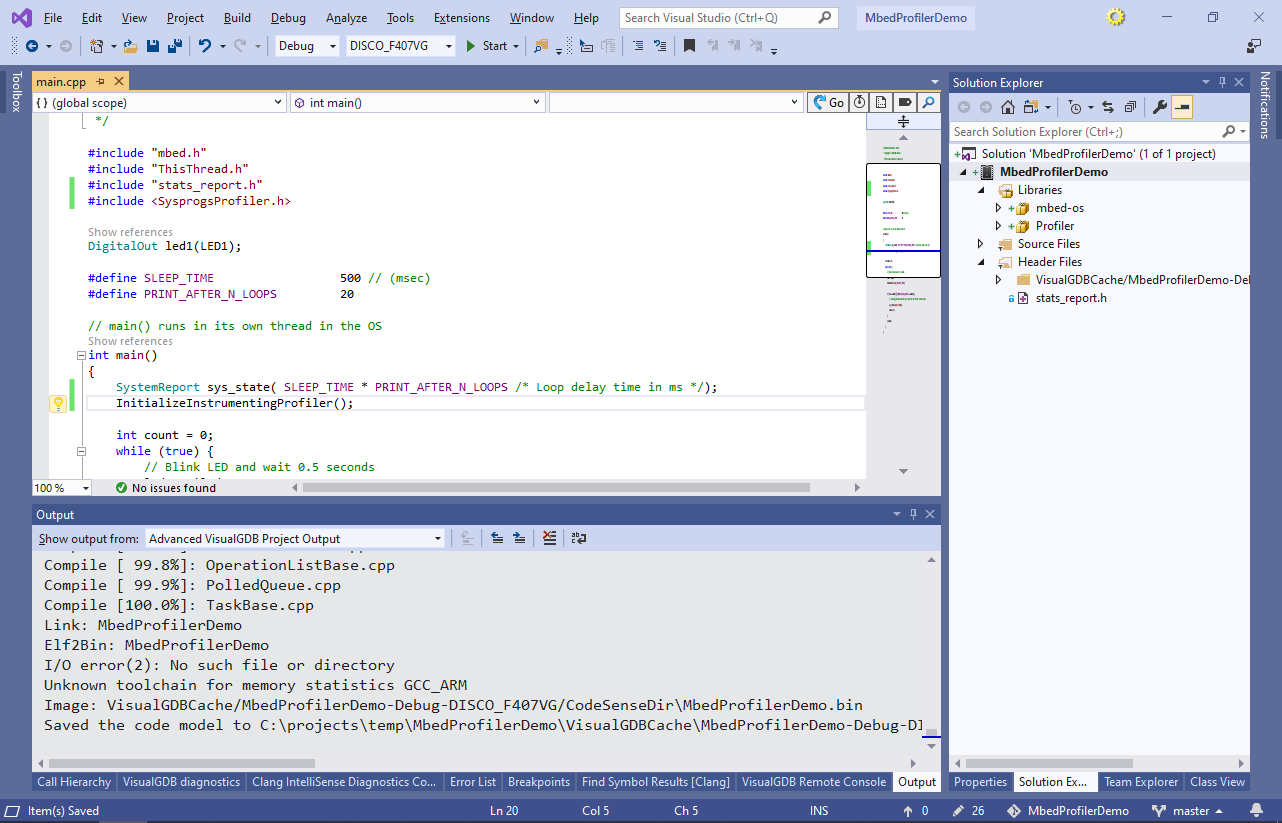
- Include the <SysprogsProfiler.h> file from your main source file and call the InitializeInstrumentingProfiler() function from main():
 Note that when you run the regular debug sessions, the profiler framework will be compiled in, but disabled, not affecting the execution time of your code. VisualGDB will automatically instrument the executable and activate the profiling logic only when you start a profiling session, or enable dynamic analysis features that depend on the framework.
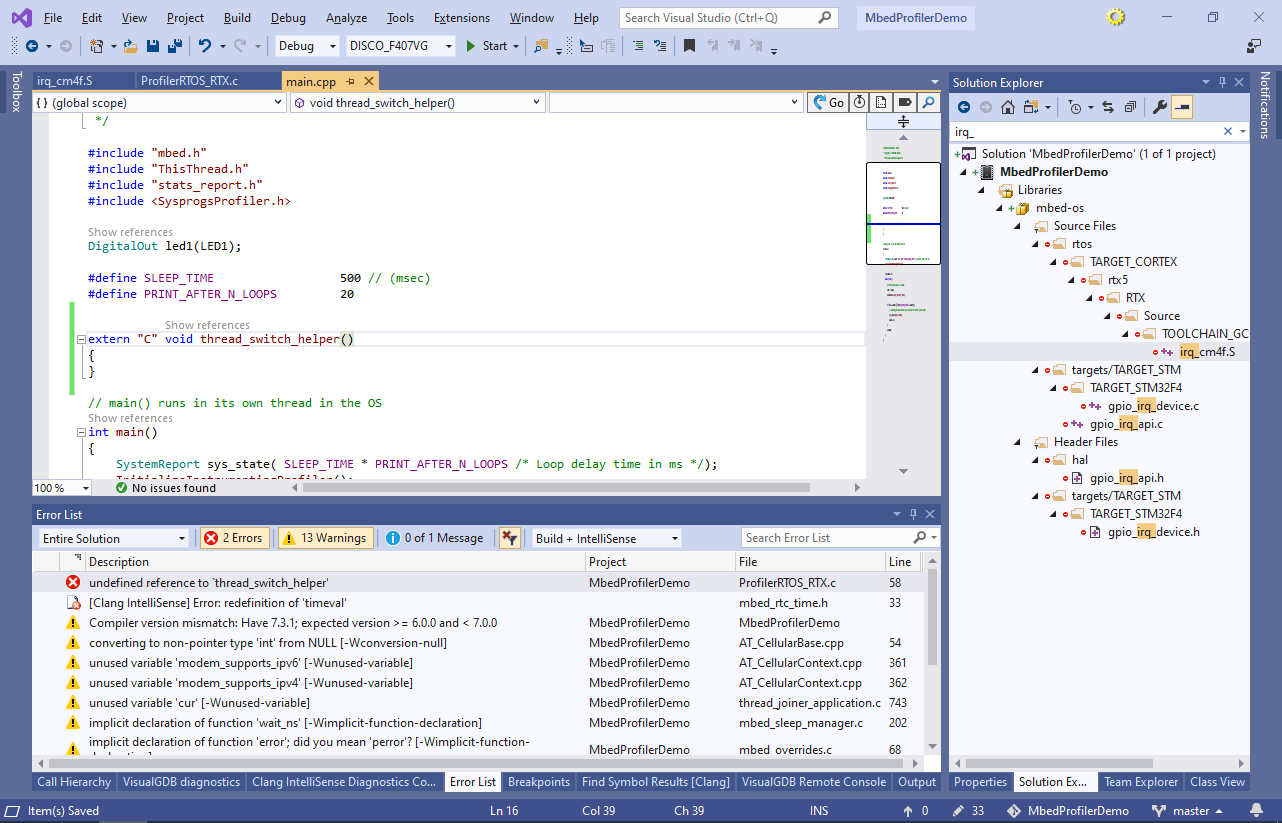
 - Try building the project. Depending on your mbed version, you may get an error due to a missing thread_switch_helper() function:
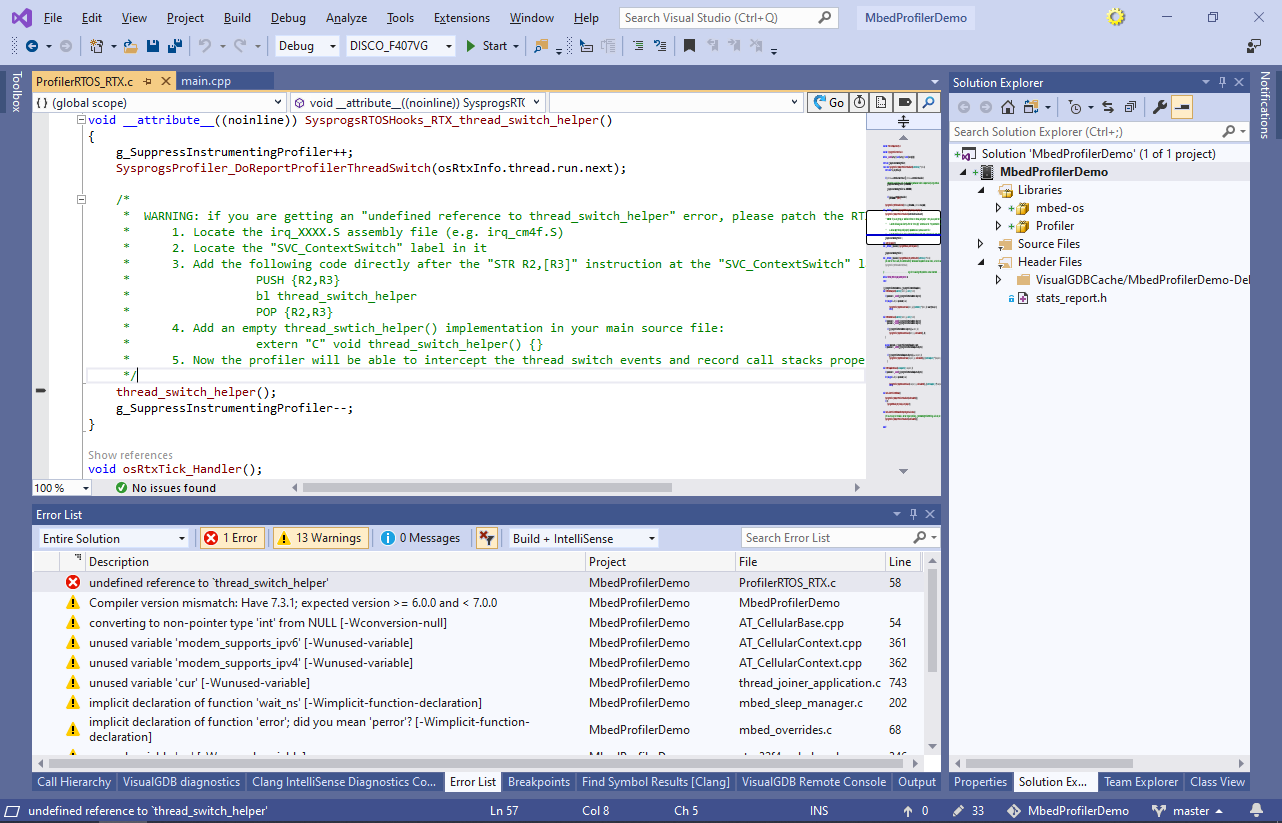
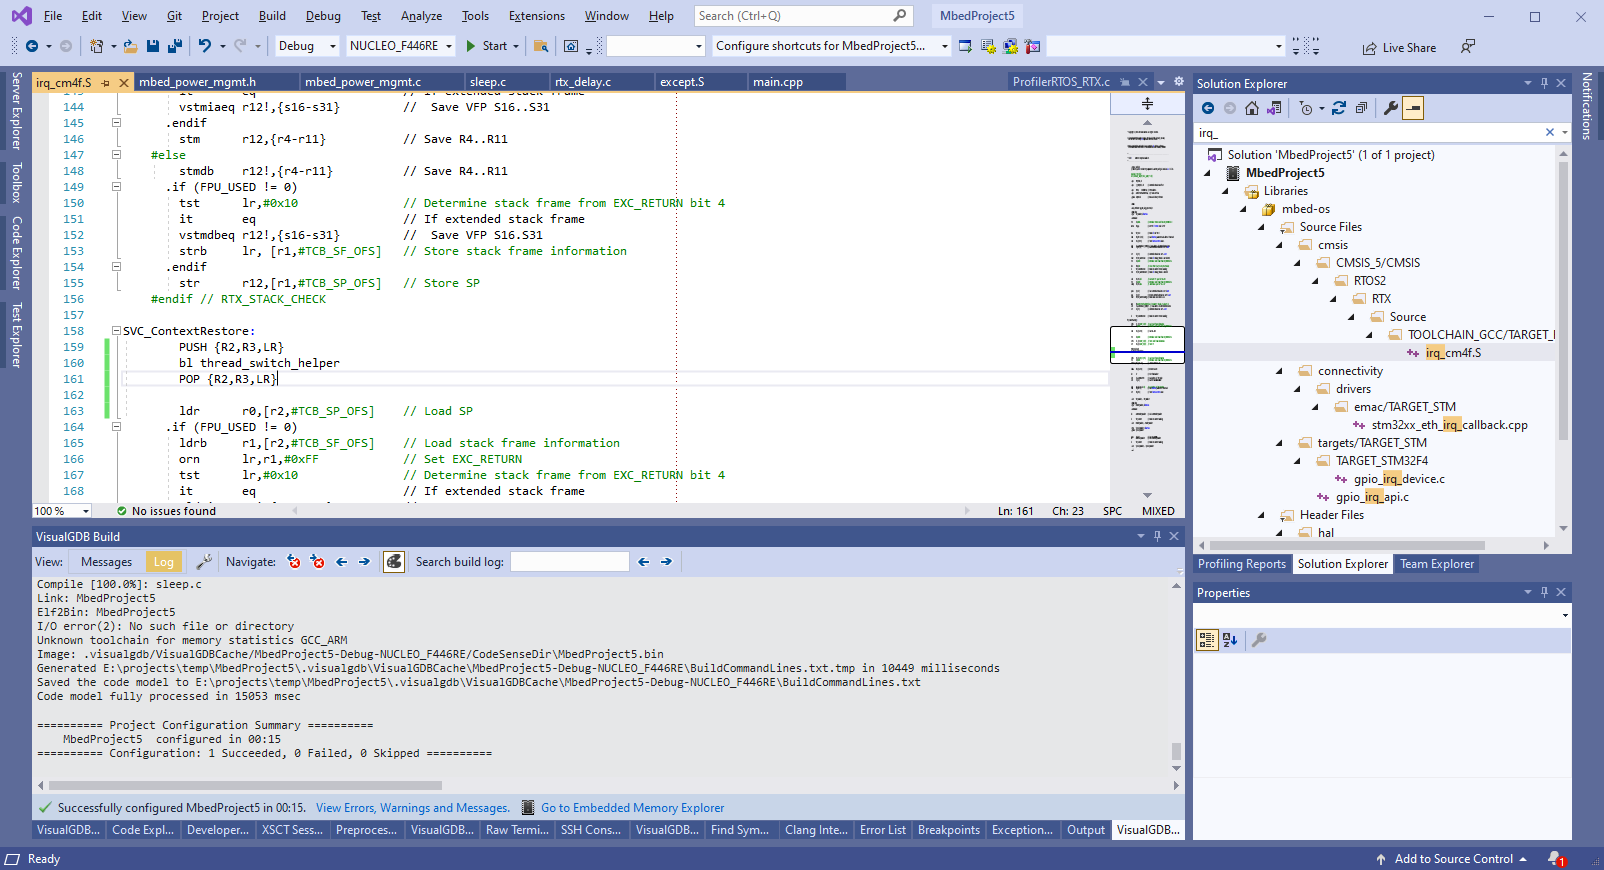
- If this happens, you would need to patch the RTX thread switching function used by mbed so that it calls a small function each time a thread is switched. Locate the irq_XXXX.S file in Solution Explorer (e.g. irq_cm4f.S), find the SVC_ContextRestore label and add the following lines right after it:
PUSH {R2,R3,LR}
bl thread_switch_helper
POP {R2,R3,LR}
The screenshot below shows the patched SVC_ContextRestore function on mbed 6.16:
- Add an empty thread_switch_helper() function in your main file:
extern "C" void thread_switch_helper()
{
}
 During normal debug sessions, this will not have any noticeable effect on the performance (calling one function that immediately returns right after an interrupt or a thread switch won’t have much performance impact), however when you start a profiling session, VisualGDB will automatically hook the call to thread_switch_helper(), allowing the profiler framework to distinguish between multiple RTX threads and tracking their call stacks independently.
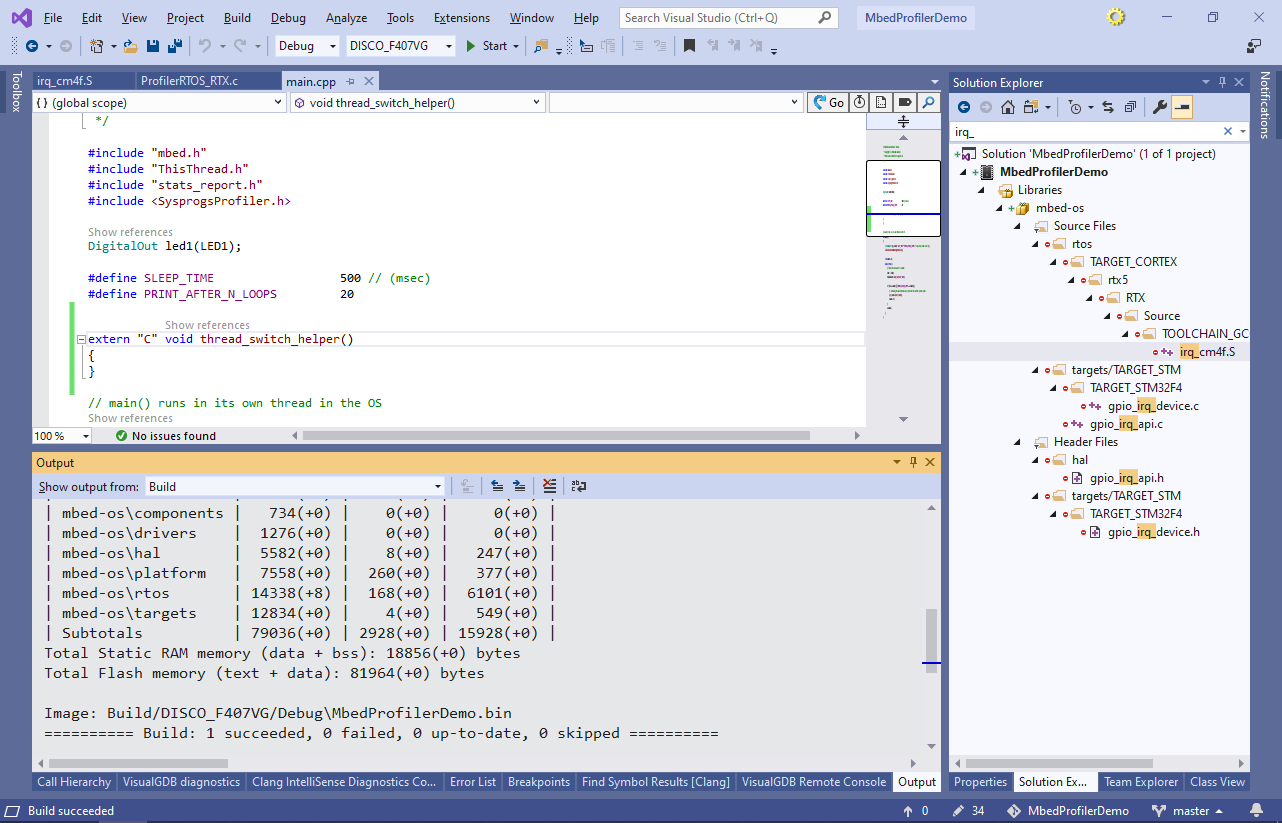
 - Build the project again and ensure it succeeds now:
- Now you can start profiling the program. Select Analyze->Analyze Performance with VisualGDB again and pick “Instrument functions to record their time“. VisualGDB will warn about the missing relocation records required to perform the instrumentation. Click “Enable relocation record generation” and build the project again:

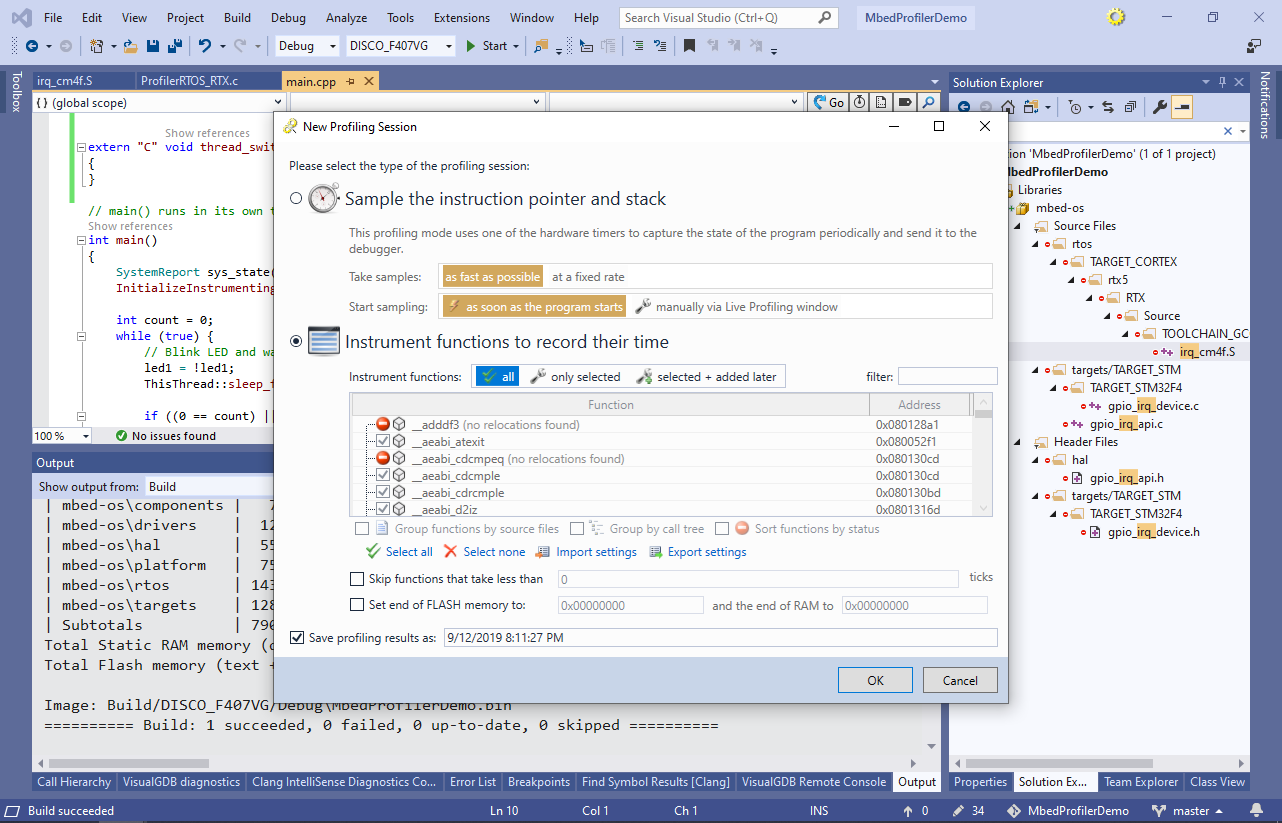
- Now you will be able to select the functions to instrument. VisualGDB will automatically exclude special symbols that would interfere with the profiling, so you can proceed with the default option of instrumenting everything, or pick a specific subset of functions if you want to minimize the performance impact (you can group the functions by the call tree or by source file to quickly enable/disable groups of them):
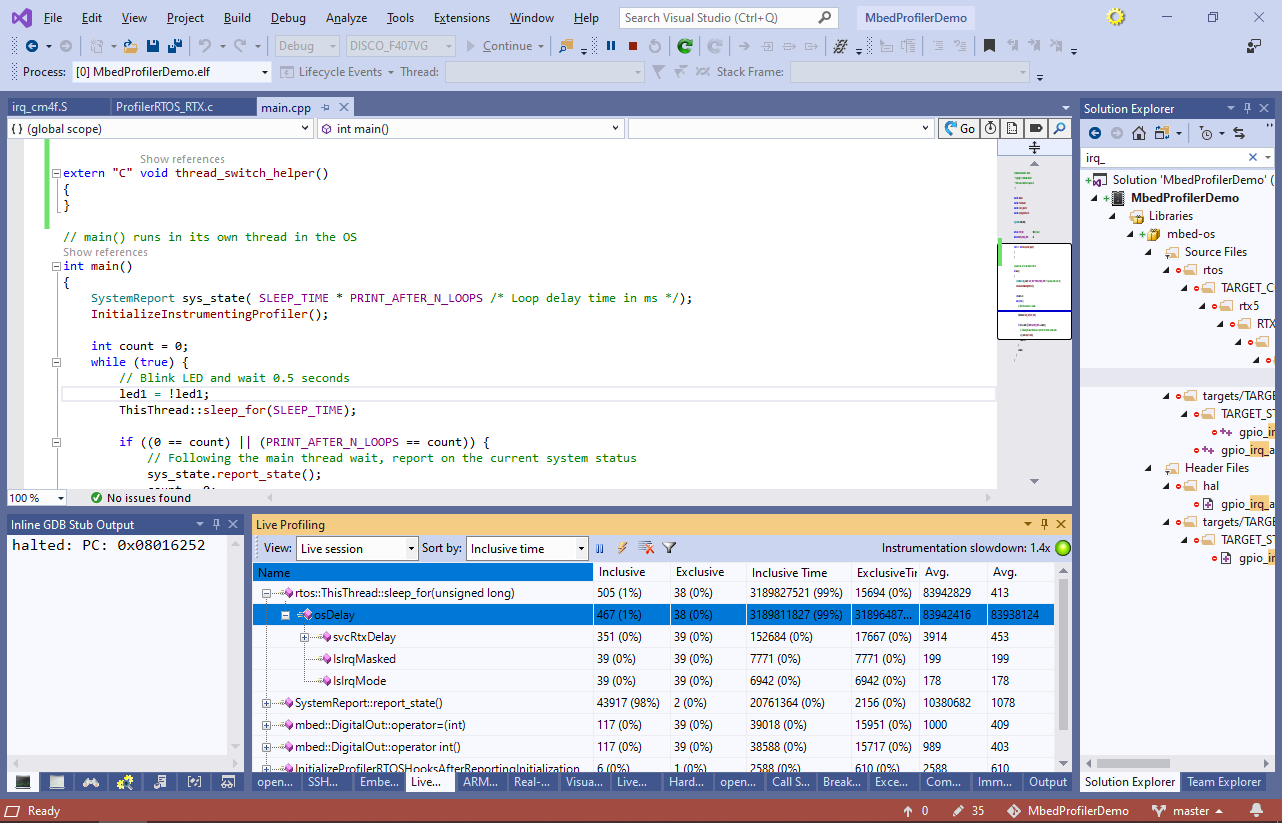
- Press “OK” to start a profiling session. The program will begin running and VisualGDB will display the real-time performance results in the Live Profiling window. In this example, it shows that most of the time is spent in rtos:ThisThread::sleep_for(), that in turn calls osDelay():
 Once you are done profiling, press Shift-F5 to end the debug session.
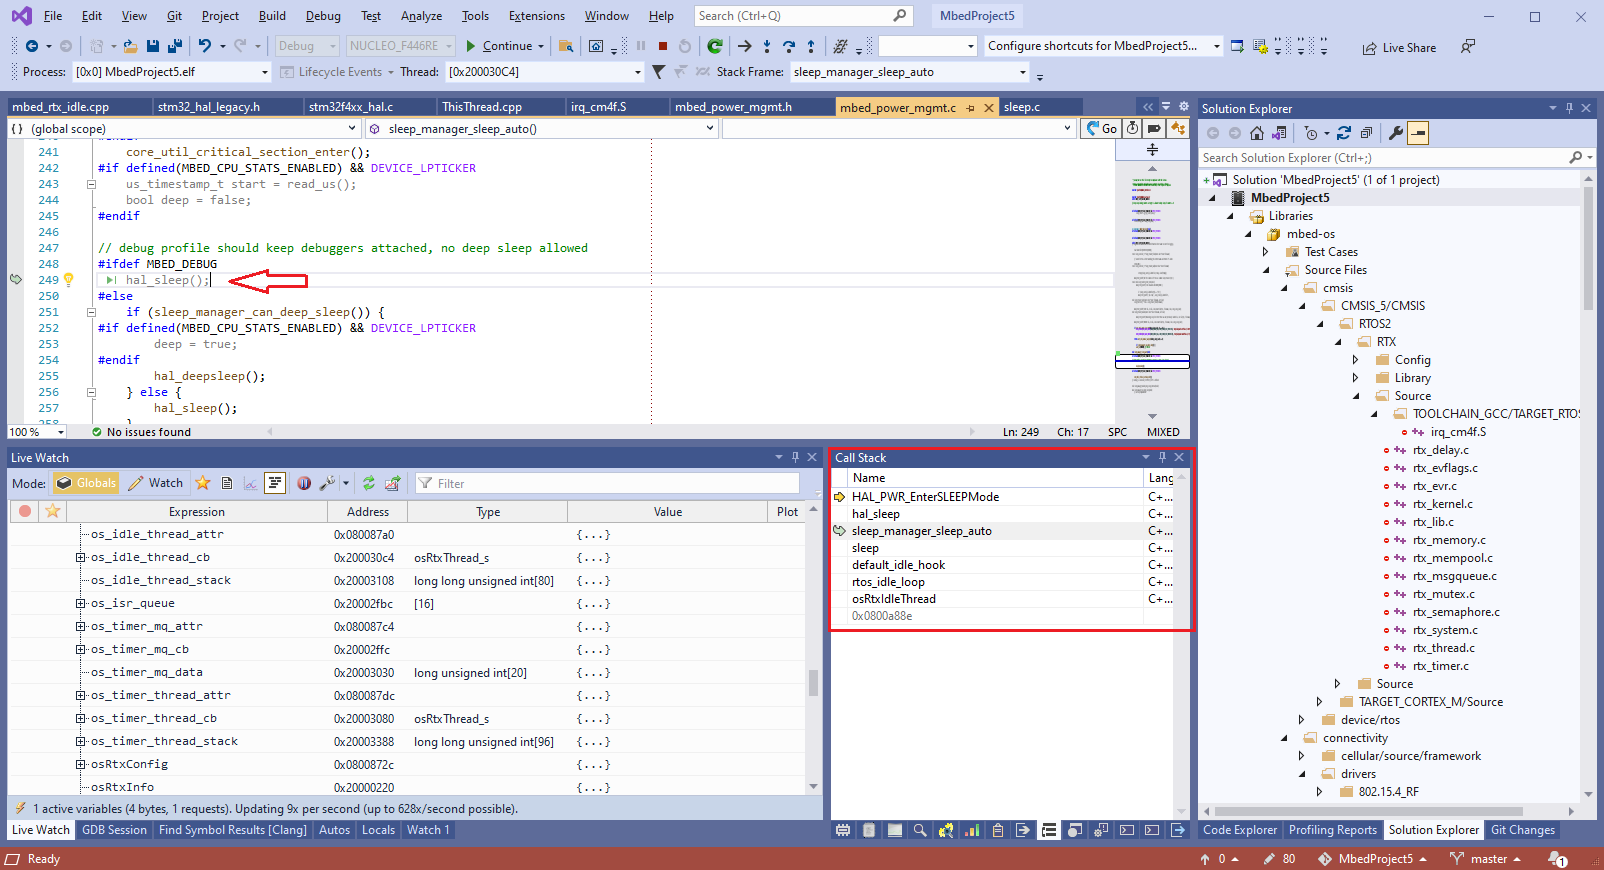
 - As of mbed 6.16, the device will normally enter the sleep mode when none of the regular tasks need to run. This may prevent VisualGDB from reading the profiling data (and Live Watch) from RAM until the device wakes up. If this happens, use the Debug->Break All command to stop the device, and locate the call to hal_sleep() in the call stack. Then, comment it out and build the project again:
 This will prevent the device from entering the sleep mode, so Live Watch and other background memory functionality will work.
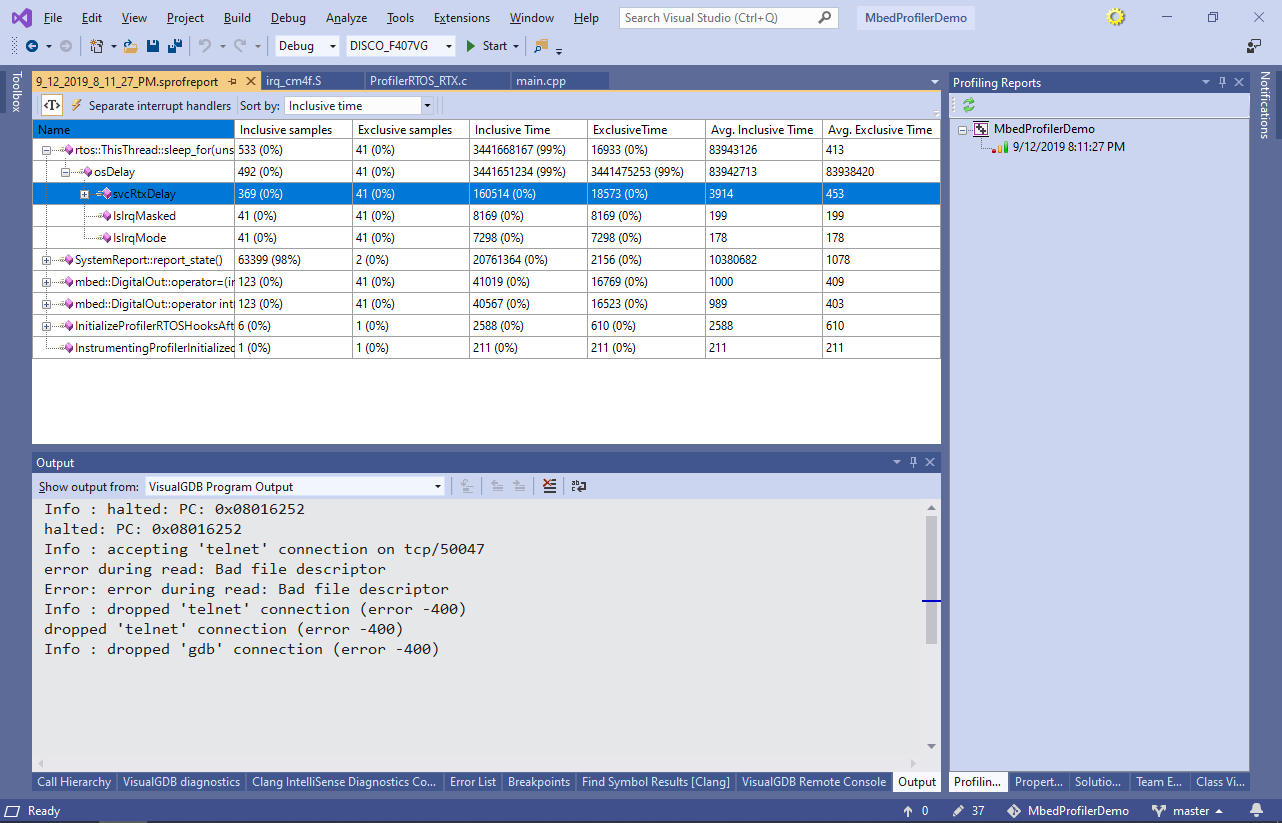
 - You can view the reports from the previous profiling sessions via View->Profiling Reports:

- This will show a detailed list of all functions, including the time spent in each function and the amount of time that function was called:
- Now we will show how to use Real-time watch to view the exact timing of RTX threads. Open VisualGDB Project Properties and go to the Dynamic Analysis page. Then enable tracing of RTOS events and function calls:

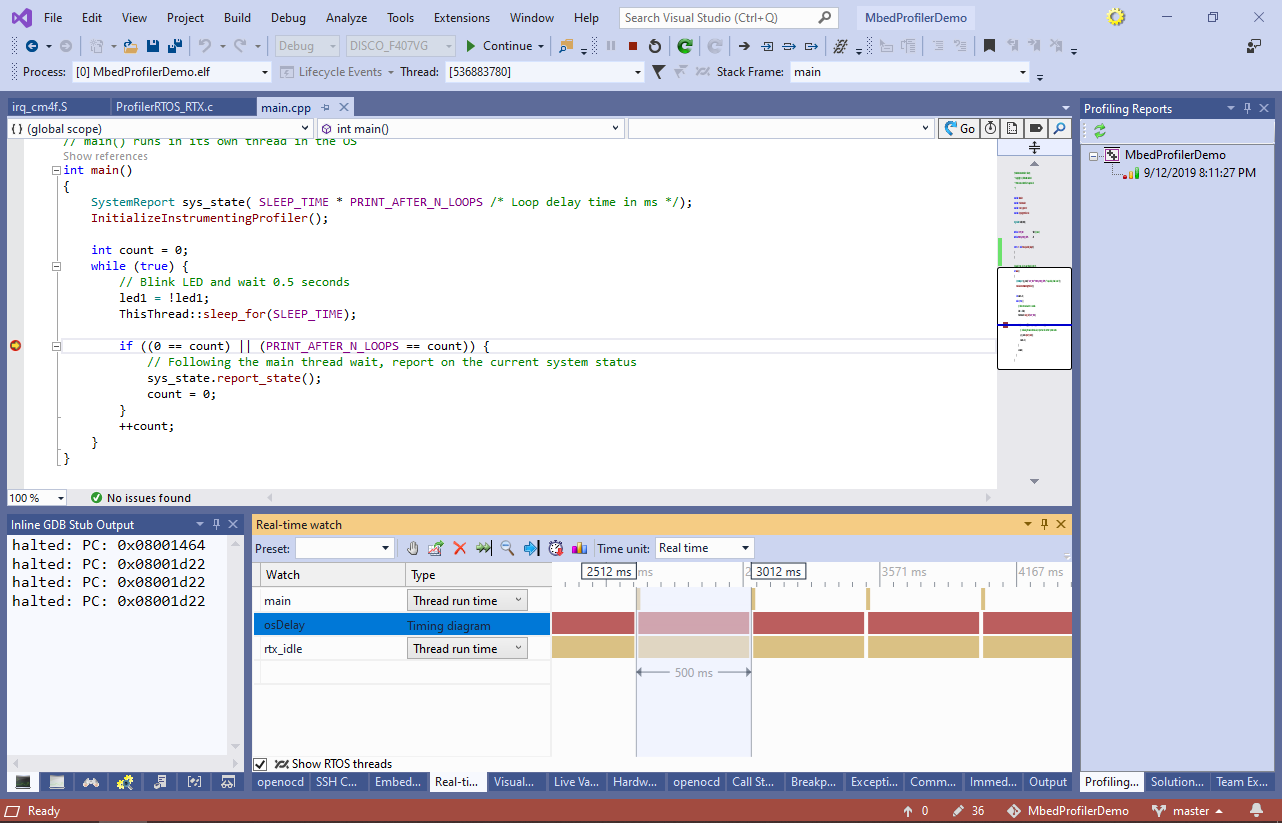
- Set a breakpoint in main() and start a regular debug session (don’t use the Analyze Performance command). Once the breakpoint hits, add “osDelay” to the real-time watch and resume the program. VisualGDB will plot the exact timing of different threads (main and rtx_idle in this example) and also the timing of the function added to the real-time watch:
- You can remove the reference to the profiler framework, or fine-tune its behavior via VisualGDB Project Properties -> Embedded Frameworks:
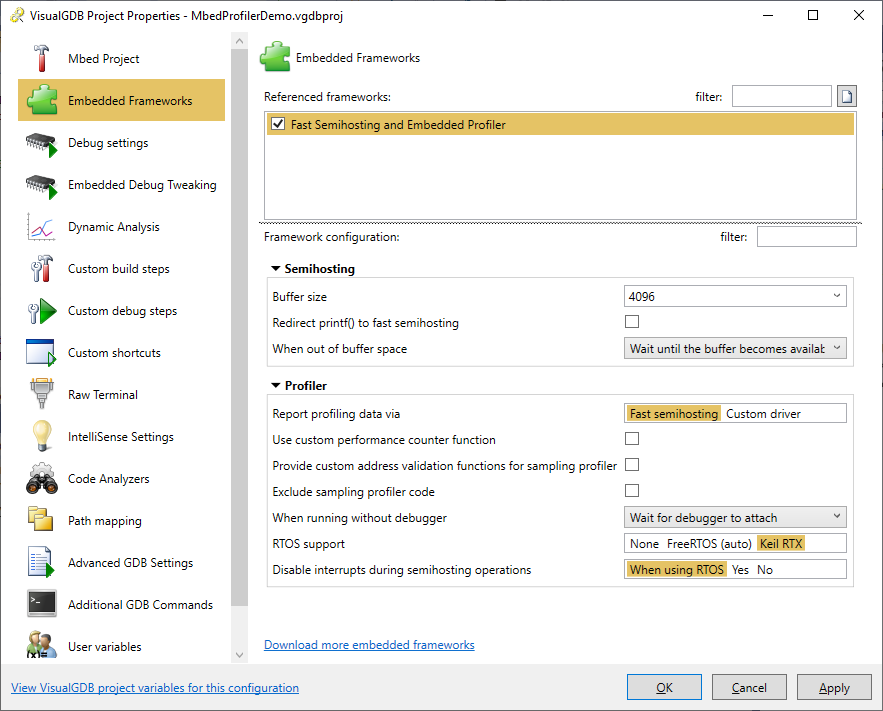 We recommend keeping the framework referenced even in the release builds and simply conditioning out the call to InitializeInstrumentingProfiler() to let the linker automatically discard its contents.