Debugging the STM32 Blue Pill board with Visual Studio
This tutorial shows how to create a basic project for the STM32 Blue Pill board with Visual Studio and VisualGDB.
We will show the necessary wiring to program the FLASH memory using the ST-Link programmer from a separate STM32 Nucleo board and will then proceed with debugging the Blue Pill board with SWD.
In order to debug the Blue Pill board via SWD, we would need to connect the following signals to an ST-Link programmer:
- Power and Ground
- SWD clock (SWCLK)
- SWD data (SWIO)
- Reset
The firmware that is pre-loaded into the Blue Pill board reconfigures the SWD pins as generic I/O pins, hence we will not be able to debug the board via SWD unless we also connect the reset pin and enable the “Connect under reset” setting in the software. The picture below shows the location of the signals required for SWD-based debugging: 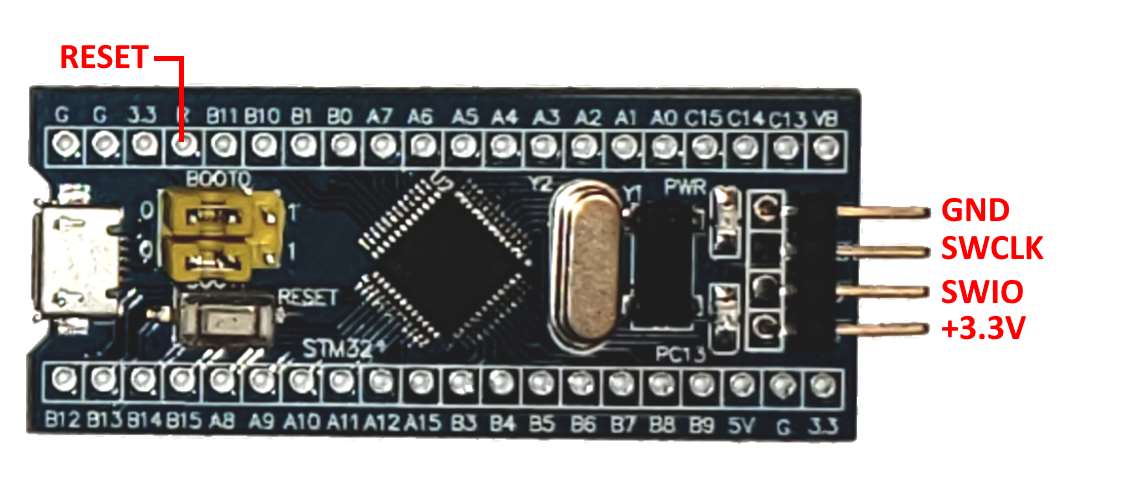 Although we can use a stand-alone ST-Link programmer, in this tutorial we will use the one embedded into a STM32 Nucleo board. In order to do that, remove the ST-Link/Nucleo jumpers and use the signals shown below:
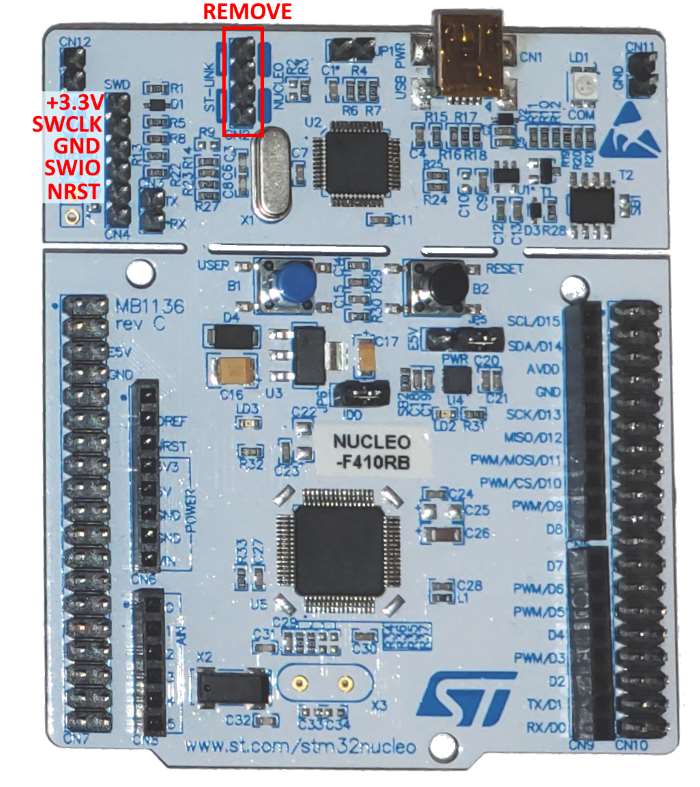 The final wiring should look as shown below:
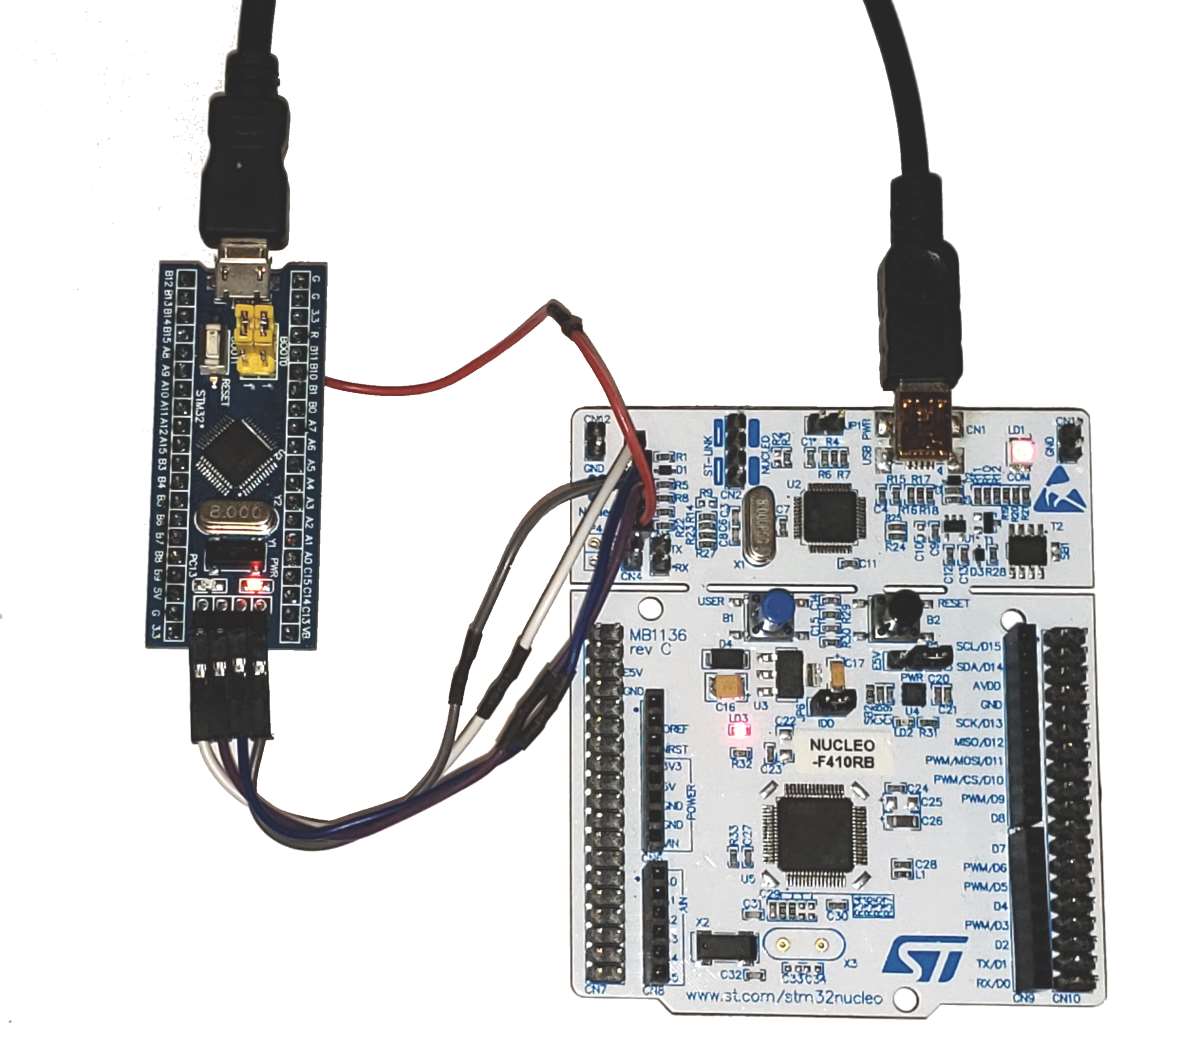 Now we will proceed with creating a VisualGDB project for the board.
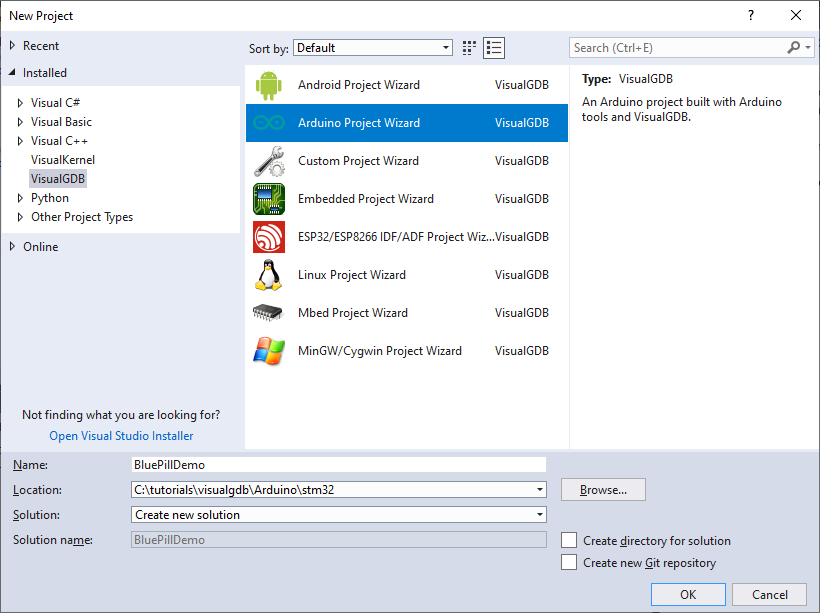
- Start Visual Studio and open the VisualGDB Arduino Project Wizard:
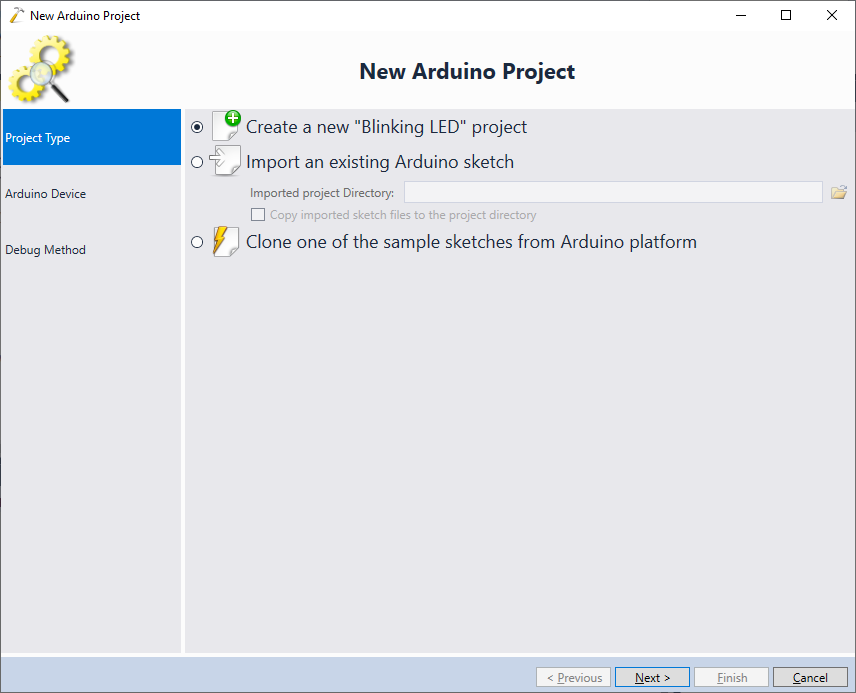
- Proceed with the default “Blinking LED” option:
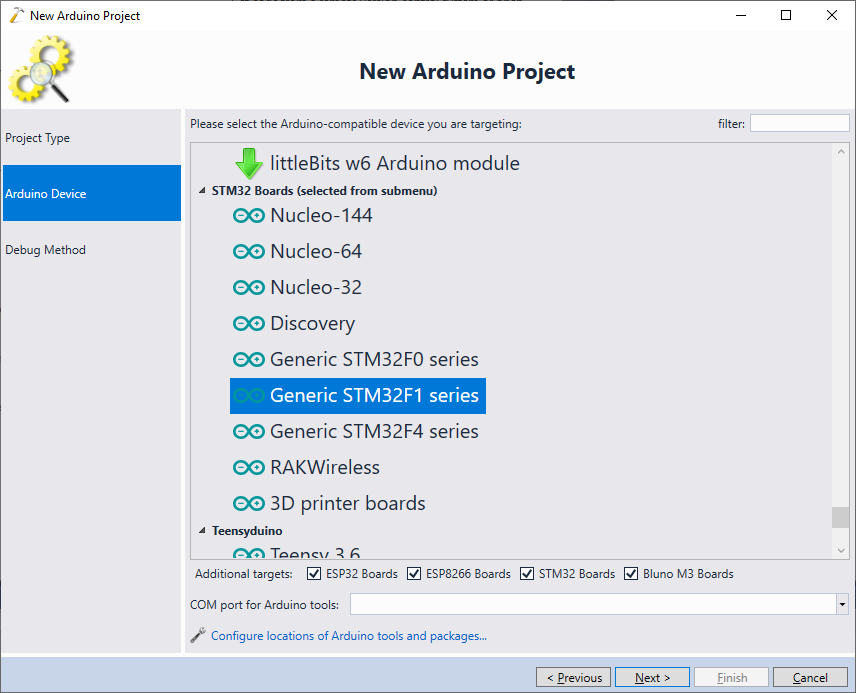
- The STM32 Arduino package organizes the supported targets in 2 levels: first you need to select the target family via the project wizard and then specify the exact board type via VisualGDB Project Properties. The STM32 Blue Pill board is based on the STM32F1 device, so pick Generic STM32F1 series in the device selector:
- Ensure you have both the board and the ST-Link connected via USB and select them on the Debug Method page of the wizard:
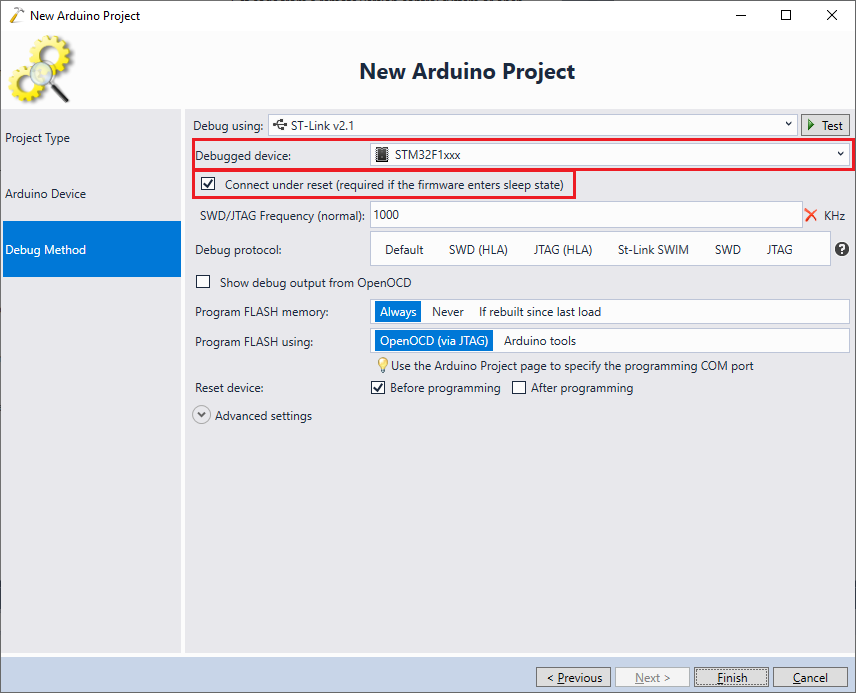 Ensure you set the “Connect under reset” checkbox, as the default Blue Pill firmware disables the SWD pins and will not allow connecting a debugger in the regular mode.
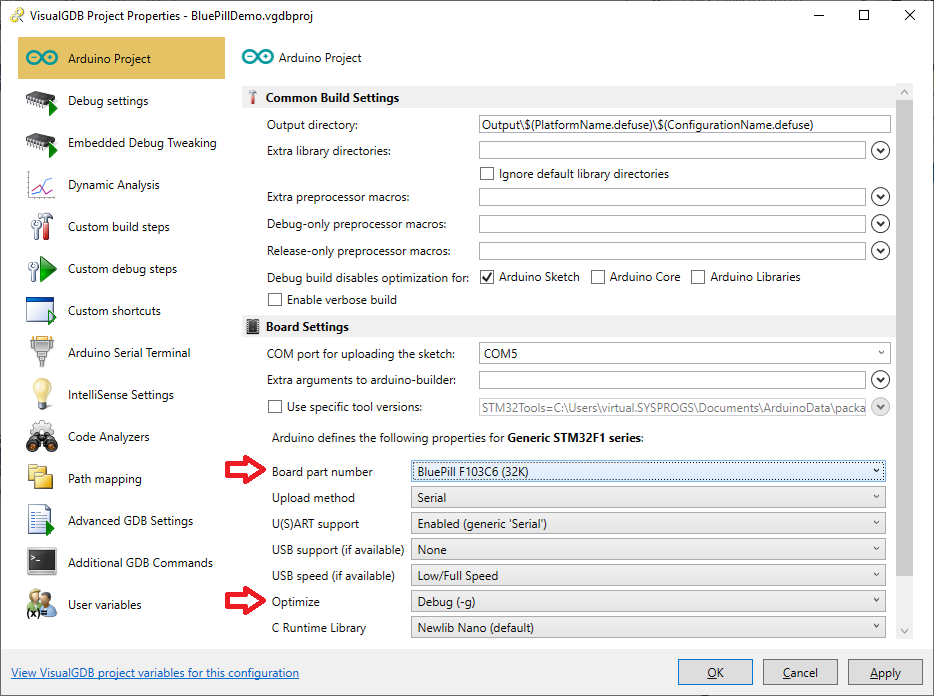
 - Press “Finish” to create the project. Once it is created and loaded, open VisualGDB Project Properties and set the correct board type and also set the “Optimize” field to Debug (-g):
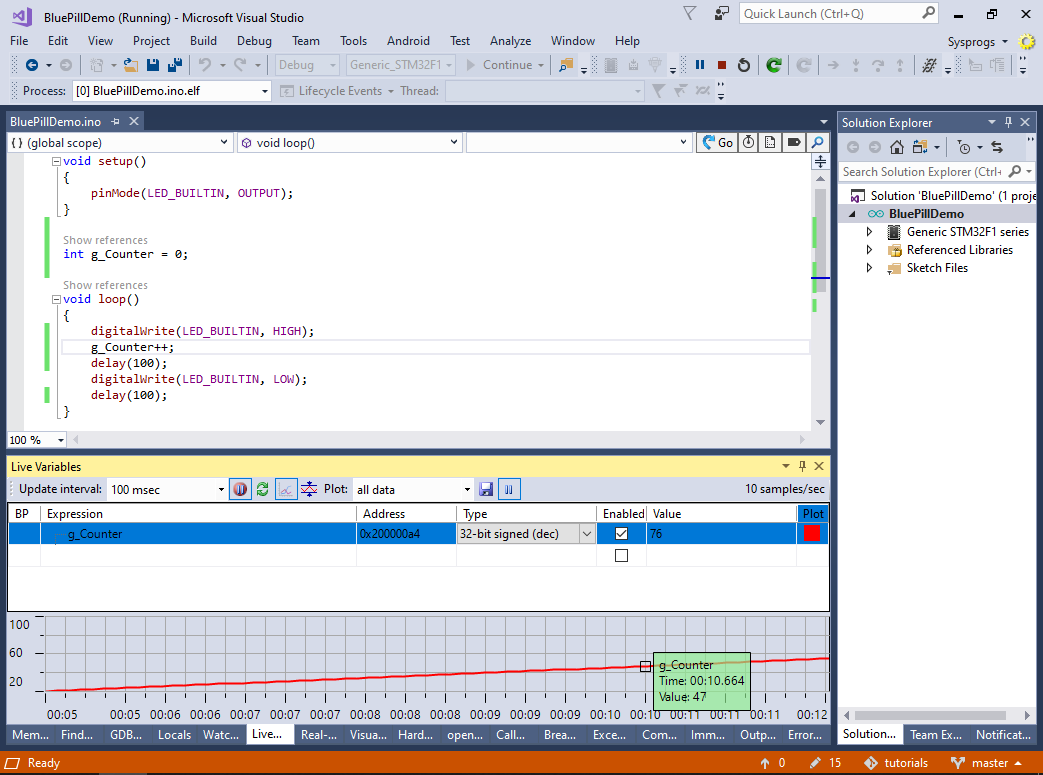
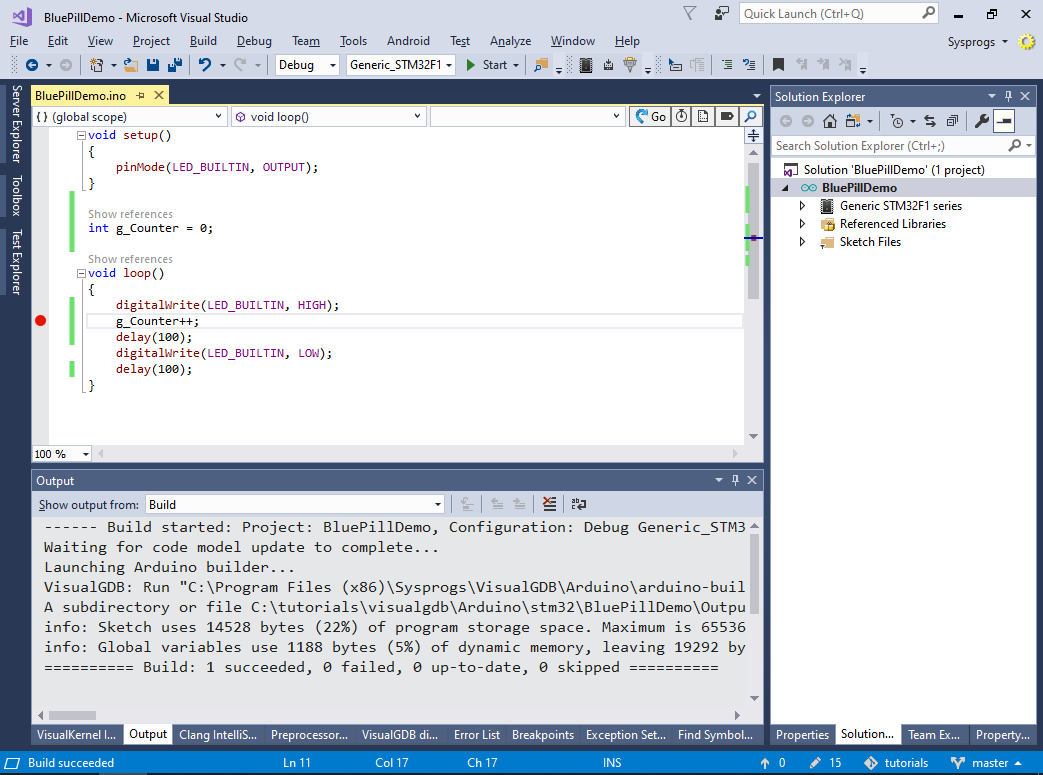
- Now we will show how to step through the code in a debugger and to view the contents of global variables while the target is running. Add a global variable called g_Counter and modify the loop() method to increase it:
- Set a breakpoint in loop() and start debugging. Once a breakpoint hits, add g_Counter to the Live Variables window:
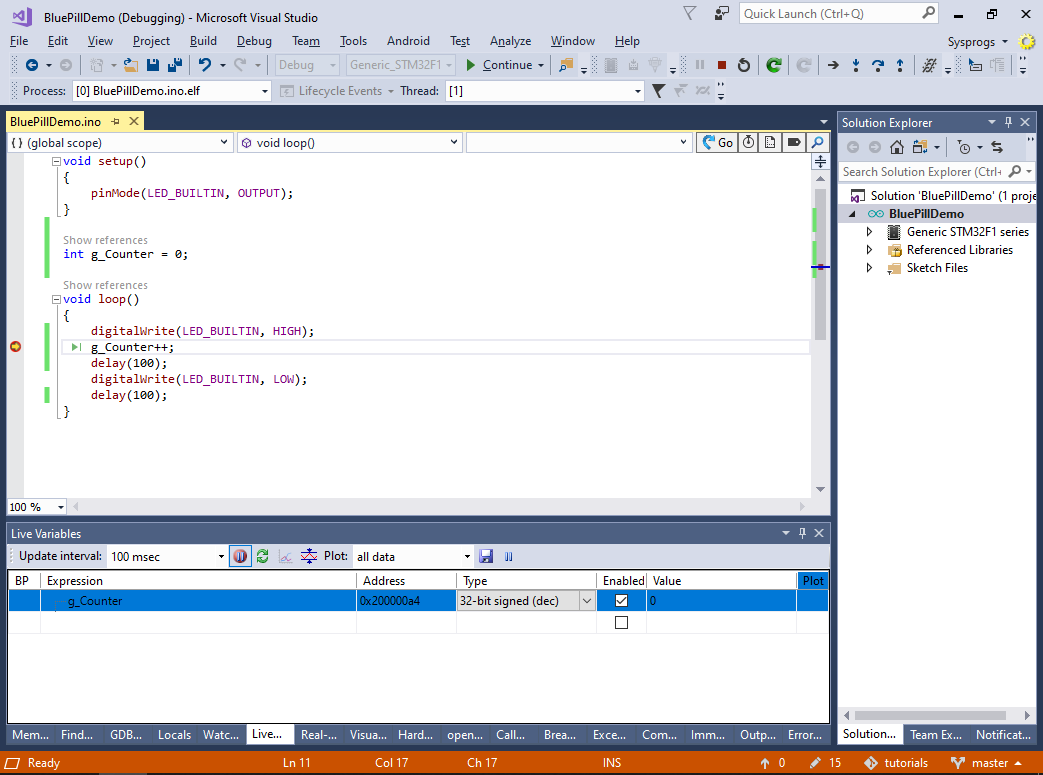
- Press F5 to continue debugging and enable plotting in the Live Variables window. The Blue Pill board will continue blinking the LED, while VisualGDB will show how the value of g_Counter is slowly increasing: