Profiling Raspberry Pi Pico Projects with VisualGDB
This tutorial shows how to profile the Raspberry Pi Pico project that use PicoSDK with VisualGDB. We will create a basic project using demonstrating the USB connectivity, and will show how to use the instrumenting profiler to analyze which functions take the most time.
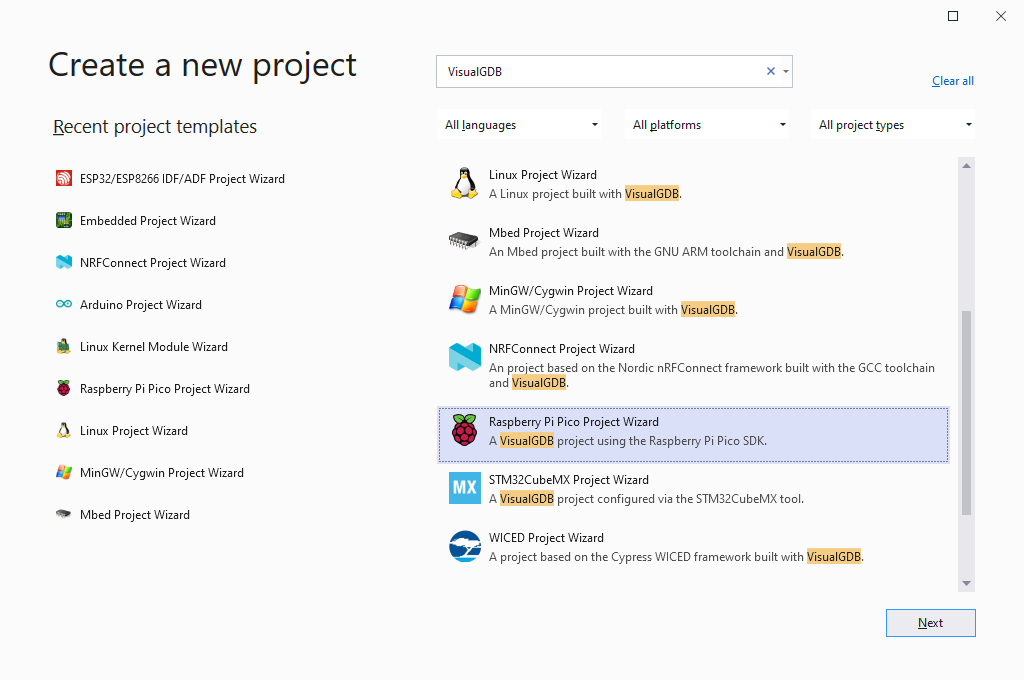
- Start Visual Studio and locate the VisualGDB Raspberry Pi Pico Project Wizard:
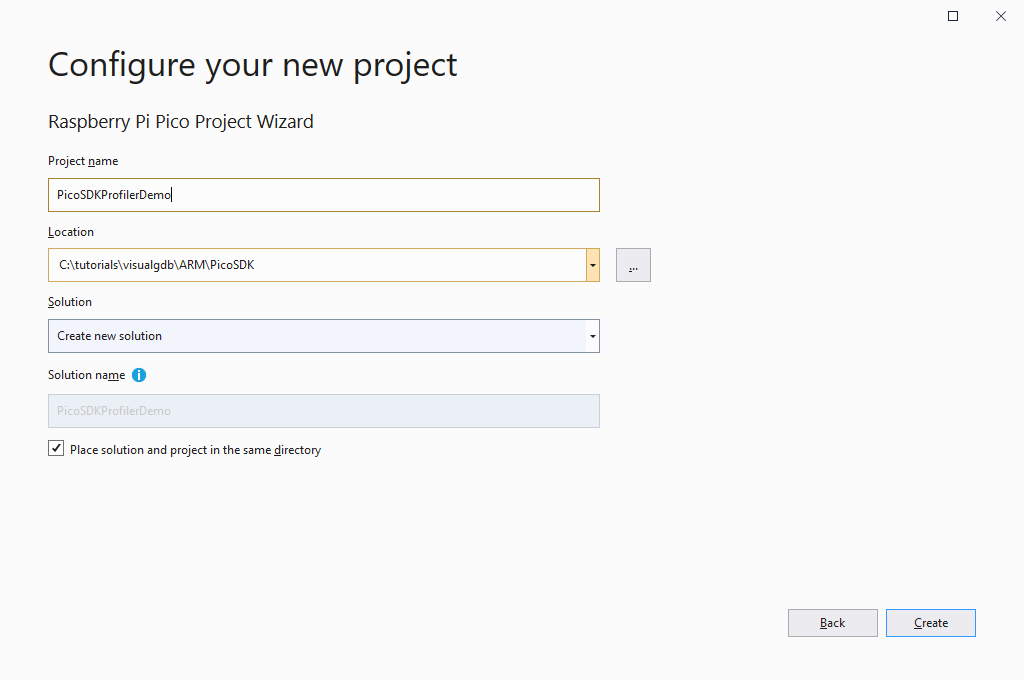
- Enter the name and location for your project:
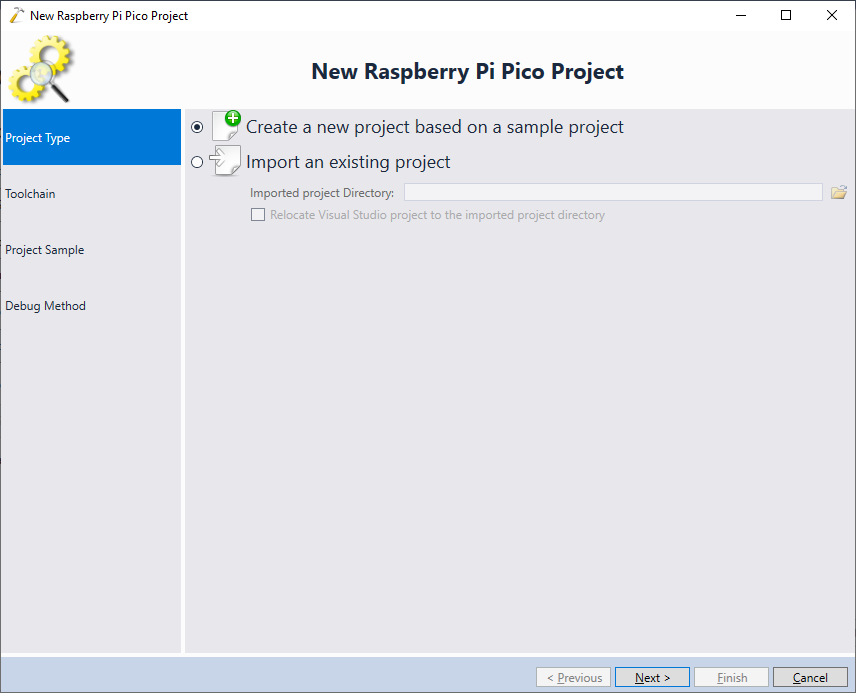
- On the first page of the VisualGDB-specific part of the wizard, select “Create a new project based on a sample project”:
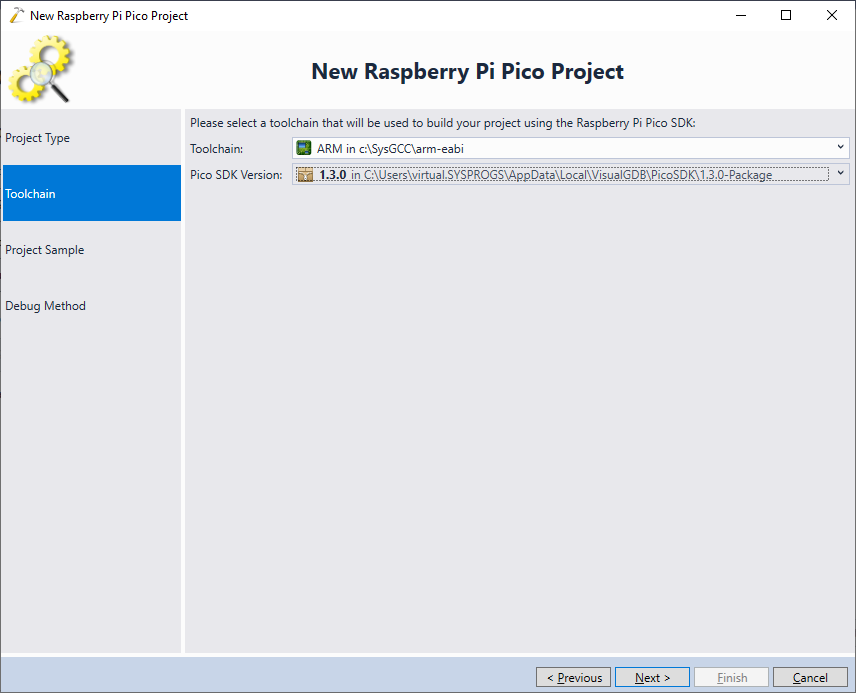
- Pick your ARM toolchain and the PicoSDK version that you would like to use. If you have not created PicoSDK-based projects yet, VisualGDB can automatically download and install the latest PicoSDK for you:
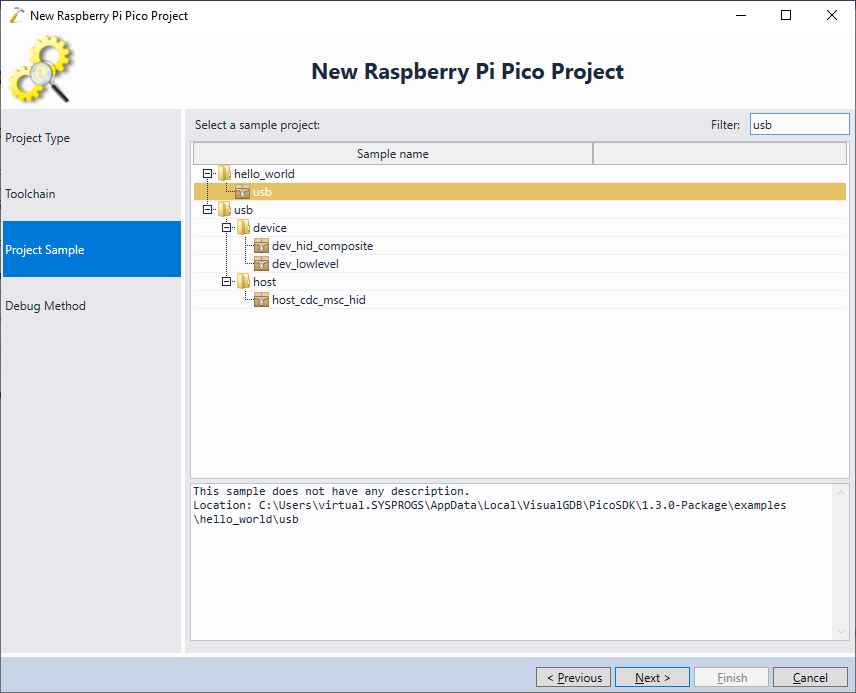
- Select the project template you would like to clone. In this tutorial, we will create a project based on the hello_world\usb example:
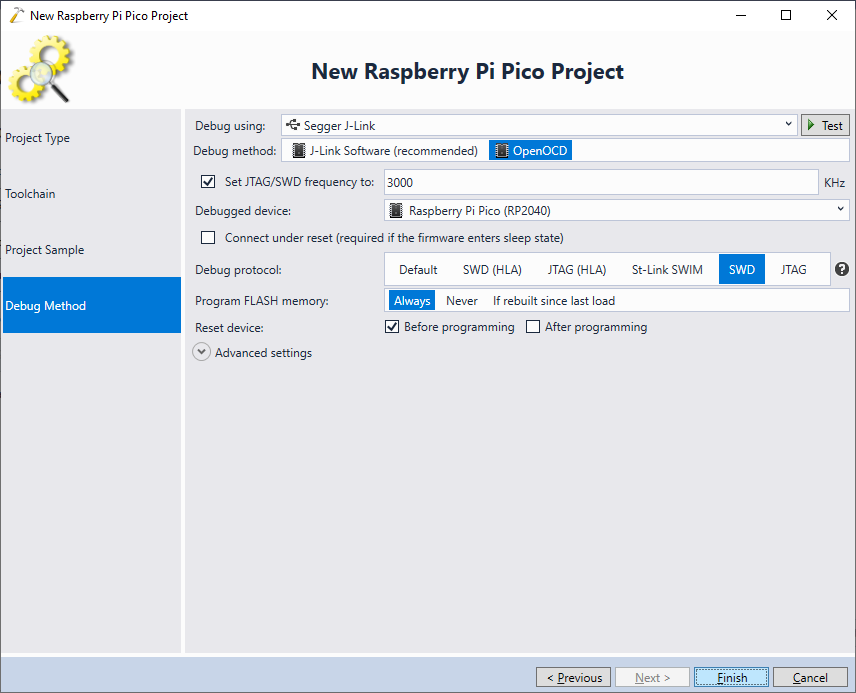
- Finally, connect a debugger to your board and select the debugging settings on the last page of the wizard. Use the “Test” button to verify that the debugging connection works:
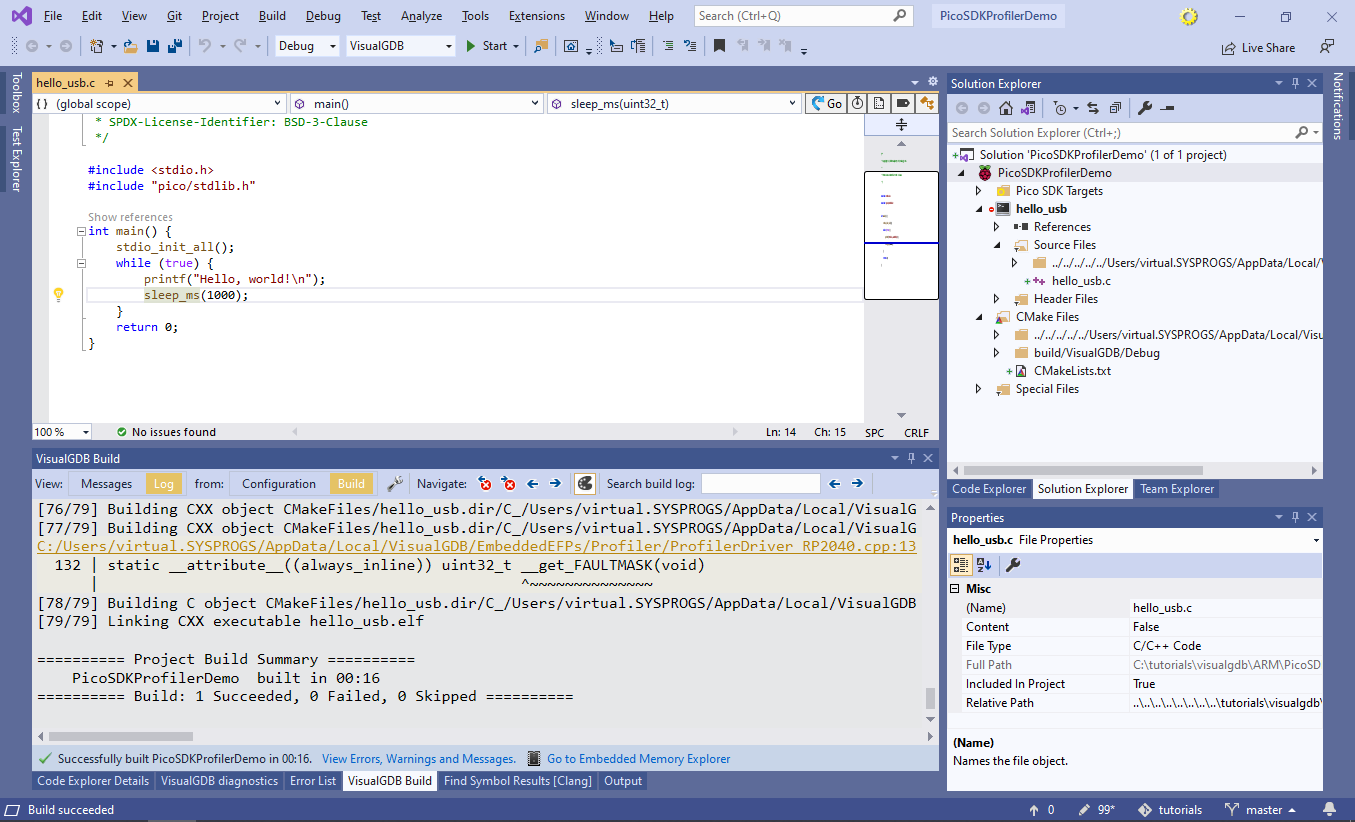
- Press “Finish” to create the project. Once it has been created, build it by pressing Ctrl-Shift-B:
- Before we can profile the project with VisualGDB, we need to reference the Fast Semihosting and Embedded Profiler framework. Open VisualGDB Project Properties, go to the Embedded Frameworks page and reference it there:
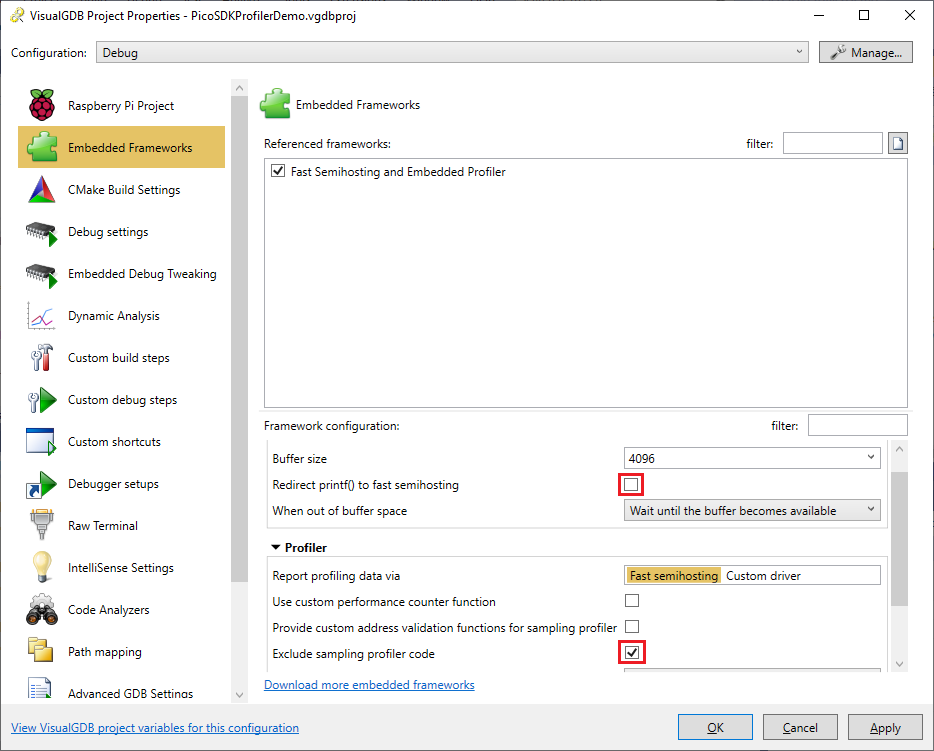 Make sure that the following configuration options are set as shown below:
- “Exclude sampling profiler code” checkbox should be checked, as the sampling profiler does not support Raspberry Pi Pico yet.
- “Redirect printf() to fast semihosting” checkbox should be unchecked, as trying to use the Raspberry Pi Pico semihosting while profiling may result in a crash.
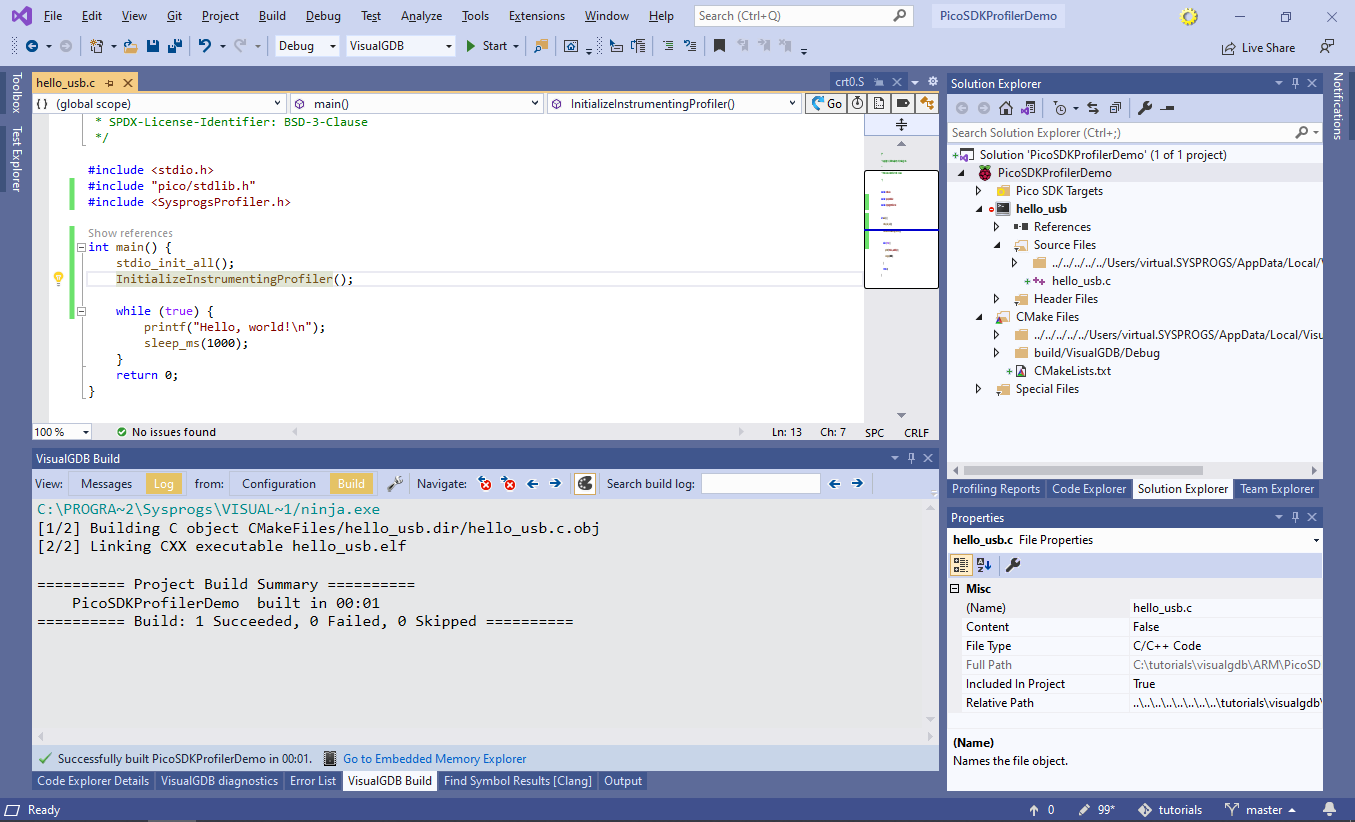
- Modify the main source file to include <SysprogsProfiler.h> and call InitializeInstrumentingProfiler() from main() as shown below. Then, build the project and select “Analyze->Analyze Performance with VisualGDB:
- In the New Profiling Session window select “Instrument functions to record their time”. Note that some of the PicoSDK functions are placed in RAM and instrumenting them may result in a crash. In order to exclude them from instrumentation, sort the functions by address and uncheck every function located in RAM:
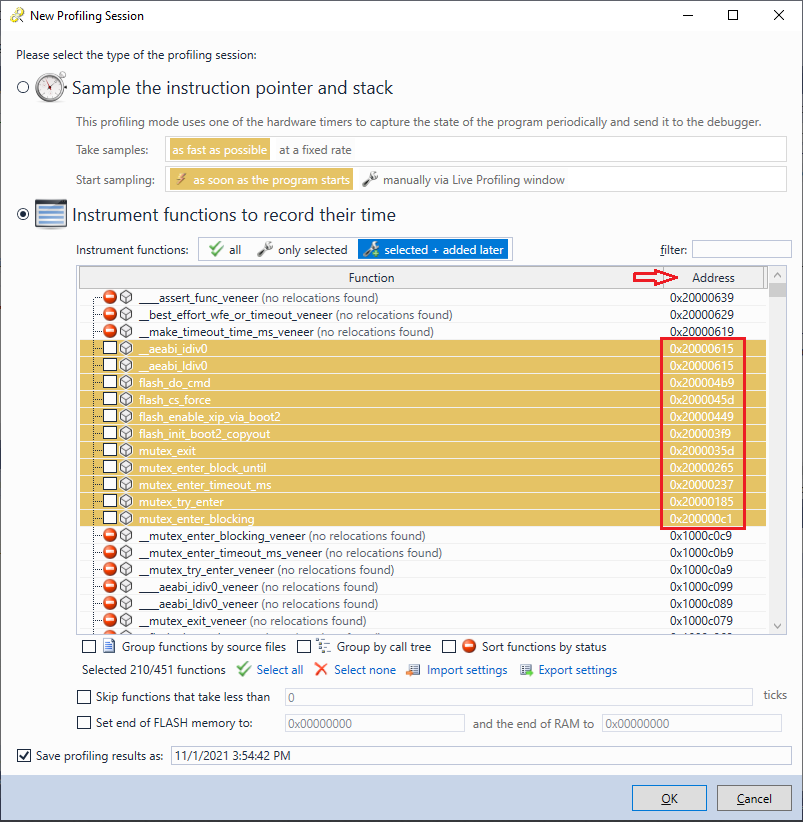 Note that you can uncheck multiple functions by selecting them with Shift, and pressing Space.
 - Press “OK” to start a profiling session. The PicoSDK will likely trigger a breakpoint as shown below:
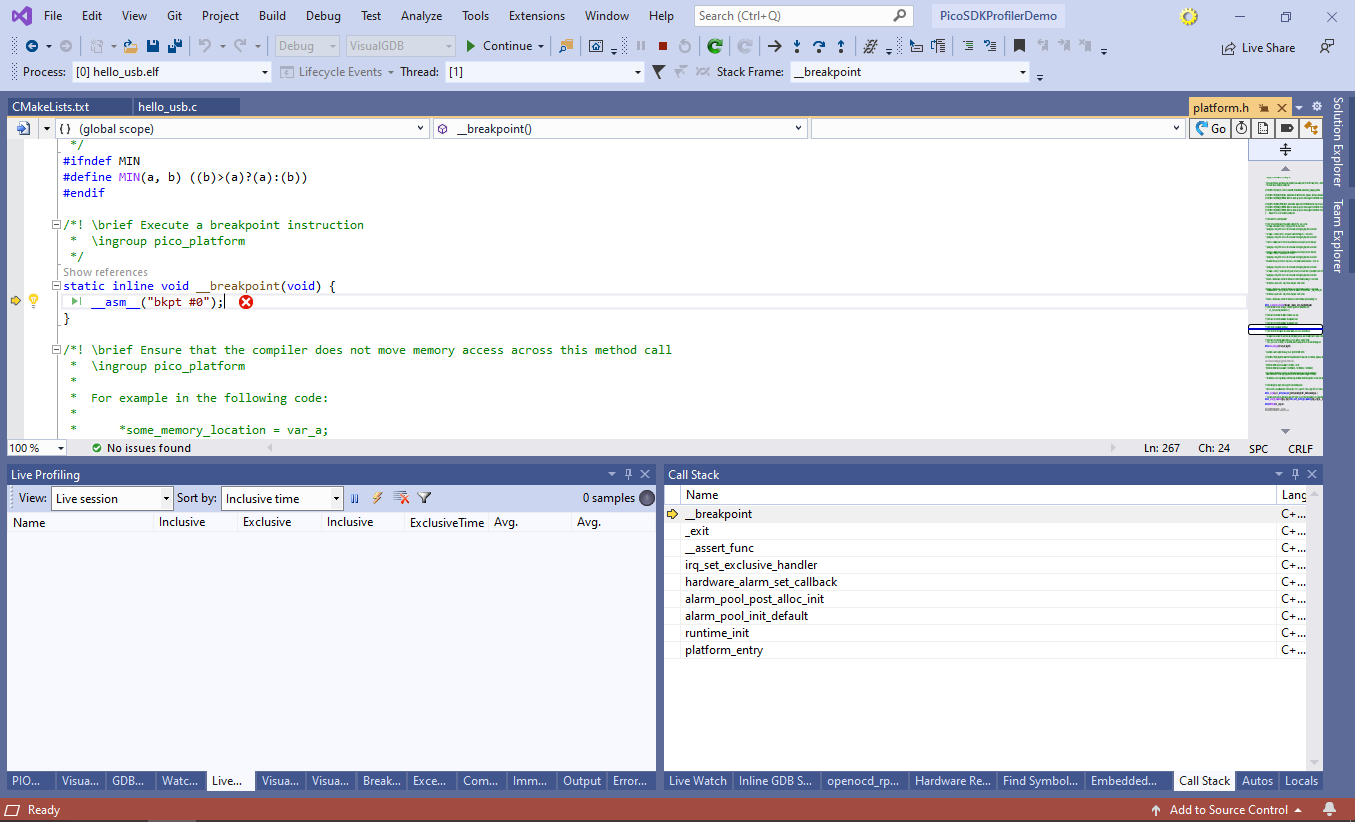
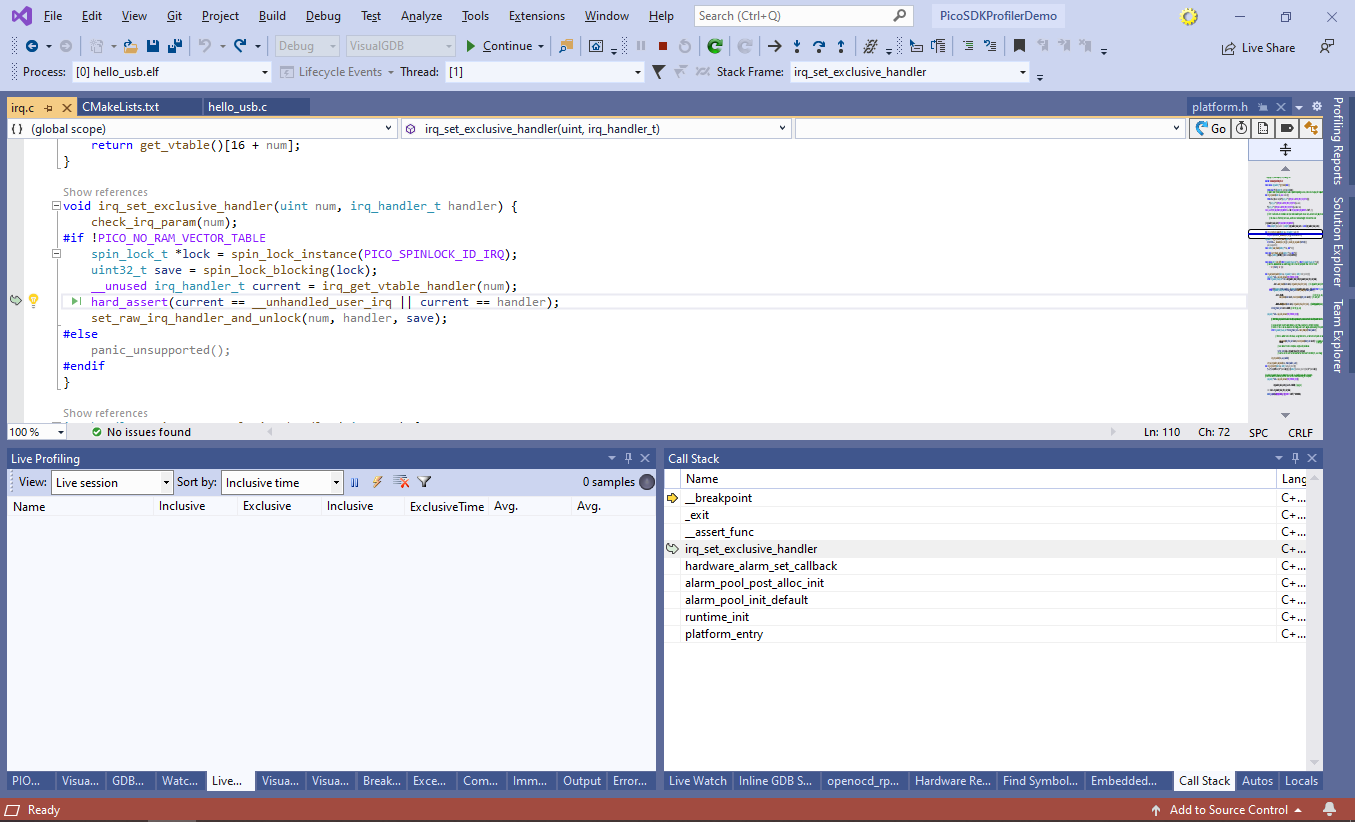
- Use the call stack to navigate to the function triggering it. As of PicoSDK 1.3.0, the hard_assert() inside irq_set_exclusive_handler() will trigger during a profiling session, because some of the interrupt handlers have been instrumented. You can suppress this breakpoint by commenting out the hard_assert() line shown below:
- Now that you have commented it out, you will be able to profile the code. Use the Live Profiling window to see what functions take the most time:
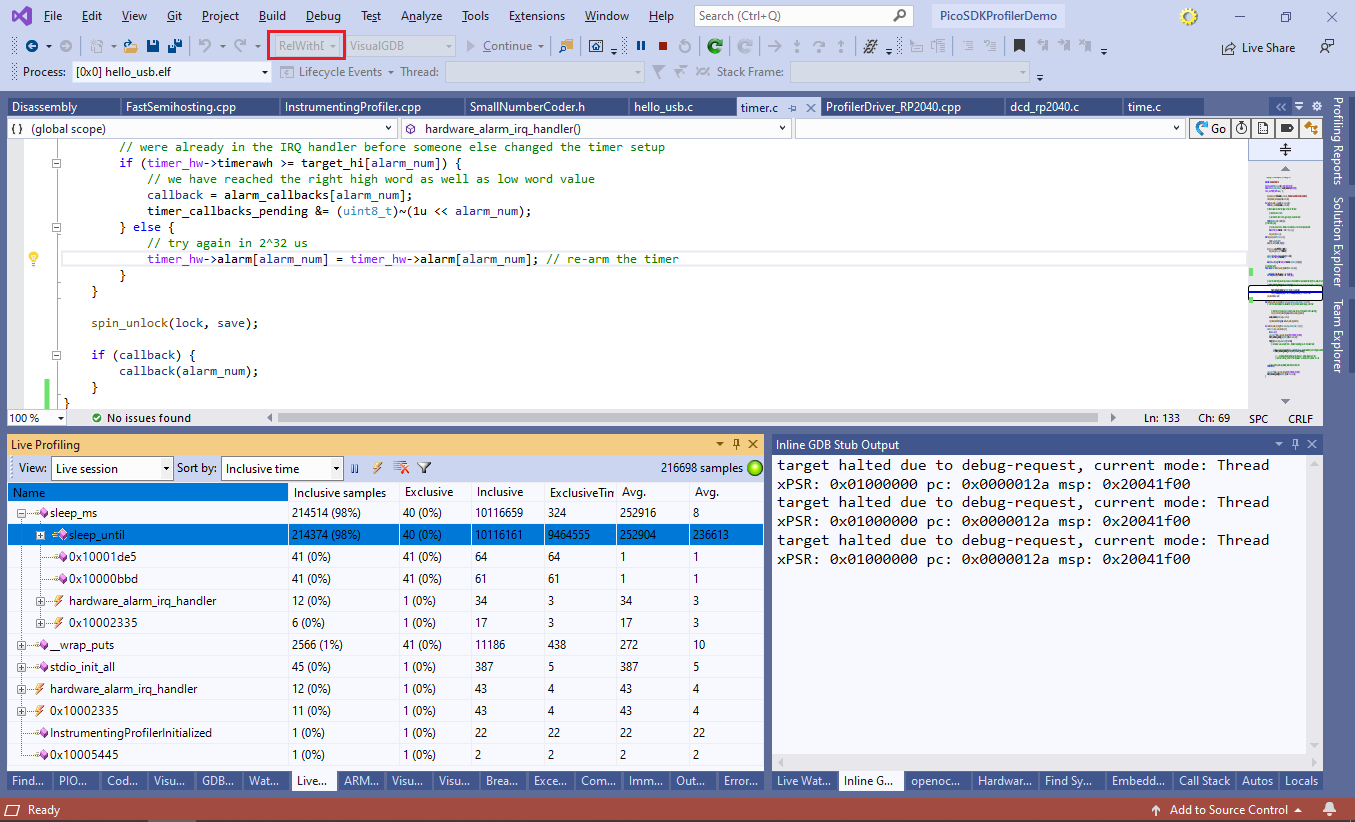 Note that the “USB Hello, World” example shown in this tutorial will not work correctly when profiled in the Debug configuration. This happens because the overhead introduced by unoptimized profiling code make the code too slow to handle USB requests. Switching to the RelWithDebInfo configuration via Visual Studio Configuration Manager enables optimization and fully resolves the issue.
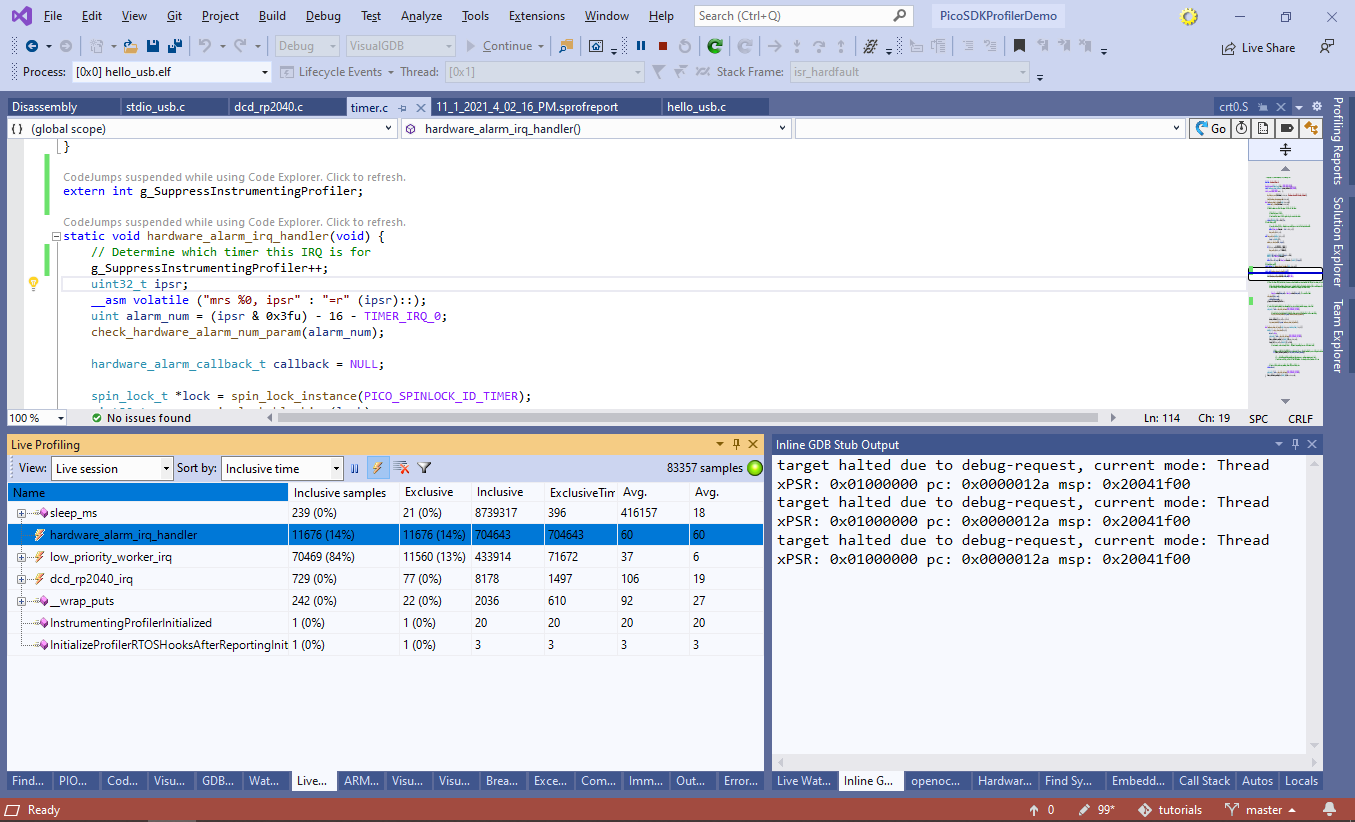
 - You may find that some functions are called too frequently and are causing too much profiler overhead. If this happens, you can either exclude them from instrumentation via the New Profiling Session window, or programmatically suspend the profiler while they run. E.g. profiling an unoptimized build shows that most of the time is consumed by numerous small functions called by hardware_alarm_irq_handler():
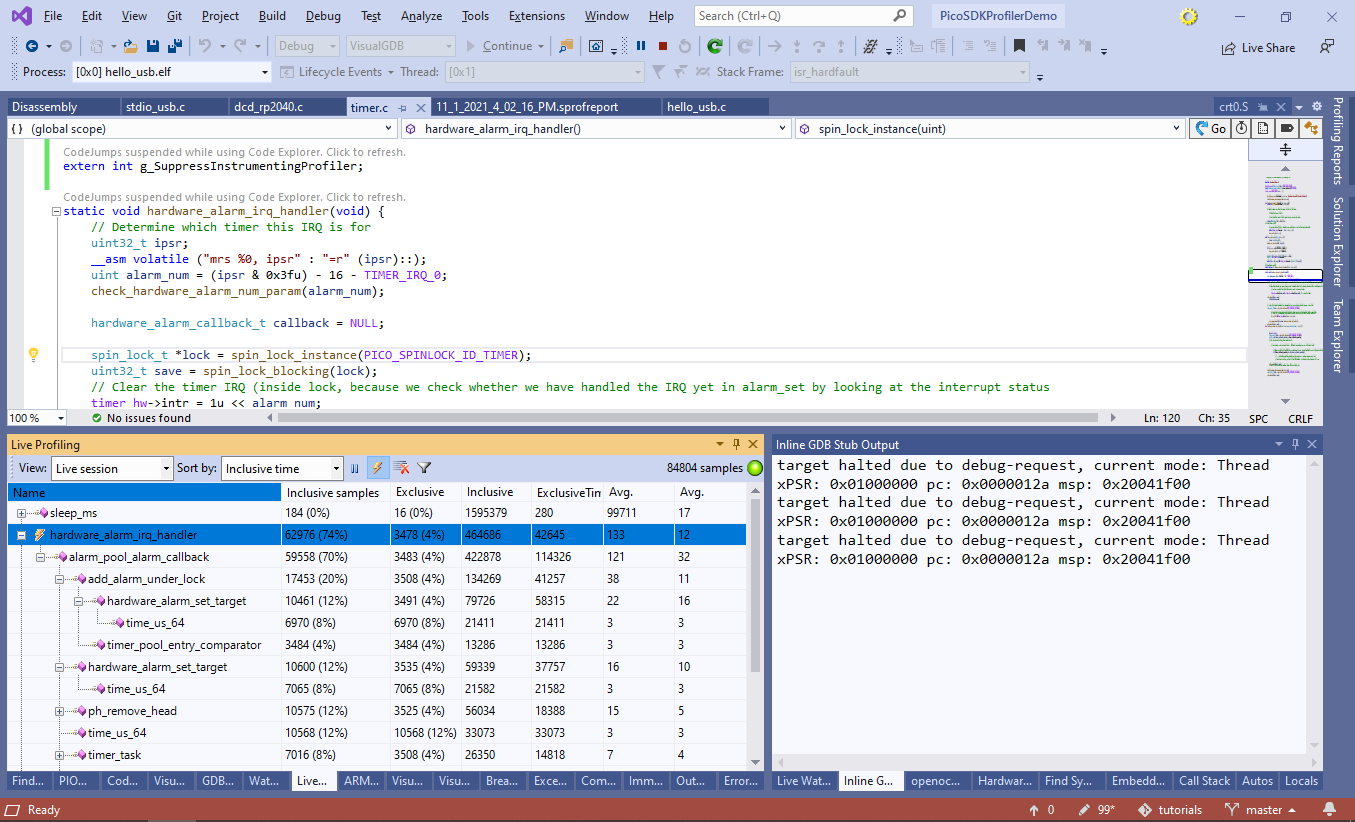
- Use the Code Explorer to locate the g_SuppressInstrumentingProfiler variable. Edit the hardware_alarm_irq_handler() function to increment the it on entry and decrement it before exit:

- Now the overhead of the hardware_alarm_irq_handler() function has considerably reduced. The small functions called by it still work as before, but the profiler no longer measures their execution time separately, as if all of the work was done in hardware_alarm_irq_handler() itself: