break command
Creates a breakpoint at a specified line, address or function.
Syntax
b
break [Function Name]
break [File Name]:[Line Number]
break [Line Number]
break *[Address]
break [...] if [Condition]
break [...] thread [Thread-id]
b [...]
Parameters
- Function Name
- When specified, the break command will set a breakpoint at the beginning of the specified function.
- File Name
- When specified together with a line number, the break command will set a breakpoint at a given line inside the file. If the specified line contains no executable code, the breakpoint will be set on the first line below it that has executable code.
- Line Number
- When specified, the break command will set a breakpoint at a given location inside the specified file. If no file is specified, the current source file will be used.
- Address
- When specified, the break command will set a breakpoint at a given address. The address should be a valid C/C++ expression (e.g. a hexadecimal number starting with 0x).
- Condition
- Specifies an optional C/C++ expression that will be evaluated each time the breakpoint is hit. If the result of the evaluation is 0, the breakpoint will be skipped.
- Thread-Id
- Specifies the optional GDB-level ID of a thread that will be associated with this breakpoint. If provided, the breakpoint will only trigger within the given thread. If not provided, the breakpoint will be triggered when any thread reaches the specified location.
Attention
Do not confuse the [Function name] and the [Address] forms of the break command. E.g. if you attempt to set a breakpoint at address 0x40138c, the following command will fail:
This happens because GDB will interpret 0x40138c as a function name rather than an address. The correct syntax to set a breakpoint at address 0x40138c is:
Pending breakpoints
If you try setting a breakpoint in the code inside a shared library (DLL) that has not been loaded yet, GDB will show the following warning:
In most of the cases answering 'y' will create a pending breakpoint that will be resolved when the corresponding shared library (DLL) is loaded in the future. However, this might not work in one of the following cases:
- The shared library contains no debugging symbols (e.g. they have been removed with the 'strip' command).
- The GDB cannot detect when the library is loaded (e.g. when using gdb 6.x on Android)
- You have made an error in the file name or a function name. Note that Linux file names are case-sensitive.
If you encounter breakpoint problems, the following commands might be useful for further diagnostics:
- info sharedlibrary provides information about currently loaded shared libraries (DLLs).
- info sources provides information about the source files recognized by GDB.
- info breakpoints provides detailed information about the created breakpoints and their status.
Examples
Specifying location
In this example we will set a breakpoint in the beginning of the main() function using 4 different syntax variations:
Using function name:
Breakpoint 1 at 0x401395: file 0.cpp, line 4.
(gdb)
Using function address:
Symbol "main(int, char**)" is a function at address 0x40138c.
(gdb) break *0x40138c
Breakpoint 2 at 0x40138c: file 0.cpp, line 4.
(gdb)
Using file name and line number:
Line 4 of "0.cpp" starts at address 0x40138c <main(int, char**)>
and ends at 0x401395 <main(int, char**)+9>.
(gdb) break 0.cpp:4
Breakpoint 3 at 0x401395: file 0.cpp, line 4.
Using line number only:
Current source file is 0.cpp
Compilation directory is C:\MinGW\bin
Located in c:\mingw\bin\0.cpp
Source language is c++.
Compiled with DWARF 2 debugging format.
Does not include preprocessor macro info.
(gdb) break 4
Breakpoint 4 at 0x40138c: file 0.cpp, line 4.
Conditional breakpoints
In this example we will set a conditional breakpoint in the following program:
void func(int arg)
{
printf("Iteration %d\n", arg);
}
int main(int argc, char *argv[])
{
for(int i = 0; i < 5; i++)
func(i);
return 0;
}
The breakpoint will be set inside the func() function and will be only set to trigger when arg is equal to 3:
Breakpoint 1 at 0x4013b6: file 0.cpp, line 5.
(gdb) run
Starting program: C:\MinGW\bin\0.exe
[New Thread 7860.0x25c0]
Iteration 0
Iteration 1
Iteration 2
Breakpoint 1, func (arg=3) at 0.cpp:5
5 printf("Iteration %d\n", arg);
Compatibility with VisualGDB
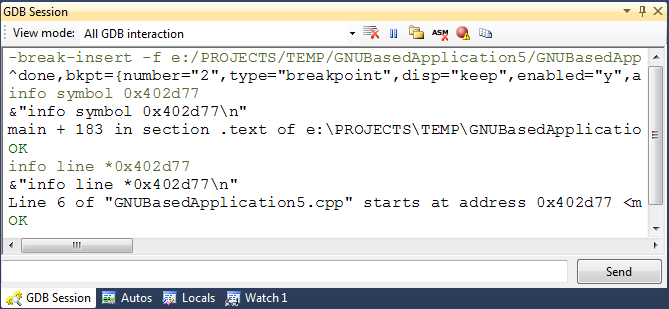
It is possible to execute the break command directly under VisualGDB, however it is not recommended, as such a breakpoint won't appear under Visual Studio breakpoint list. Please use the Visual Studio 'Break at Function' or 'New Breakpoint' commands to add code breakpoints, data watchpoints and set conditions. VisualGDB will automatically issue a 'break' command in those cases:

