Obtaining a Visual Studio Stack Trace
If your Visual Studio session hangs or crashes when running VisualGDB and you do not get a meaningful error message, please follow the instructions below to narrow it down:
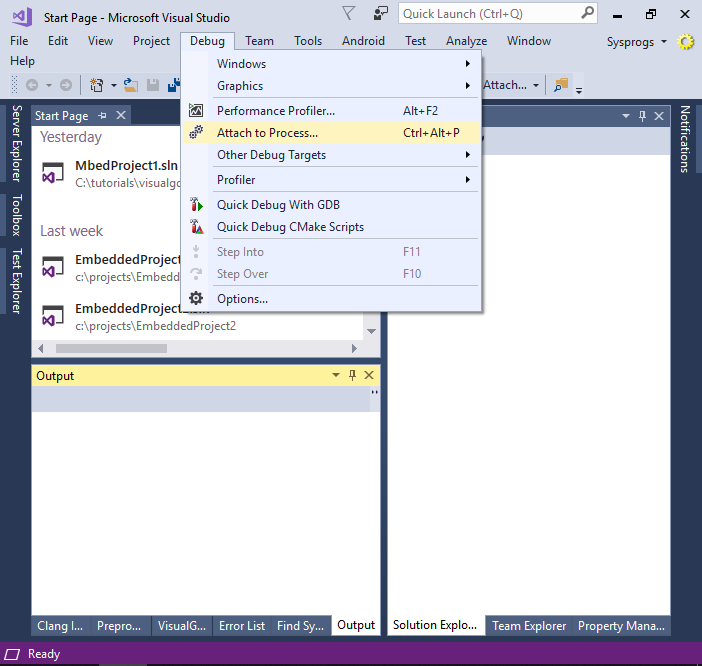
- Ensure you have exactly one Visual Studio instance
running and it has not crashed yet. Then start another Visual Studio instance
and select Debug->Attach from it:
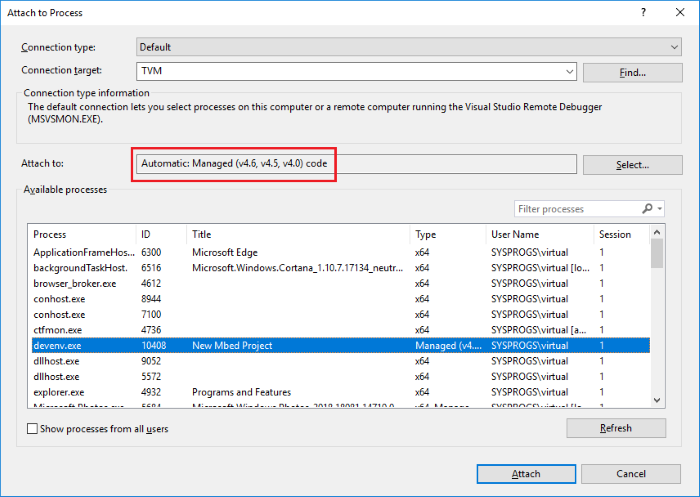
- Attach to the hanging Visual Studio instance (the
process name for Visual Studio is devenv.exe). Ensure that
"Managed (v4.x) Code" is selected when attaching:
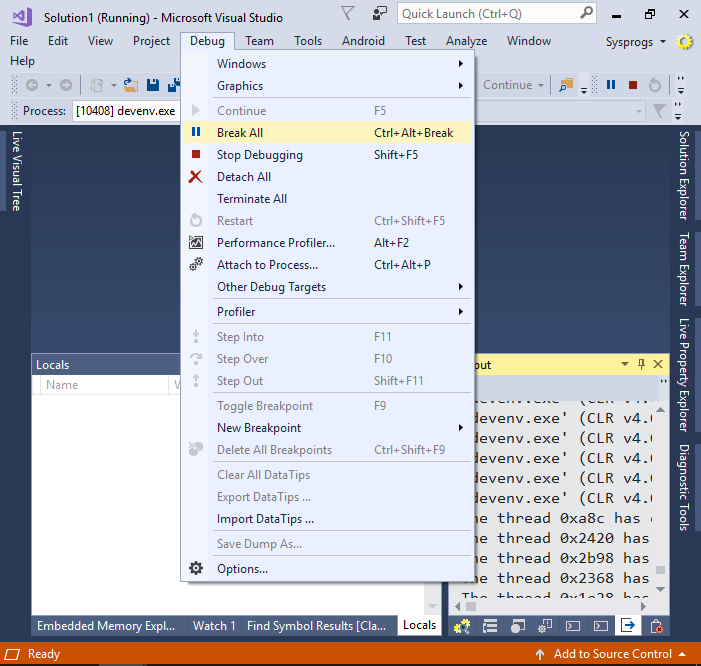
- If you are troubleshooting a crash, reproduce the
problem now and let the crash happen. If Visual Studio hangs
instead, Select Debug->Break All:
- Go to the Threads view (Debug->Windows->Threads) and
select the main thread by double-clicking on it:
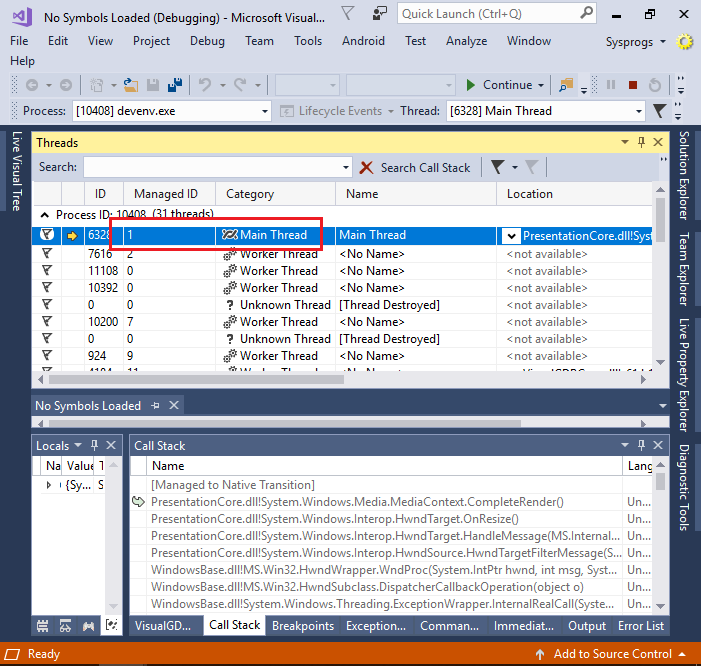
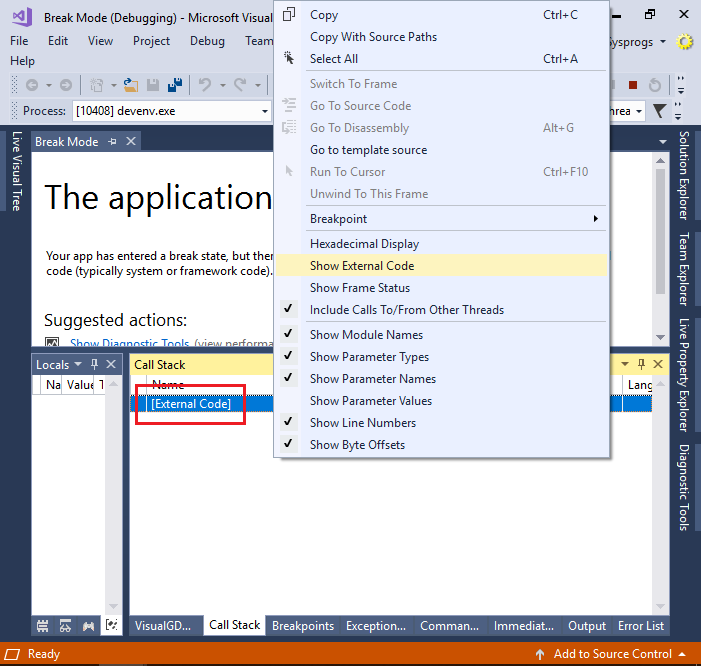
- Check the call stack window. If it is showing "[External
Code]" only, right-click and select "Show External Code":
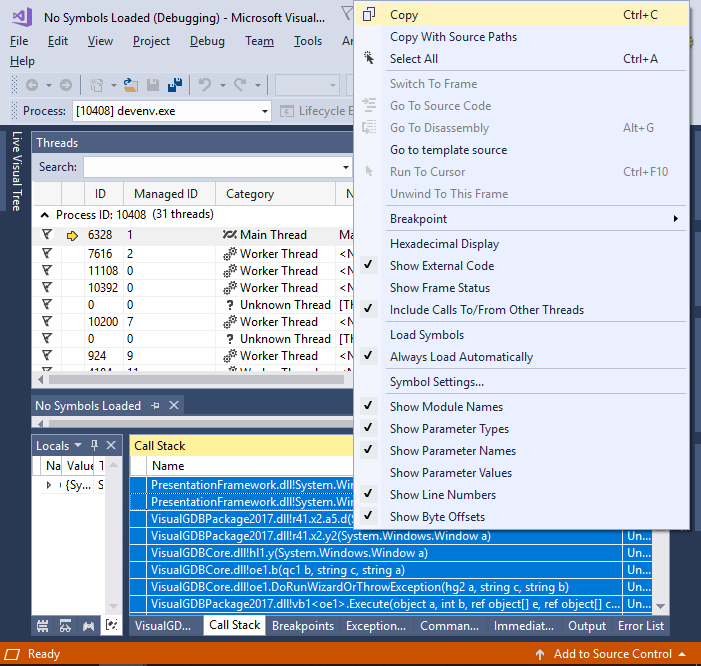
- Once you get the call stack of the main thread, select
all frames and copy them to Clipboard:
- Send us the frames you captured along with your VisualGDB build number (from Help->About VisualGDB) and we will respond with more detailed diagnostic instructions.