VisualGDB 4.3 Beta 1 Released
We have released the first beta of VisualGDB 4.3 with lots of usability improvements and some time-saving features. Here's a brief overview of the release highlights:
Full CMake Integration
VisualGDB is now fully integrated with CMake. For both
Windows and Linux projects you can just select CMake in the
project wizard and VisualGDB will handle it for you. Basic
IntelliSense for CMakeLists.txt and graphical settings editing
are now supported: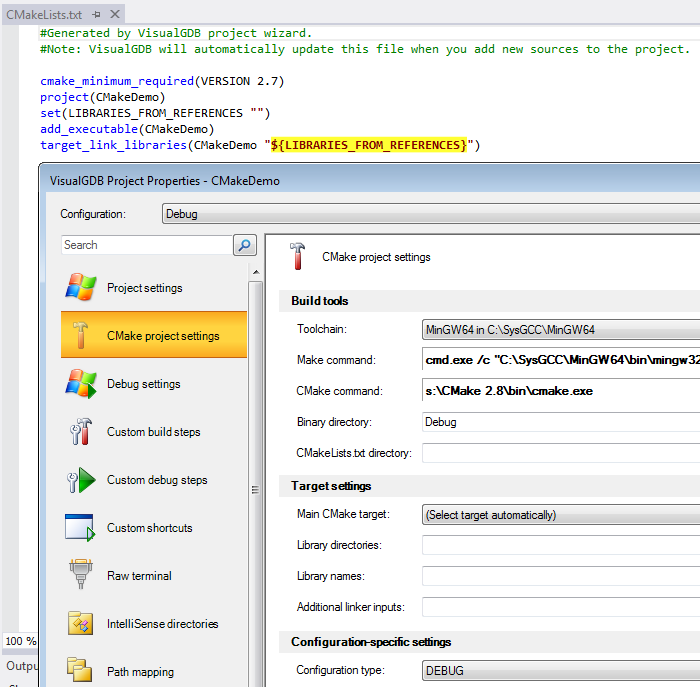
Android Studio Integration
You can now use VisualGDB to build and debug Android Studio projects and even co-debug them at the same time. See our detailed tutorial for more details.
ARM Semihosting Support
We have also added support for getting printf()-style debug
messages from an ARM board to the debugger without using any
hardware interface like a COM port by using semihosting - a
syscall-based interface of reporting various events to the
debugger. VisualGDB now detects and handles it automatically: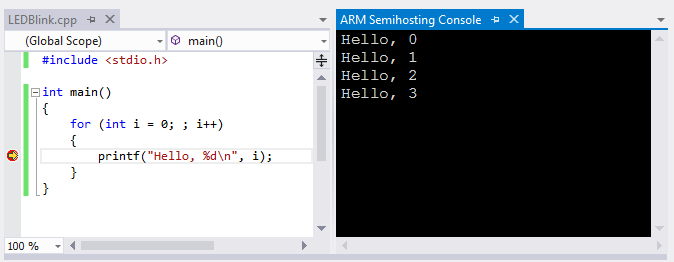
Embedded Thread Plugins
One important feedback we received related to embedded
debugging was the experience with debugging embedded RTOSes.
While the OSes support multiple threads and allow examining
their state via public debugging symbols, it was hard to make
sense of that information (e.g. call stacks or variable values)
while debugging. We have simplified it by adding a new plugin
interface for handling those threads. The plugin only needs to
report thread names and register values and VisualGDB will
automatically handle call stacks, variable values and everything
else: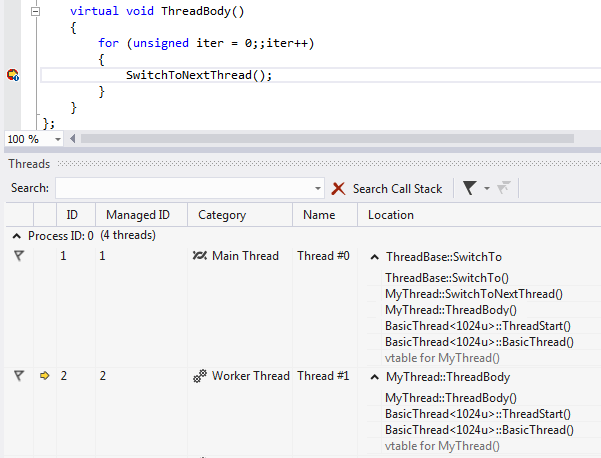
We have also published a detailed step-by-step tutorial.
Step into Entry Point
If your embedded program shows strange behavior before
entering the main() function, you can now debug it easier by
selecting 'step into entry point' on the Debug Settings page and
pressing F10 to begin debugging. Visual Studio will then step at
the entry point allowing you to step through the code that is
executed before main() is called: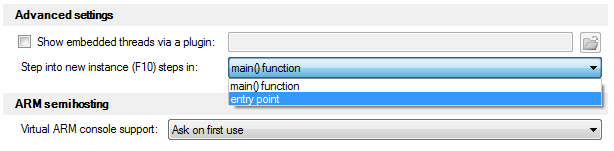
Stand-alone Embedded Projects
We have made it easier to experiment with an embedded project
without affecting other projects. The Embedded projects can now
be converted to stand-alone projects from the Embedded Project
page. Stand-alone projects contain copies of all necessary BSP
code (startup files, linker scripts, etc.), so you can modify
those without affecting other projects: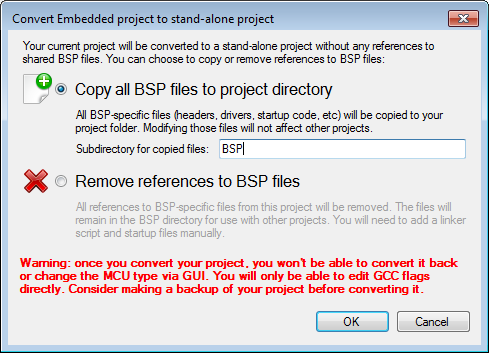
Improved SSH Connection Usability
We've also added a couple of features to simplify the lives
of those who have lots of SSH connections on one machine. First
of all, you can now define global per-user connection aliases
(e.g. deployment machine, test machine) and specify them in your
projects. Once you want to target a different machine, just
change the alias target and all related projects will use the
new machine automatically: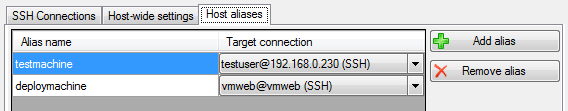
We have also simplified finding the right connection among a
long list by adding a find button. The find dialog is optimized
to be as fast as you would want it to be, so you can select a
connection by typing in any unambiguous substring of its name
and pressing Enter: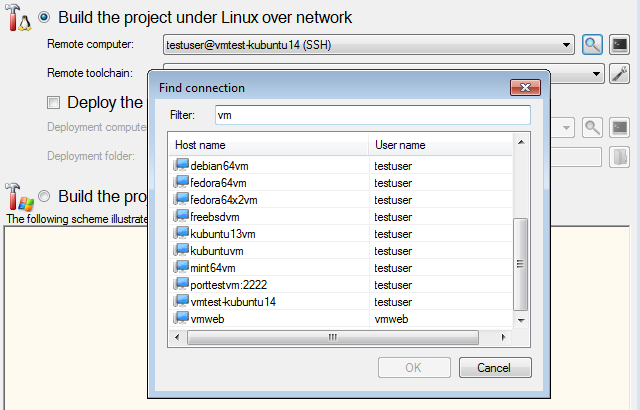
Linux Environment Diagnostics
One common source of problems reported by our users was the
de-synchronization of Linux environment. The environment
variables set in .bashrc would appear in normal console
sessions, but will be ignored when an SSH client like VisualGDB
launches a program directly. Now VisualGDB routinely checks for
such inconsistencies as a part of the toolchain testing and can
compensate for the environment differences: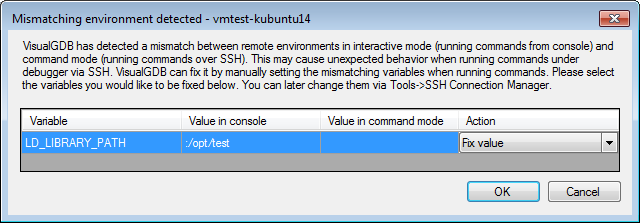
Improved Deployment Experience
VisualGDB is now a bit smarter when it comes to deploying
your executables to a Linux machine. First of all, it will now
check if it has been modified since the last deployment and will
skip re-deployment if not (can be configured via settings).
Second of all, it will show a progress dialog during deployment
giving you an overview of what's going on: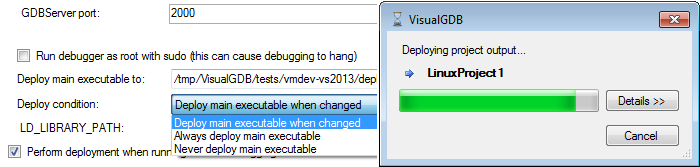
Integration with Visual Studio 14 CTP
VisualGDB 4.3 now supports Visual Studio versions from 2005 to 14.
GDB Command Timing Analysis
For those who are concerned with the debugging performance
and want to optimize every bit of it we have added a special GDB
command timing analysis mode. It shows the time that took the
GDB debugger to run each of the commands issued by VisualGDB, so
you can easily find bottlenecks and adjust your settings to
avoid them: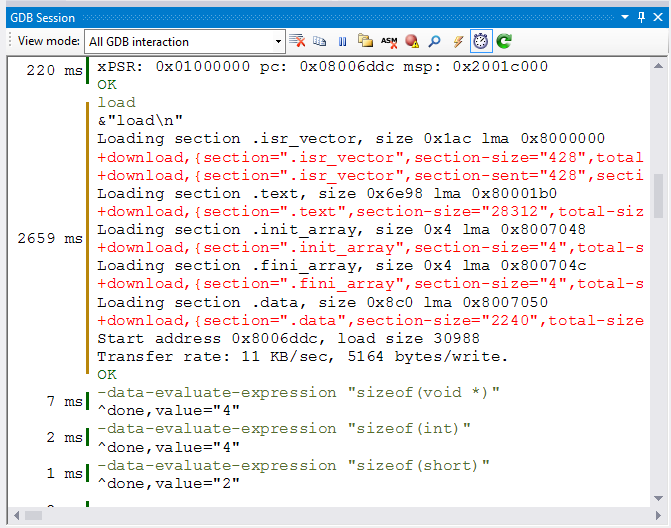
Lots of bug fixes and minor improvements
We have fixed a lot of small bugs and annoyances reported by our users. Have a look here for a more detailed change log or try out the new version on the download page.