Co-Debugging JNI with Android Studio and Visual Studio
Warning! This tutorial uses outdated versions of VisualGDB and Android Studio. Please follow the new Gradle Flavors tutorial to learn how to use VisualGDB 5.0 with Android Studio 1.3.
This tutorial shows how to debug a sample Android app with native code with both Android Studio and Visual Studio:
- Android Studio will be used to debug the Java part of the project
- Visual Studio will be used to debug the C/C++ part of the project
Both debuggers will be attached to the application at the same time without interfering with one another.
Before you begin, please install VisualGDB 4.3 or later and Android Studio.
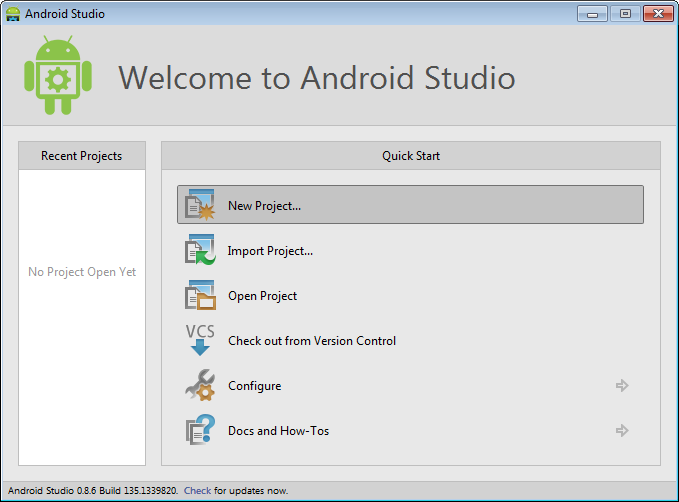
- Launch Android Studio. Begin creating a new project:
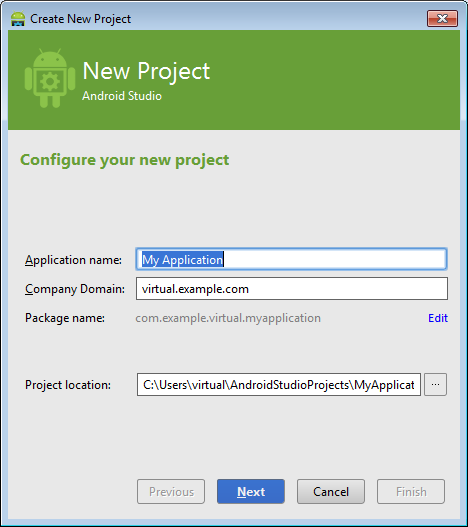
- Specify application name and domain:
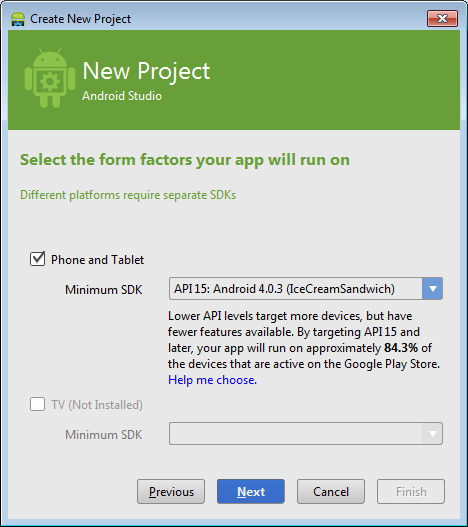
- On the next wizard page specify the platform:
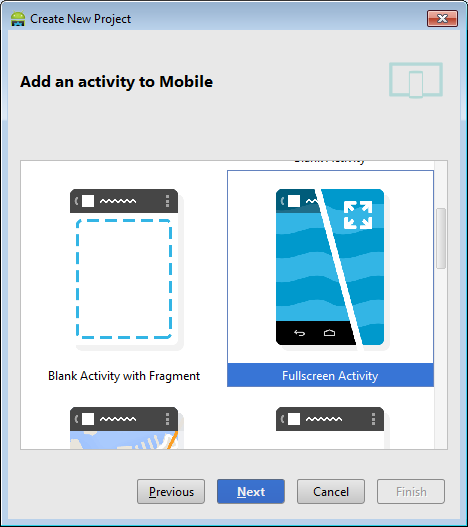
- On the activity selection page select “Fullscreen activity”:
- Proceed with the default activity name:
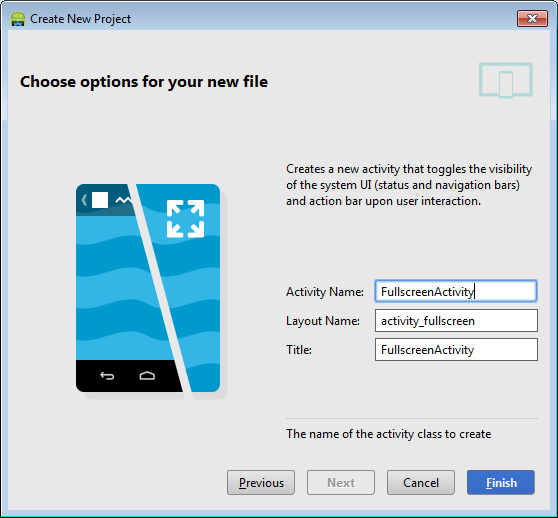
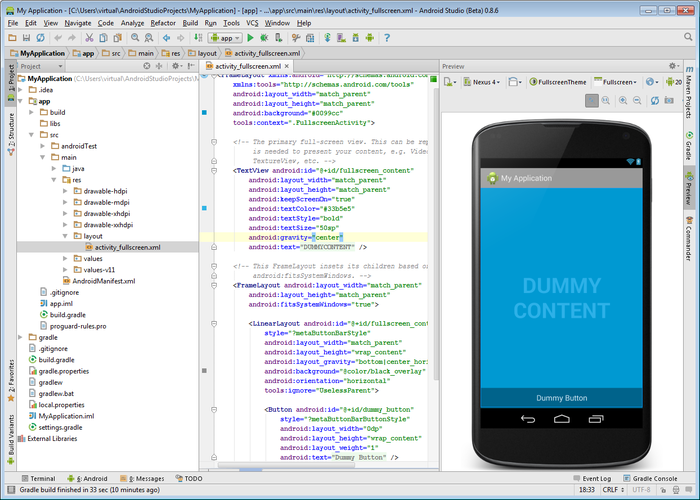
- Once you press “Finish”, Android Studio will create your project:
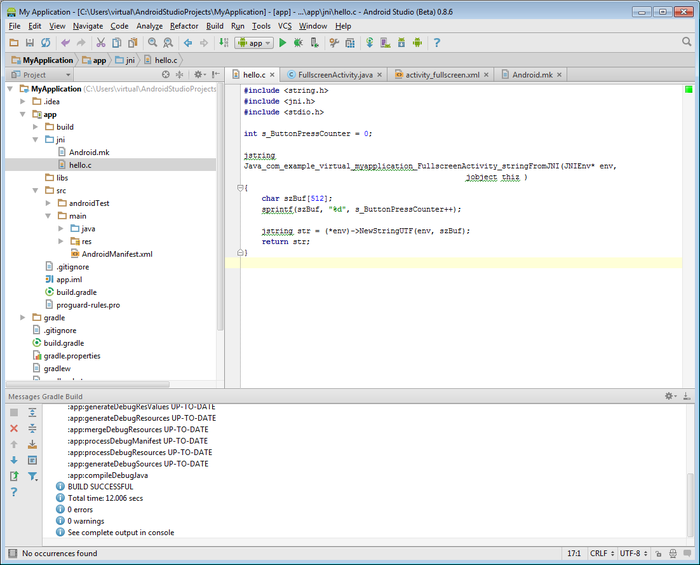
- Now it’s time to add some native code. Create a jni folder under the app folder (switch to the Project view from the Android view on the Project pane) and add 2 files with the following content:
- hello.c:
#include<string.h>
#include <jni.h>
#include<stdio.h>

int s_ButtonPressCounter = 0;

jstring
Java_com_example_virtual_myapplication_FullscreenActivity_stringFromJNI(JNIEnv* env, jobject thiz)
{
    char szBuf[512];
    sprintf(szBuf, "%d", s_ButtonPressCounter++);

    jstring str = (*env)->NewStringUTF(env, szBuf);
    return str;
}
Note that the name of the function should match the name of your package and activity!
- Android.mk:
LOCAL_PATH := $(call my-dir)

include $(CLEAR_VARS)
LOCAL_MODULE := HelloLibrary
#VisualGDBAndroid: AutoUpdateSourcesInNextLine
LOCAL_SRC_FILES := hello.c
include $(BUILD_SHARED_LIBRARY)
Ensure that the jni folder is on the same level as the src folder:
 Do not use the default Android Studio’s JNI folder! As of version 1.0.1 the normal JNI integration is broken and will result in various build and debug problems. If you put your JNI folder on the same level as the src folder, VisualGDB will handle the JNI build and resolve all problems automatically.
 - hello.c:
- Add the following code to FullscreenActivity.java:
public native String stringFromJNI();

static {
    System.loadLibrary("HelloLibrary");
}
and the following inside the onCreate() method:
final Button button = (Button)findViewById(R.id.dummy_button);
button.setOnClickListener(new View.OnClickListener() {
   public void onClick(View v) {
       String str = stringFromJNI();
       button.setText( str);
   }
});
Then build your app and try debugging it:
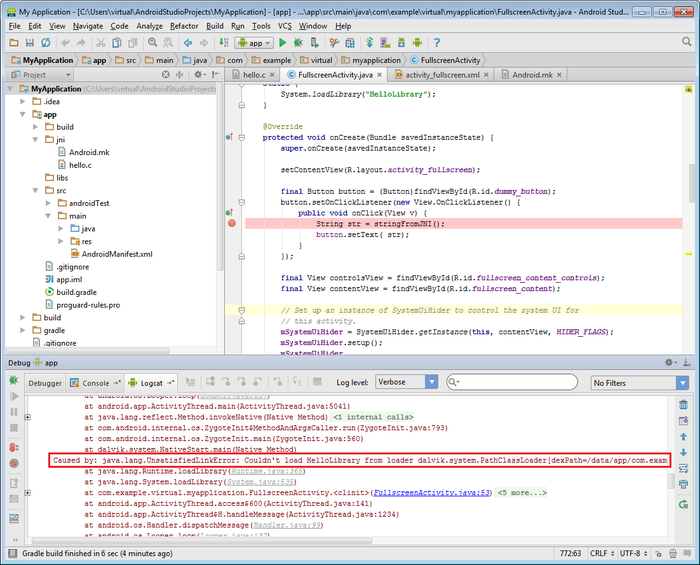 The loader will report a missing library. This happens because Android Studio (as of October 2014) does not build native libraries automatically. We will fix this in the next step.
 - Start Visual Studio and create a VisualGDB Android project:
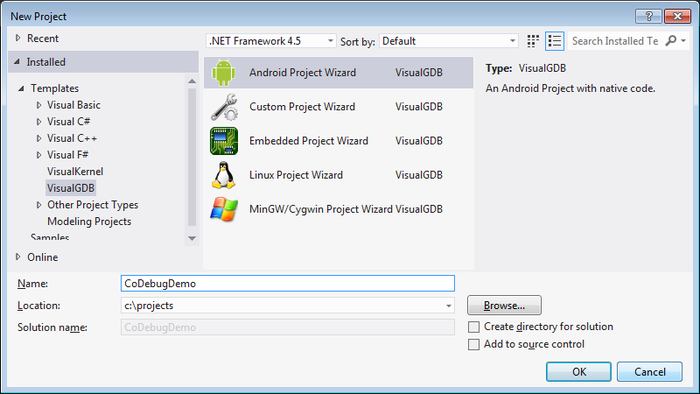
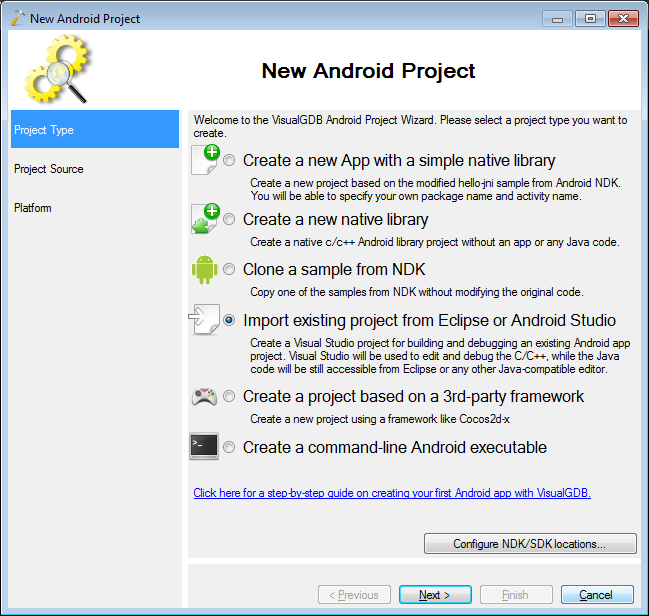
- Select “Import existing project”:
- Point the VisualGDB wizard to the location of your Android Studio project:
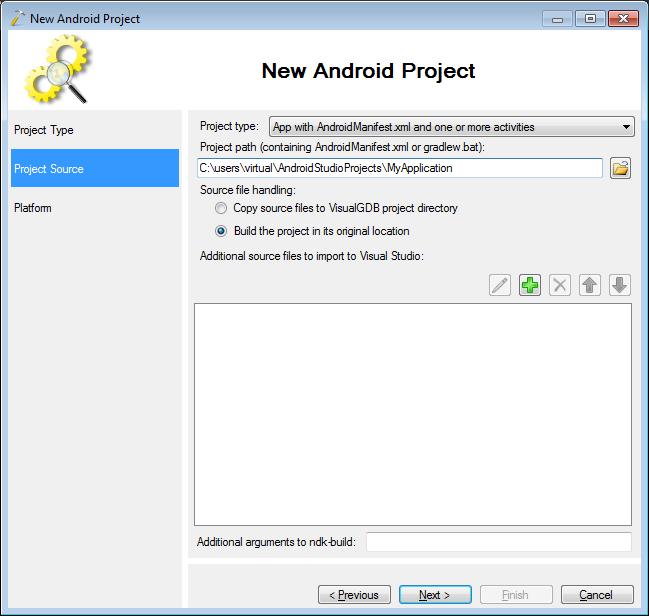
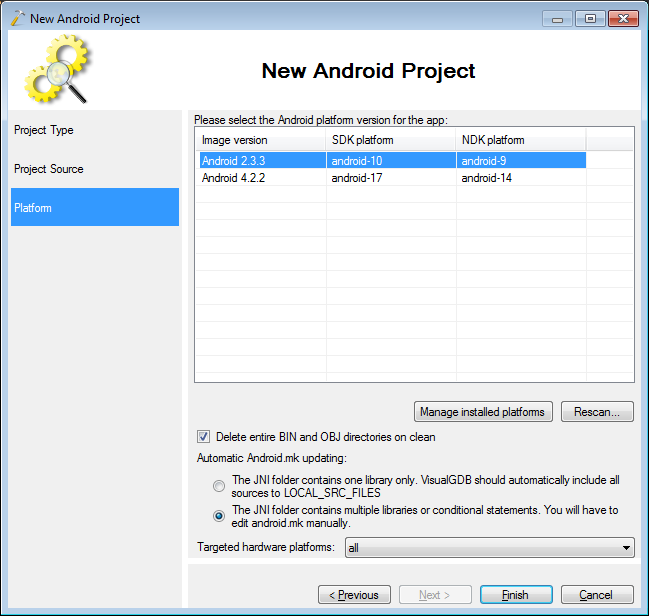
- Select the targeted platform:
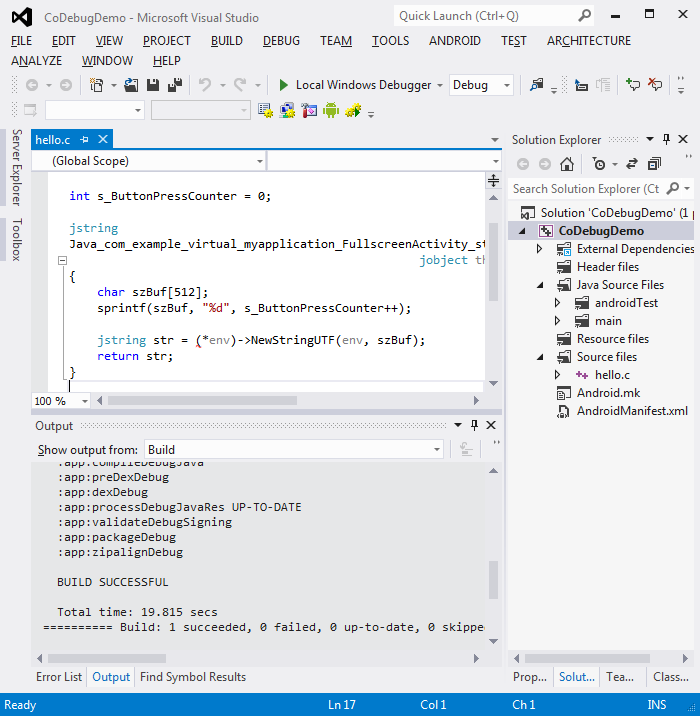
- Press “Finish”. VisualGDB will import your project into Visual Studio. Build it by pressing Ctrl-Shift-B:
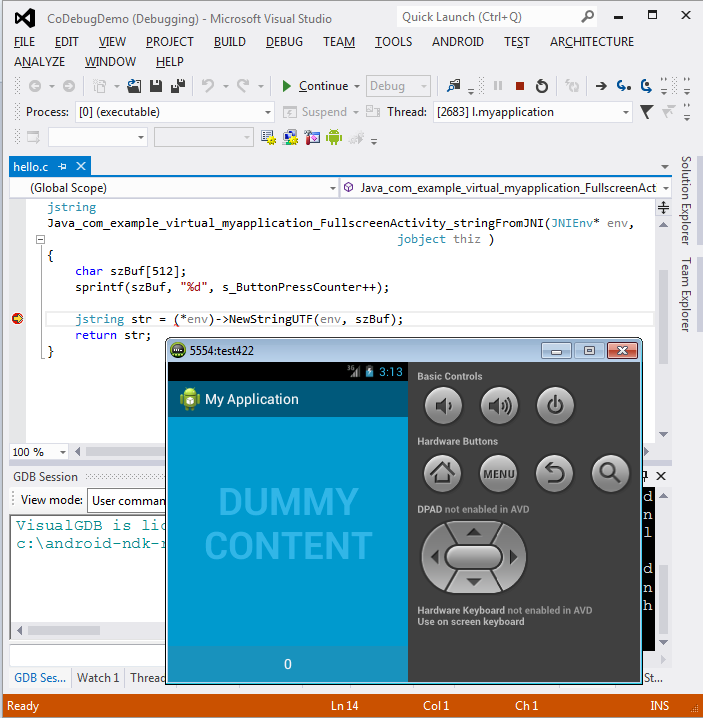
- Start an Android emulator or connect a physical device. Put a breakpoint inside the function in the .c file and press F5 to start debugging. Ensure that the “Debug app startup” feature is disabled while Android Studio is running in the background:

- Click the center of the screen so that the “dummy button” appears. Click the button. Your breakpoint will be triggered:
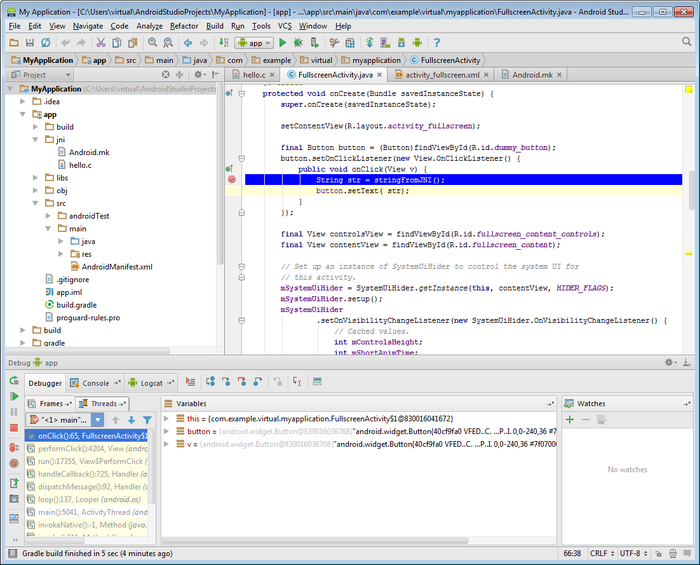
- With Visual Studio you can debug the C/C++ part of your app, but not the java part. We will now use Android Studio to debug the Java part simultaneously with the C/C++ debugging. Stop debugging by pressing Shift-F5. Go to Android studio, put a breakpoint on a call to stringFromJNI() and begin debugging:
- Once the breakpoint triggers, go back to Visual
Studio and start debugging. VisualGDB will ask if you want
to attach to an existing instance. Select “attach” and set a
breakpoint on the sprintf() line: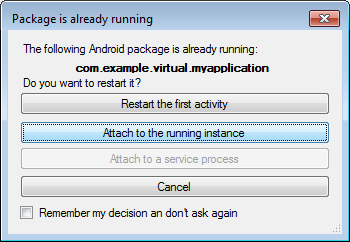
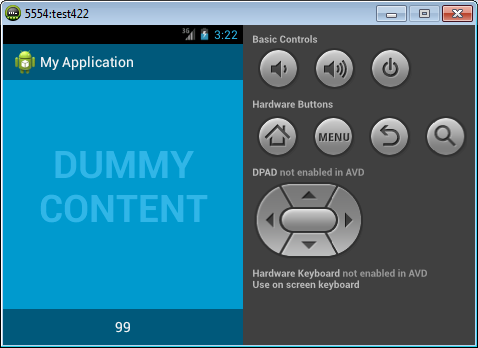
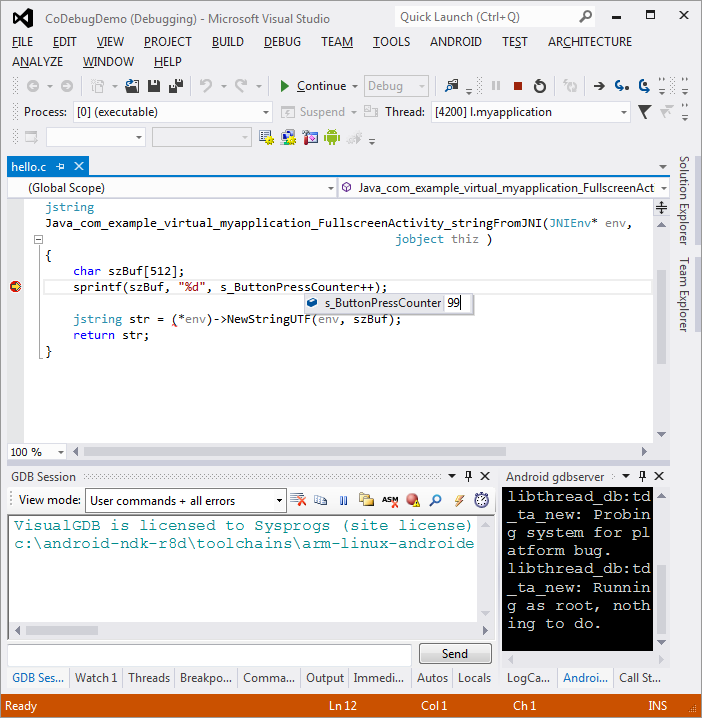
- Go to Android Studio and select ‘step over’ The VisualGDB breakpoint will trigger. Modify the value of the counter to 99:
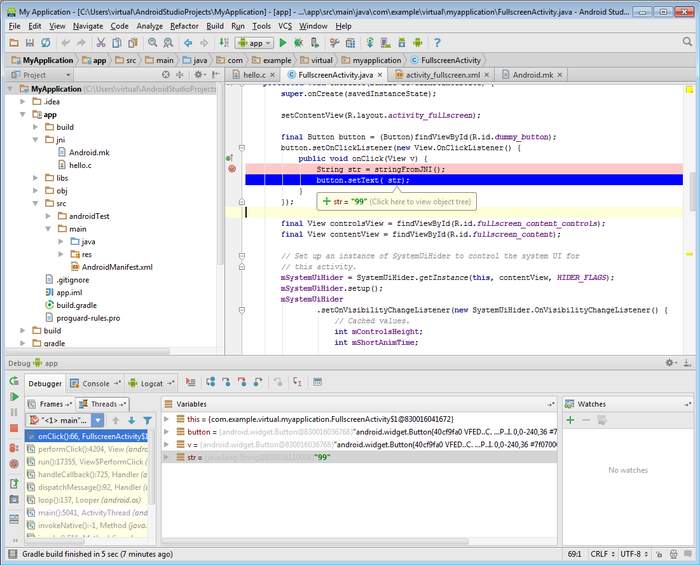
- Press F5 to continue debugging. Android Studio will step out of the C function showing the value we entered in Visual Studio:
- Resume the execution of your app. See how the button text is updated with the value we set: