VisualGDB – Debugging App Startup
One big problem with debugging NDK-based Android code is the impossibility to debug code that runs during App startup. E.g. if your native function is called from an onCreate() method of your Java app, you won’t be able to stop at a breakpoint when the function is called if you are using normal ndk-gdb script.
This article explains why those breakpoints are missed normally and how VisualGDB fixes it.
When you start debugging your app with ndk-gdb or other NDK-based tools, the events shown on the diagram below happen:
- ndk-gdb deploys and launches your app. The app starts running immediately and the startup code gets executed.
- ndk-gdb queries the PID of your app and starts gdbserver.
- Finally, ndk-gdb starts gdb and connects it to the server. Only at this point the breakpoints are set.
If your startup code is executed fast enough, it will finish running before gdb manages to attach and set any breakpoints. Thus, the breakpoints will be missed.
The VisualGDB Solution
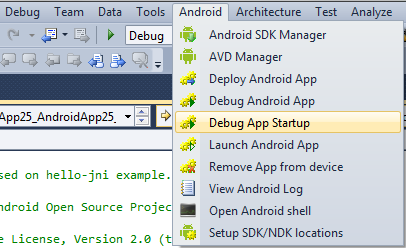
VisualGDB provides a special Startup debugging mode (select Anrdoid -> Debug App Startup in Visual Studio). In this mode the app is launched in a suspended mode and is only resumed after all breakpoints are set:
Restrictions
- The App Startup debugging is a special debugging mode. To start it, use Android -> Debug App Startup command. The normal Debug Android App command will still work just like ndk-gdb without trying to suspend your app.
- Do not let Eclipse or DDMS run in background! VisualGDB uses a special internal tool based on DDMS back-end that resumes the suspended Android apps. Due to restrictions of DDMS back-end, running Eclipse ADT or DDMS itself in the background will interfere with the app resuming tool and will prevent you from debugging your apps. If you encounter problems, double-check everything and ensure that there are no leftover java.exe instances in Task Manager.
- Use gdb 7.x provided with VisualGDB. The older gdb 6.6 that comes with Android NDK does not support pending breakpoints and will not be able to set them correctly. The gdb 7.x is enabled by default when you use VisualGDB and can be disabled in VisualGDB project settings.
As using the App Startup debugging mode imposes additional restrictions, VisualGDB does not enable it by default. When you use the normal Debug Android App command, the startup breakpoints will be missed (just like with ndk-gdb), but running Eclipse in parallel or using an older gdb won’t interfere with your debugging.