Debugging vs-android projects with VisualGDB
This tutorial explains how to debug native Android projects made with vs-android in Visual Studio
- First ensure that your vs-android project can be built properly. If you cannot make it work, please consider using VisualGDB Project wizard instead. In this tutorial we will use the san-angeles project from the vs-android samples.
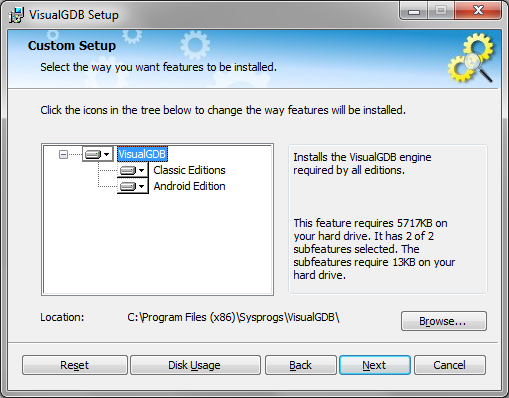
- Download the latest VisualGDB. If you are using custom installation, ensure that Android Edition is selected for installation:
- Open Visual Studio, click at Android->Setup SDK/NDK locations. Enter the locations of your Android tools or use the “Detect” buttons to try detecting them automatically:
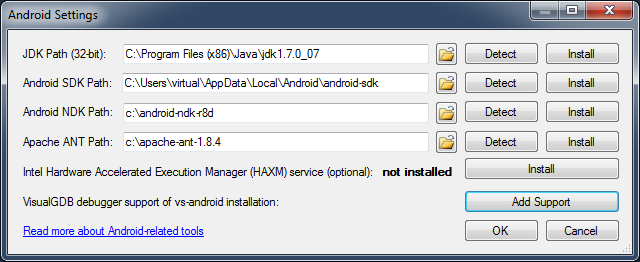 If you want to debug your vs-android projects with F5, you need to enable this feature here by pressing “Add Support”.
 - Open your vs-android project (in this example we use the san-angeles sample). Open the AndroidManifest.xml file inside the AndroidApk folder and set the android:debuggable attribute to “true”:
<application android:label="@string/app_name" android:debuggable="true"> <!-- Your activities are listed here --> </application> - In this tutorial we set a breakpoint inside the drawGLObject() function. You can set breakpoints anywhere in the code before and during debugging, just like in normal Visual Studio projects.
- Select Android->Debug Android App in Visual Studio:
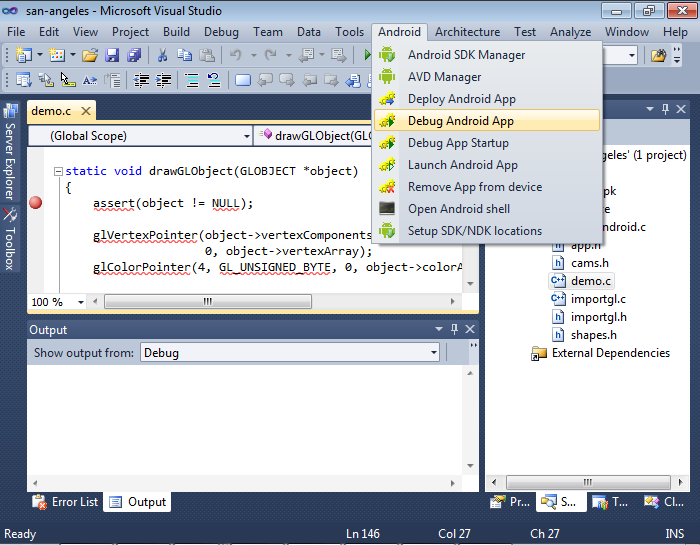 If the debug commands are not displayed, please select your project as startup project in the solution.
Important note: VisualGDB 5.0+ supports clang-based IntelliSense for vs-android projects. Read more in this tutorial. - If you encounter a message about inconsistent signature, please use the Android->Remove App from device command.
- If you are debugging the project for the first time, VisualGDB will detect that gdbserver is missing and suggest auto-installing it. Please click “yes”, then rebuild your project with Build->Rebuild Solution.
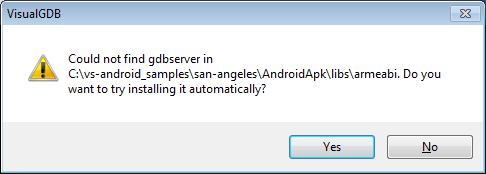 If you do not rebuild the solution, gdbserver will not be put inside the apk file and debugging won’t be possible.
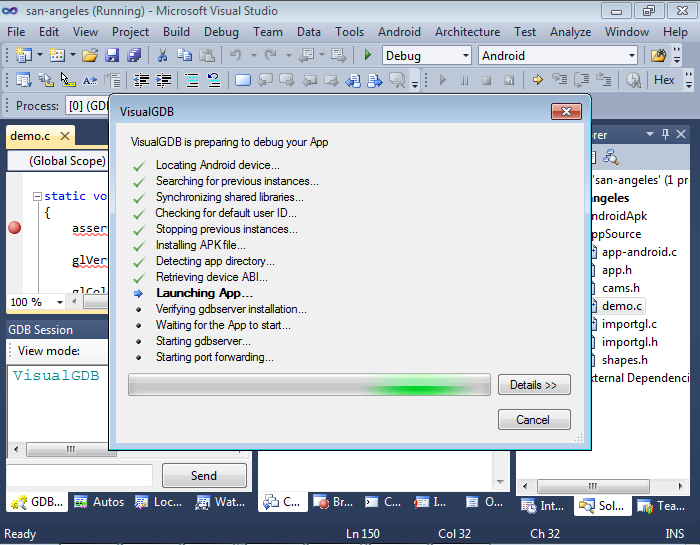
 - Click Android->Debug Android App again. VisualGDB will begin deploying your project and preparing the debugging session:
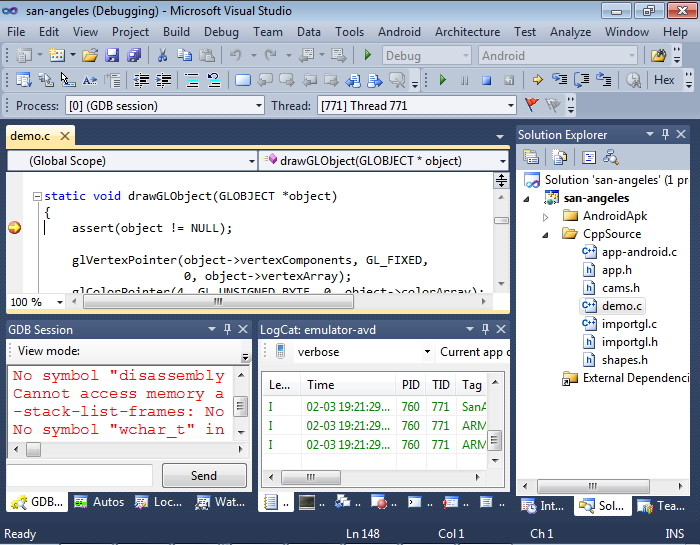
- If you have previously set a breakpoint at a location that gets executed, your breakpoint will be triggered:
- Go to Project Properties, select Debugging page and ensure that you have VisualGDB Android Debugger selected:
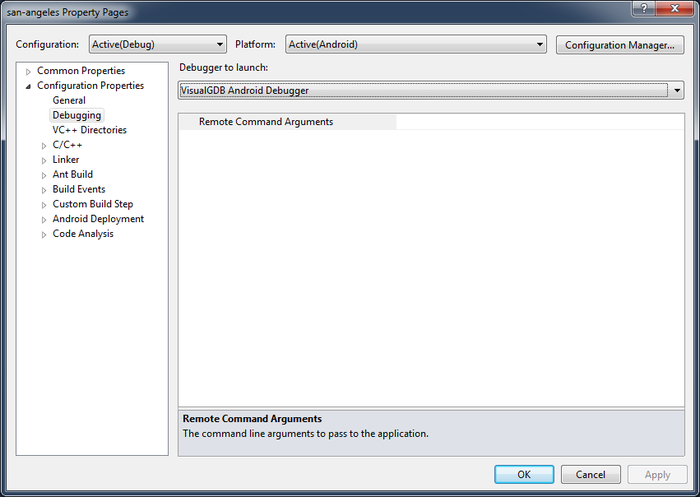 Note that the Android Debugger won’t appear in the list unless you enable it from the Setup NDK/SDK locations dialog.
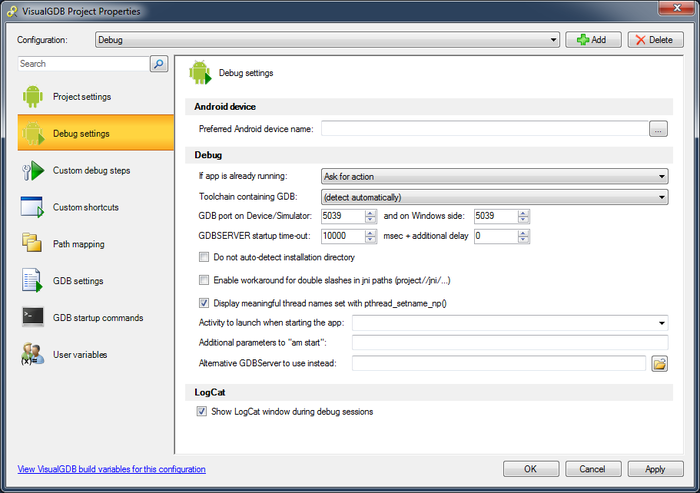
 - You can configure VisualGDB-specific settings for your vs-android projects by right-clicking on the project and selecting VisualGDB Project Properties:


Congratulations! You can now debug your app. You can also setup Visual Studio to use the original NDK build system by following this tutorial.