Diagnostic GDB Logging
VisualGDB aims to simplify your debugging experience. if
your GDB debugging session fails due to an error or exits
without hitting any breakpoints, VisualGDB will let you
review the GDB interaction log to pinpoint any problems that
could be causing it: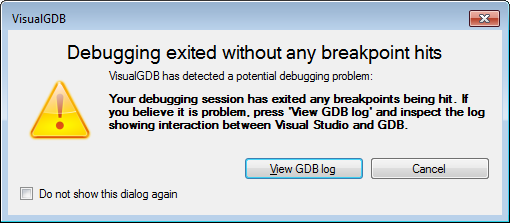
You can also let VisualGDB write GDB interaction logs each
time you debug a VisualGDB project. Simply open
VisualGDB Project Properties window and
enable the log creation: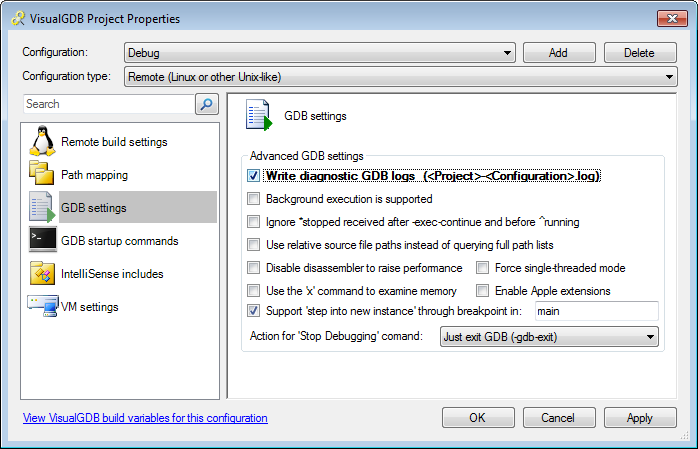
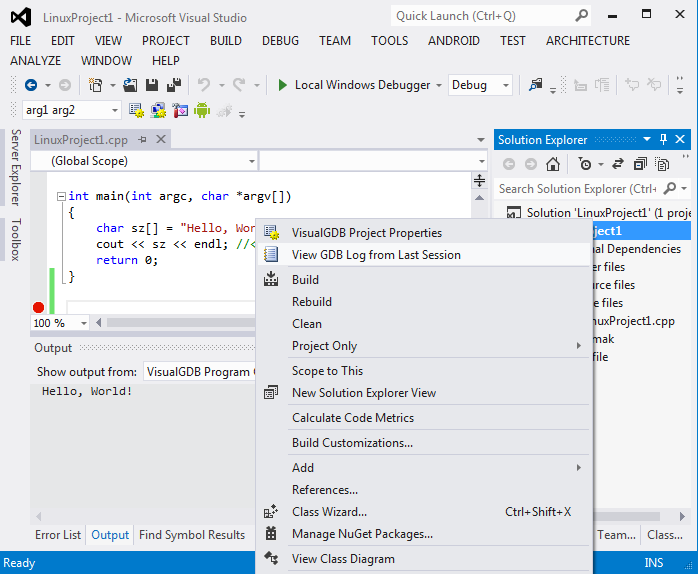
The log files will be created in your project directory. You
can view the last log file by right-clicking on the VisualGDB
project and selecting "View GDB log from last session":