Diagnosing breakpoint problems on Android
This tutorial shows how to solve breakpoint problems by using VisualGDB’s breakpoint diagnostics tool. Note that breakpoint diagnostics will work for all VisualGDB project types, not only Android projects.
Before you begin, please install VisualGDB 2.8 or later (ensure that “Android Edition” is checked in the installer).
- First follow the Android Quickstart tutorial to make a basic project. Make sure the project builds and runs, and that it stops at a breakpoint as described in the tutorial.
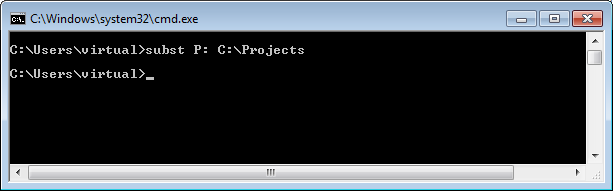
- In order to introduce a breakpoint problem, we use the subst command. Hence, close Visual Studio, open cmd.exe and enter there the substitute command to map the solution directory as follows
subst P: C:\Projects
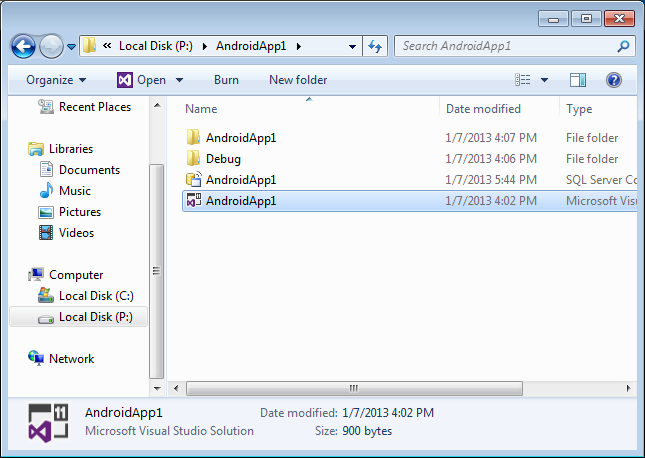
- Go to the newly created drive P: and open the Visual Studio solution from there.
- Start debugging. Do not rebuild the project, otherwise the paths will be fixed.
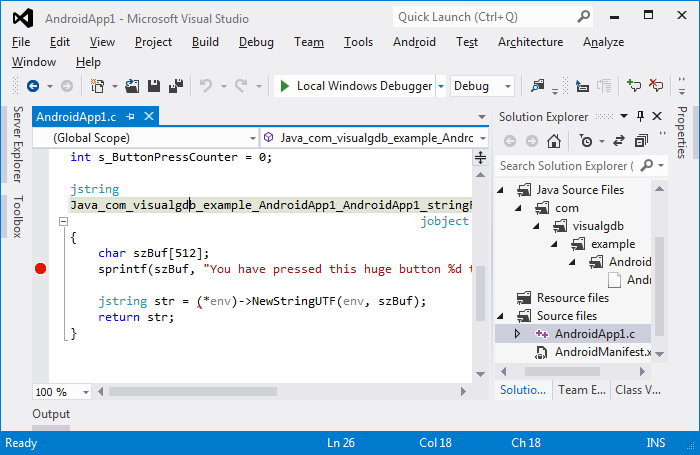
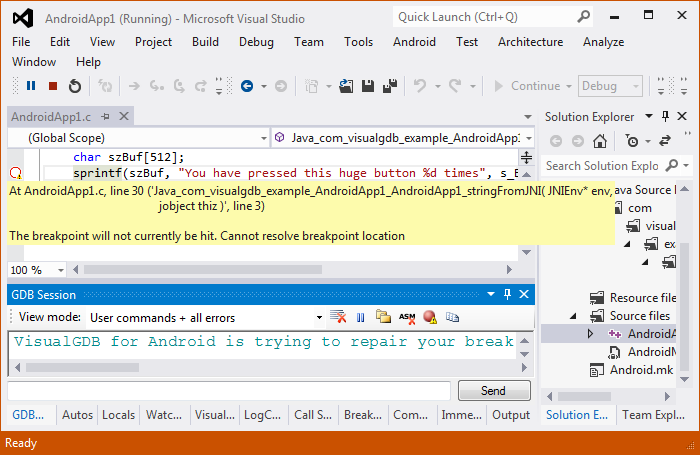
- Note that the breakpoint is now marked with a warning that the breakpoint location is unknown. This happens because you have built the project from c:\projects and GDB does not know that p:\AndroidApp1\jni\AndroidApp1.c (where you set the breakpoint) and c:\projects\AndroidApp1\jni\AndroidApp1.c (that is referred to in the symbols) is the same file.
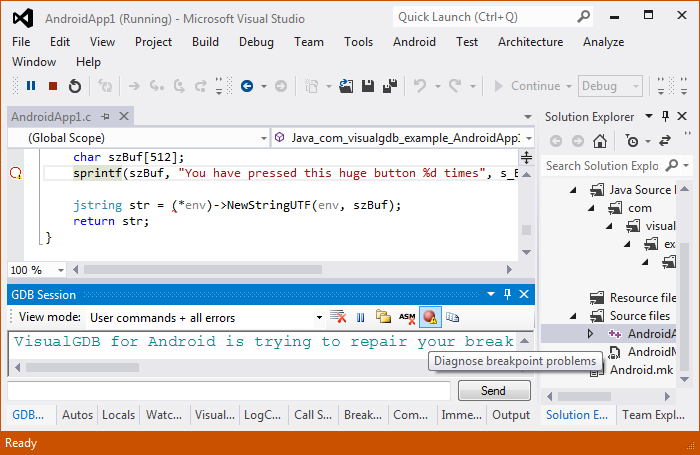
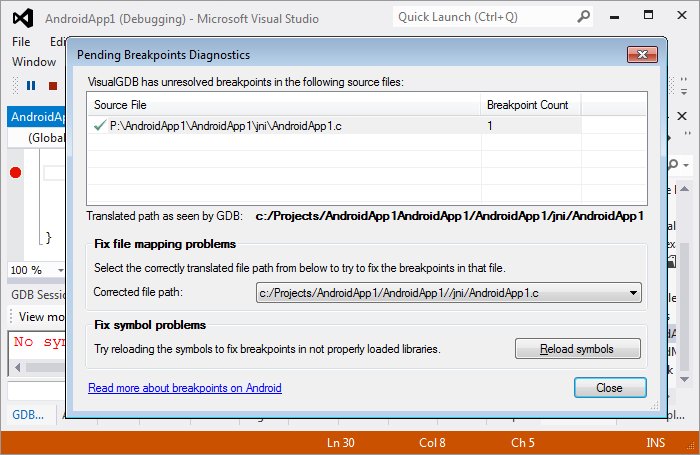
- Open the breakpoint diagnostics window from the GDB Session tool window.
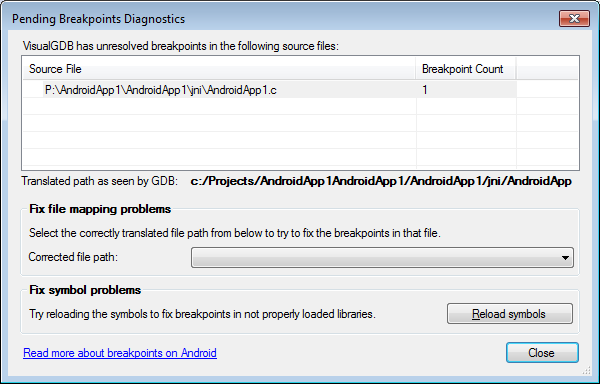
- Select the source file with the problem. Note that the file is located in P:\ as you have opened the solution there.
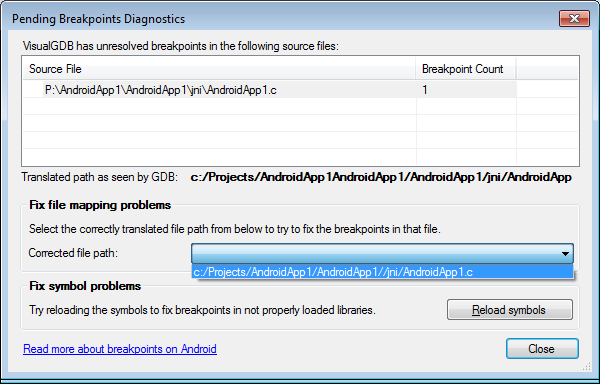
- Click at the ‘corrected file path’ combo box. VisualGDB will automatically suggest to use the file from c:\projects instead. Select it.
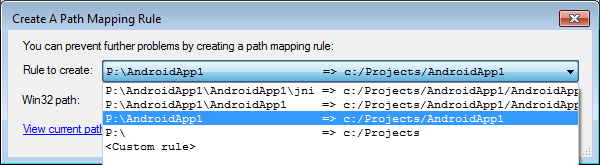
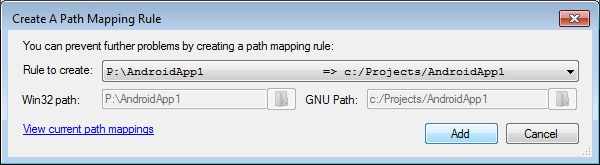
- Once the correct substitution is selected, VisualGDB can create a path mapping rule to automatically translate all other file names in this directory. Please select the appropriate rule from the suggestion list.
- Note that the breakpoint is now marked as fixed in both the diagnostics tool and Visual Studio.
- Close the diagnostics window and try to trigger the breakpoint. Hence click on the large button on the Android device screen. The breakpoint will now be triggered successfully.
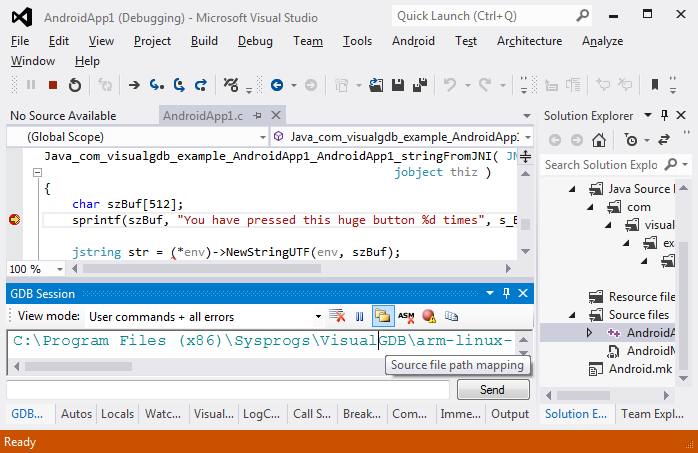
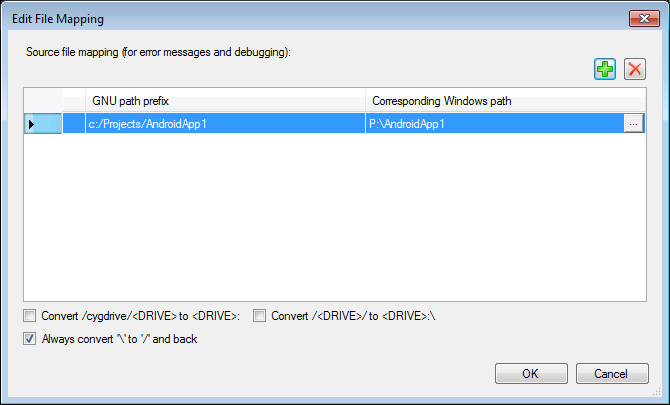
- You can always see the active path mappings by clicking at the corresponding icon in the VisualGDB session window. Note that the mappings are saved in the project settings and will be reestablished next time you start debugging.