Creating a command-line Android tool with VisualGDB
This tutorial explains how to develop and debug a command-line Android executable with Visual Studio.
Command-line Android tools are built using the “include $(BUILD_EXECUTABLE)” line and are supported by the Ultimate edition of VisualGDB 4.2 and later. Attaching to running tools is supported by VisualGDB 4.3+.
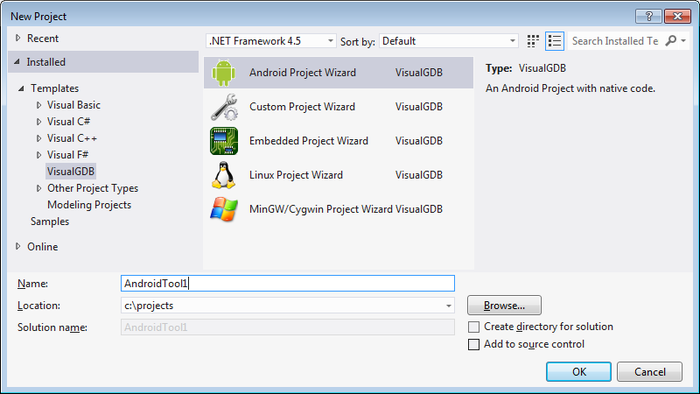
- Start Visual Studio. Begin creating a new project using VisualGDB Android Project wizard:
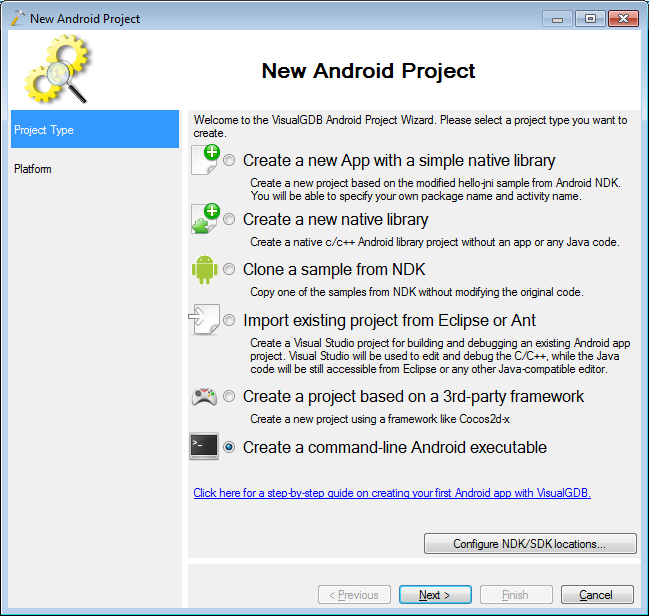
- Select “Create a command-line Android executable” in the wizard:
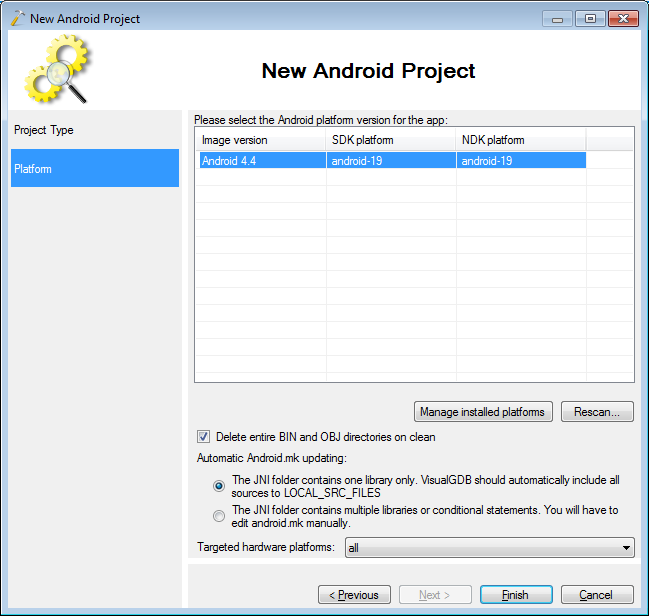
- Select the platform you are targeting on the second page of the wizard:
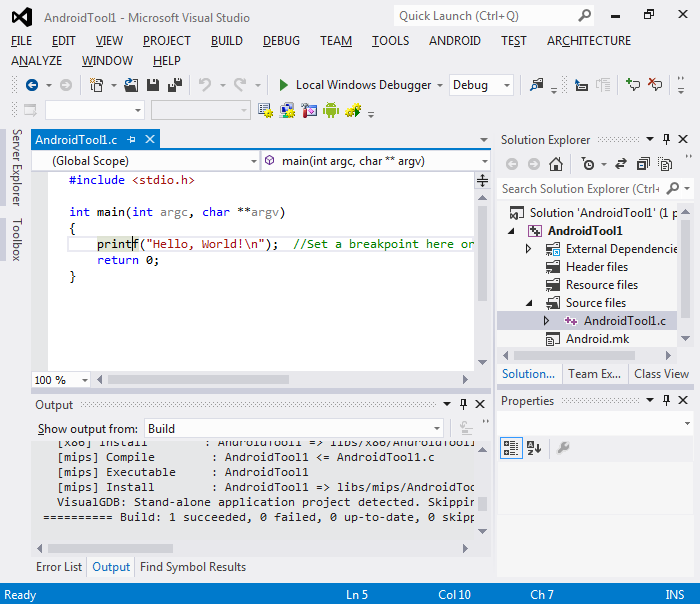
- Press Ctrl-Shift-B to build the tool:
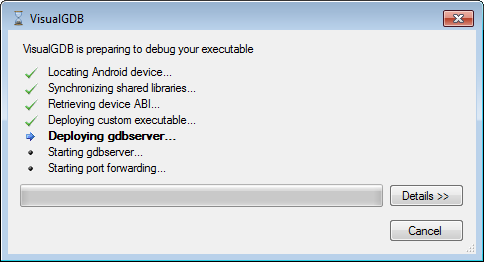
- Set a breakpoint on the printf() line, connect your Android device, install the drivers and press F5 to begin debugging. VisualGDB will deploy your tool on the device:
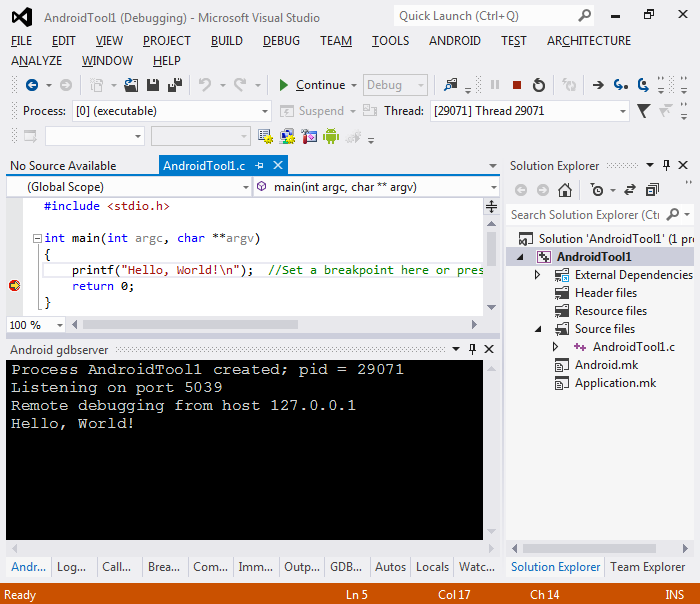
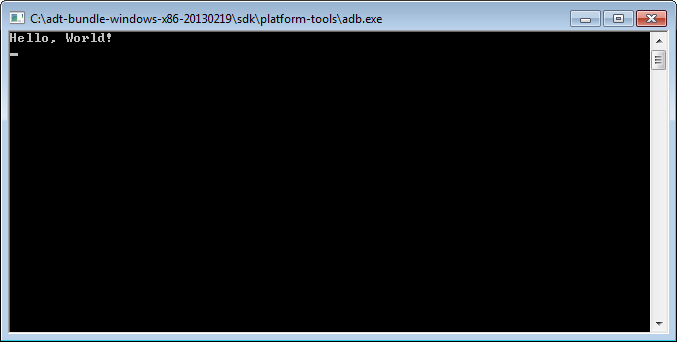
- Once the tool is deployed and launched, your breakpoint will be triggered:
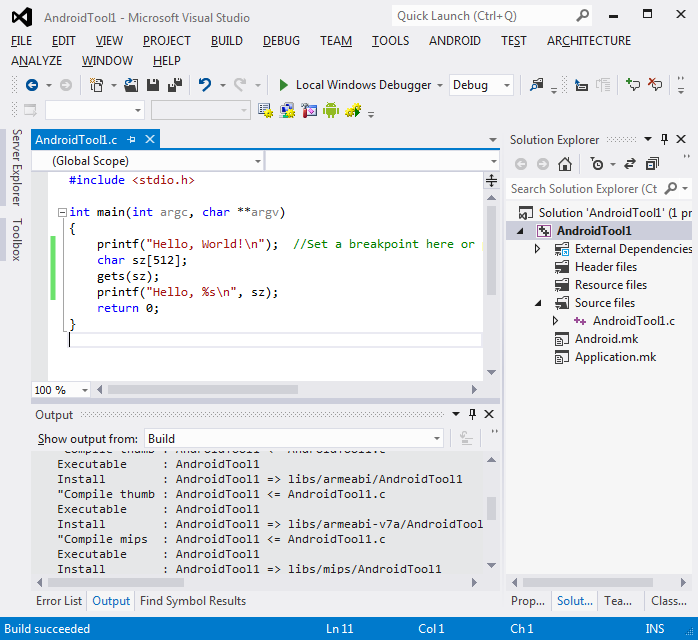
- Press F5 to let the tool run to the end. Now we will show how to attach to the tool. Change the source code so that the tool asks for the user input before exiting and build your tool:
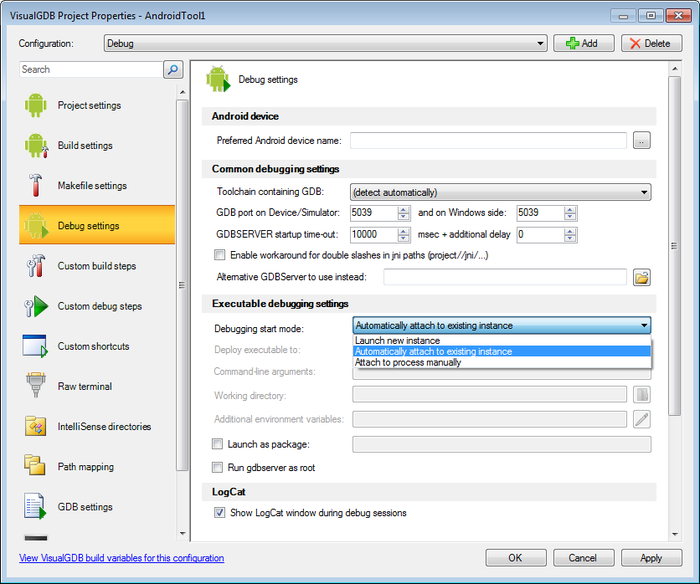
- Right-click on the project in Solution Explorer and select “VisualGDB Project Properties”. Go to the Debug Settings page:
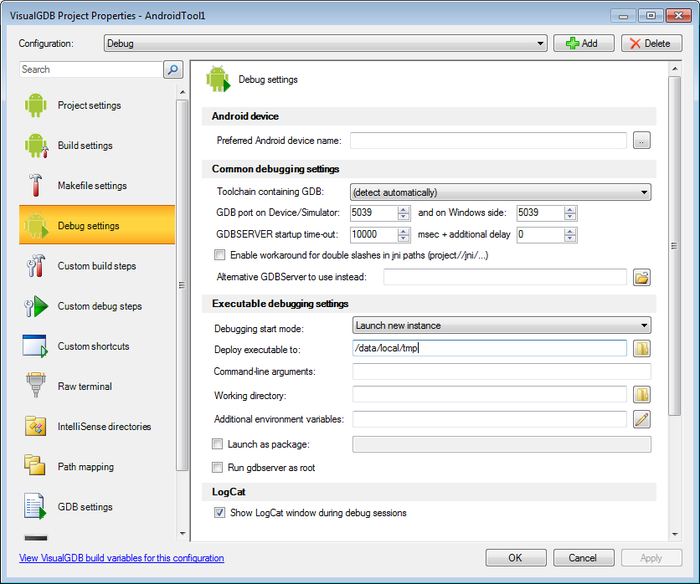
- You can see that the tool is deployed to /data/local/tmp. You can change the deployment location and other options from here. Close the properties window and press Ctrl-F5 to deploy and start the tool without debugging. Due to the limitations of the Android ADB tool you won’t be able to send the text to your tool in this mode, so simply press Ctrl-C to end it:
- Now we will launch our tool in the interactive mode. Select Android->Open Android Shell:
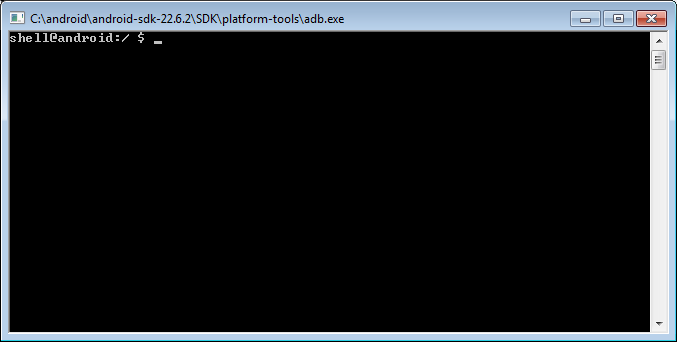
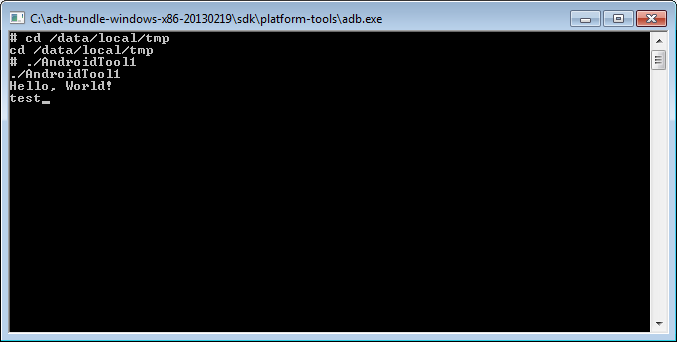
- Go to the deployment directory and launch the tool. Enter some text once the tool is running, but do not press Enter:
- Go back to VisualGDB Project Properties and select “Automatically attach to existing instance” on the Debug Settings page:
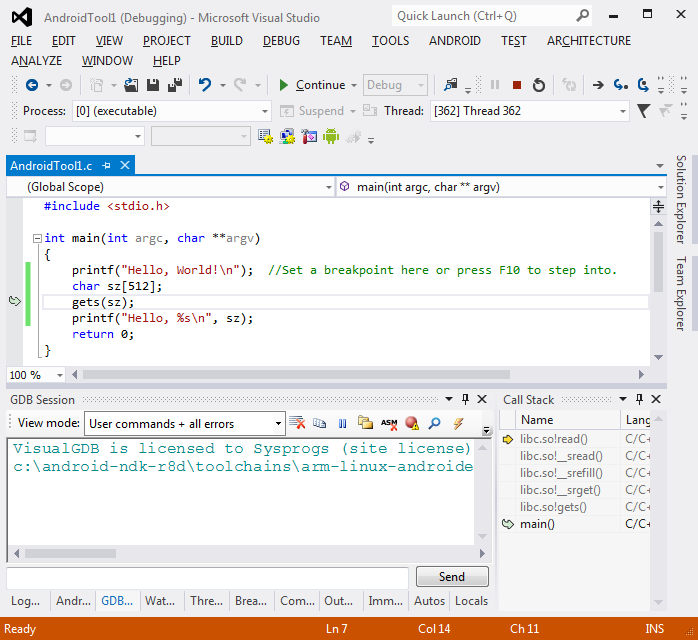
- Press F5 to begin debugging. VisualGDB will attach to your tool. Select Debug->Break All and examine the call stack. You will see that the tool is running the gets() function:
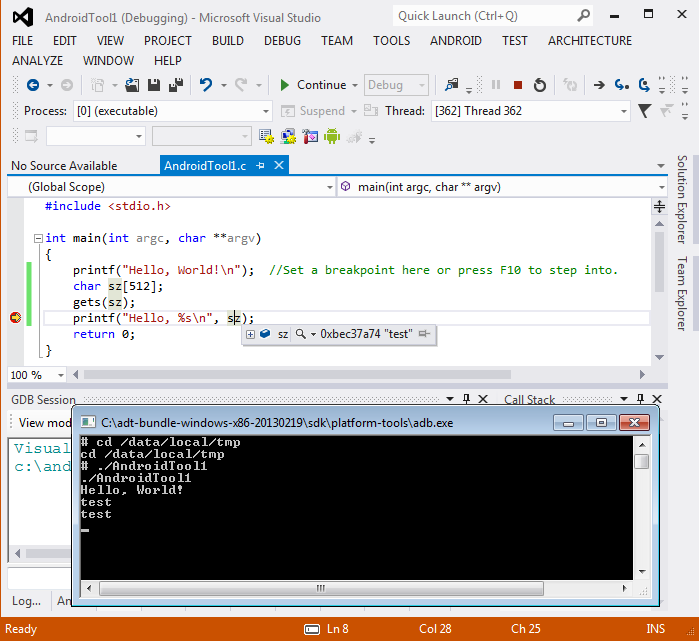
- Set a breakpoint on the last printf() call, resume execution and press Enter in the ADB console. The breakpoint will be triggered and you will see the line you entered:


If you want to create an app containing native code instead, follow our Android App tutorial.