Debugging native code on Android devices with the ‘run-as’ bug
This tutorial shows how to debug the native code in your Android apps on devices that do not support the ‘run-as’ command. We will first demonstrate how to reproduce the ‘run-as’ problem and then explain the workaround VisualGDB supports. Before you begin, install VisualGDB 5.1r5 or later.
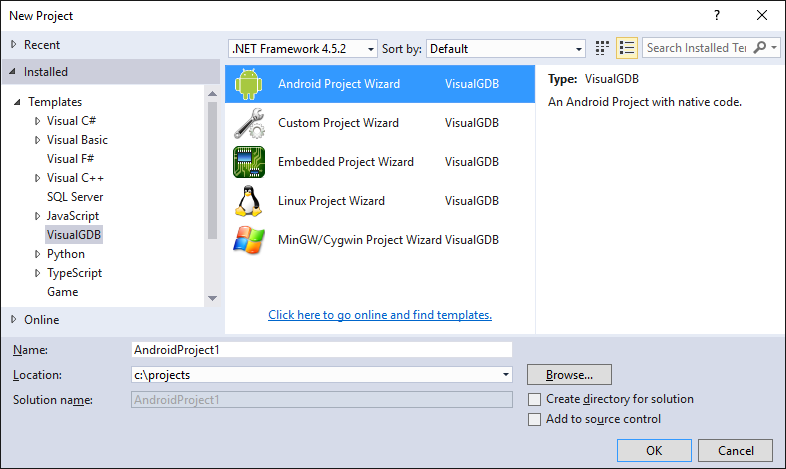
- Start Visual Studio and open the VisualGDB Android Project Wizard:
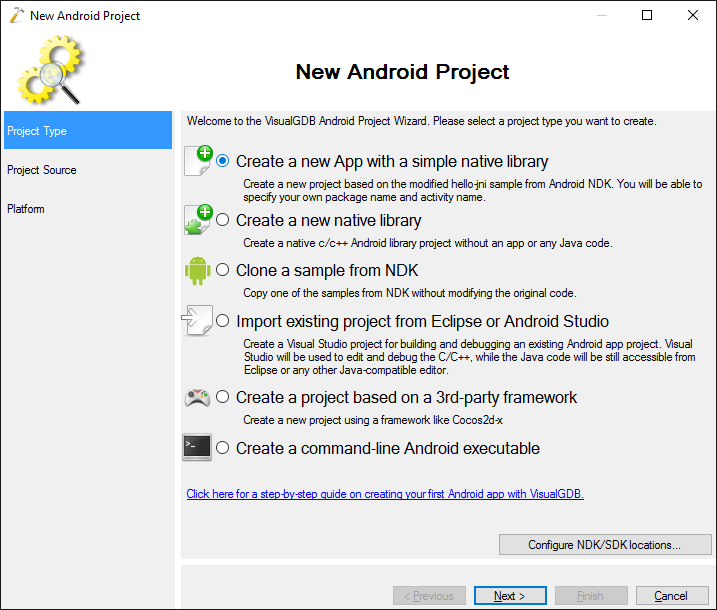
- Proceed with the default “Create a new App” selection:
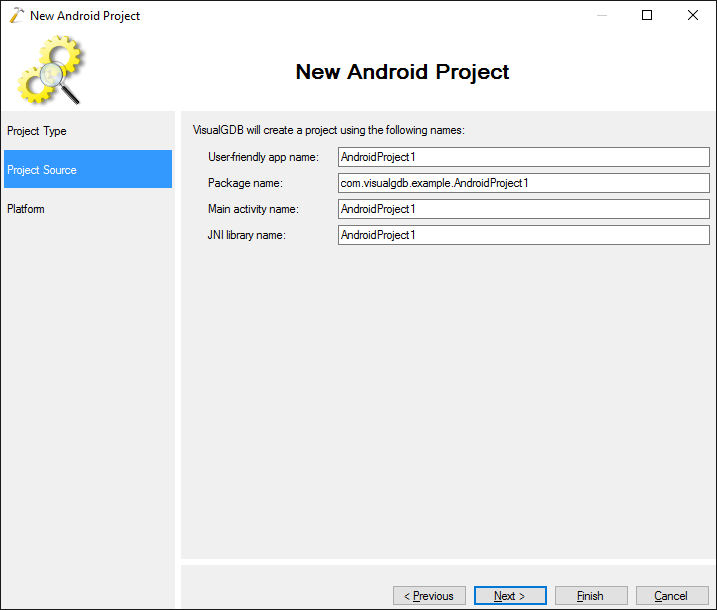
- On the next page proceed with the default app name and the package name:
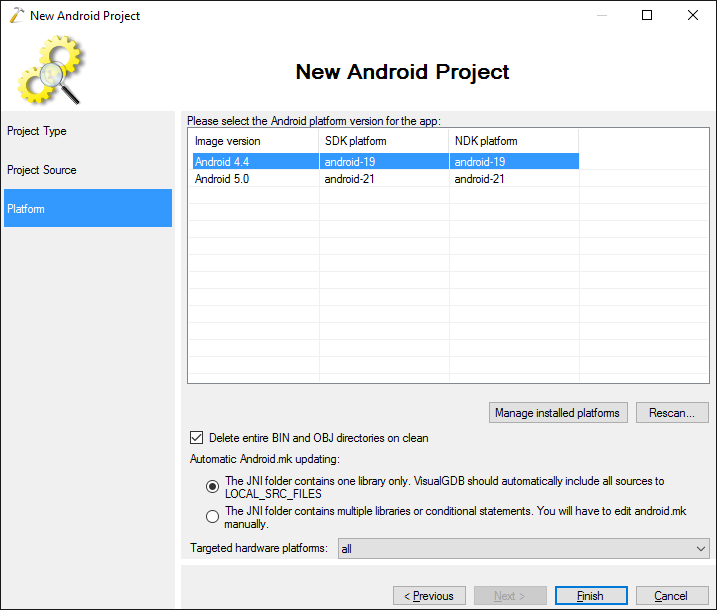
- Select your Android platform and press “Finish” to generate the project:
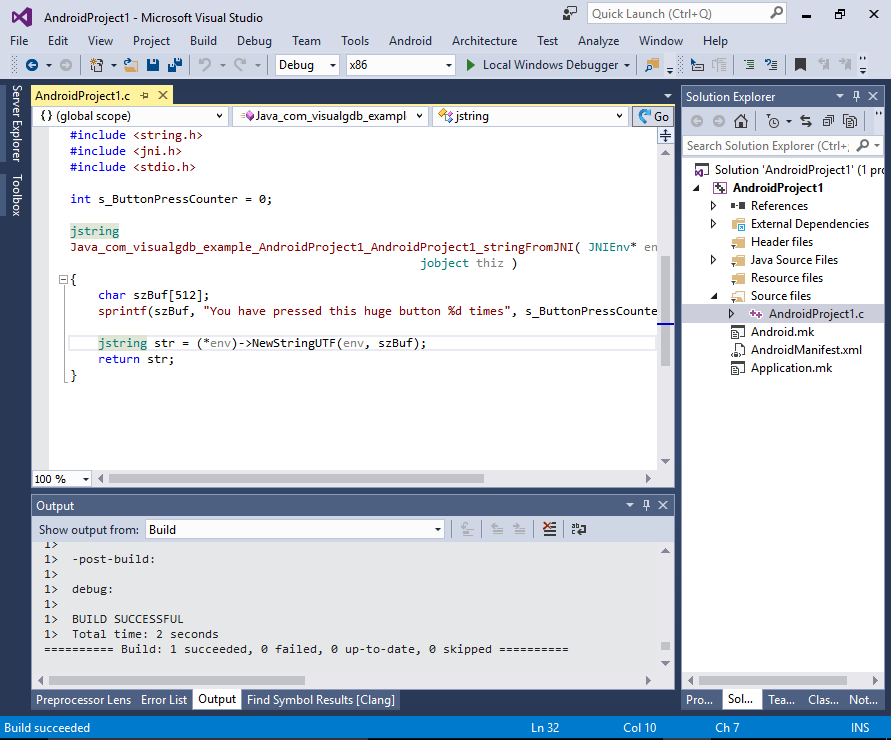
- Once the project is generated, press Ctrl-Shift-B to build it:
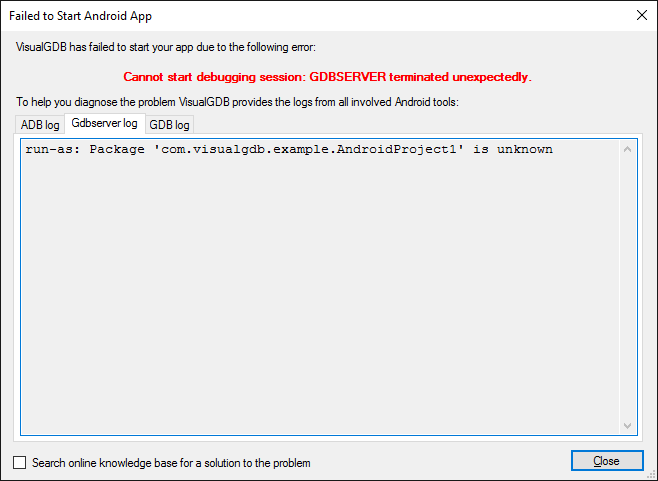
- If you try to debug it now on a device with the run-as bug without testing the toolchain, you will get the following error:
run-as: Package 'com.visualgdb.example.AndroidProject1' is unknown
 If you let VisualGDB test the toolchain, it will detect that the device needs the workaround and direct you to this page.
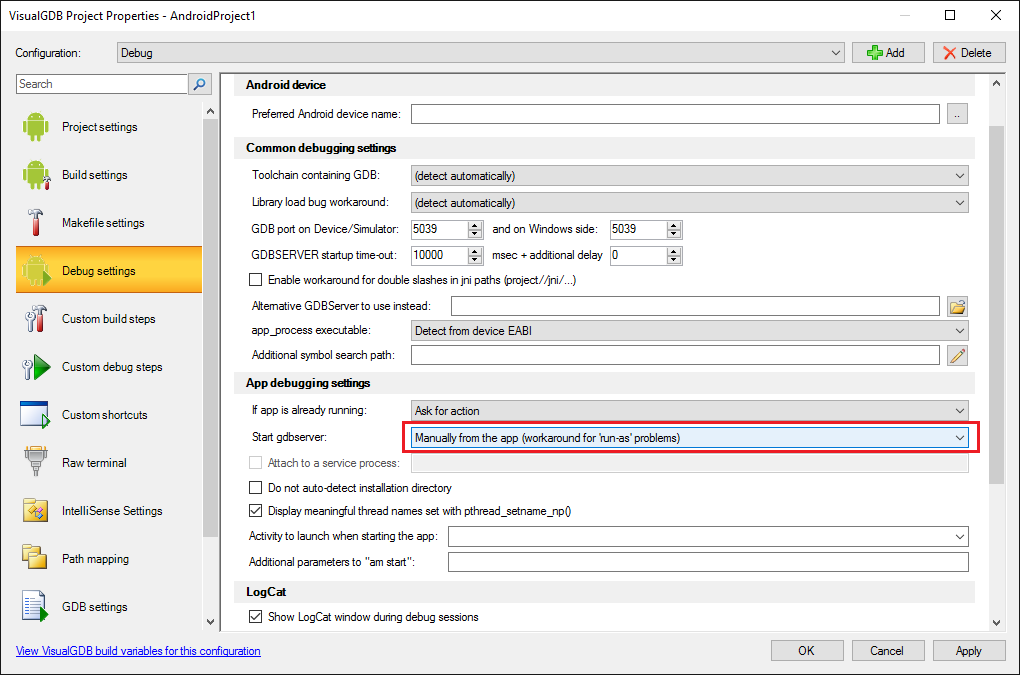
 - The problem happens because debugging native code in your app requires running gdbserver – a special tool that runs on the Android device and exposes the internals of your app to the debugger. If your Android device has too restrictive rights on the /data/system/packages.list file, the run-as tool won’t be able to read the file and launch gdbserver with the correct permissions. VisualGDB provides a workaround that allows launching the gdbserver directly from your app and connecting to it automatically. Open VisualGDB Project Properties, go to the Debug Settings page and select “Start gdbserver – manually from the app”:
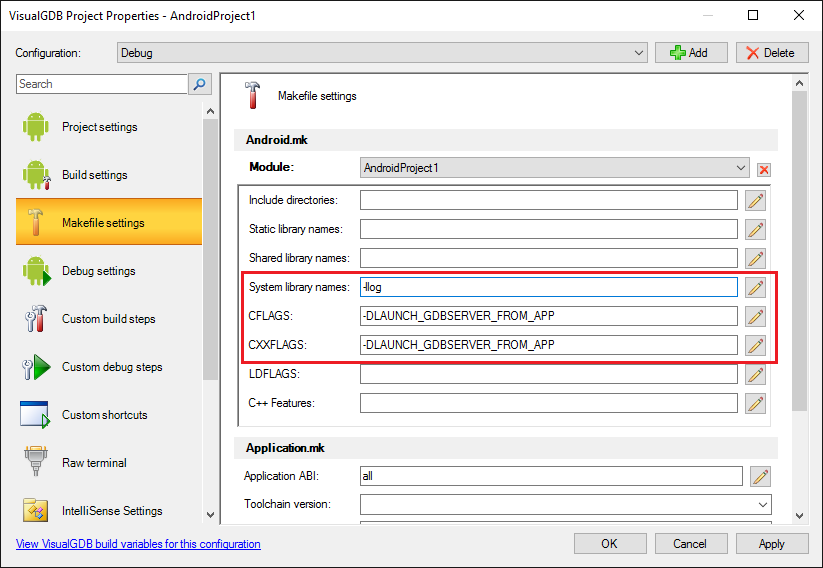
- This will automatically add a new file to your project that will be responsible for launching gdbserver. Before we look into that file, go to the Makefile Settings page of VisualGDB Project Properties and add “-DLAUNCH_GDBSERVER_FROM_APP” to both CFLAGS and CXXFLAGS and also add “-llog” to the System Library Names:
- When you press OK, VisualGDB will add a file called gdbserver_launcher.c to your project. The main role of that file is to launch the gdbserver executable shipped with your app and redirect its output to a socket so that VisualGDB can display any errors it reports:
static void DoLaunchGDBServer(const struct ControlBlock *pBlock, int socket)
{
    char pid[32], port[32];
    sprintf(pid, "%d", getpid());
    sprintf(port, ":%d", pBlock->GDBServerPort);

    if (fork() == 0)
    {
        dup2(socket, STDOUT_FILENO);
        dup2(socket, STDERR_FILENO);

        int r = execl(pBlock->GDBServerPath,
            "gdbserver",
            port,
            "--attach",
            pid,
            NULL);

        //if execl() succeeds, control will never reach here
        __android_log_print(ANDROID_LOG_ERROR, AppName, "Failed to launch %s: error %d", pBlock->GDBServerPath, r);
    }
}
- The logic responsible for launching gdbserver will be automatically triggered when the library using the gdbserver_launcher.c is loaded:
__attribute__((constructor)) void GDBServerInitializer()
{
    LaunchGDBServer();
}
As the native library does not have access to the Java environment and cannot determine the gdbserver location, it will simply open a socket and rely on VisualGDB to tell it the location of the gdbserver and the port to use. VisualGDB will do it automatically as long as you have the workaround enabled in Debug Settings.
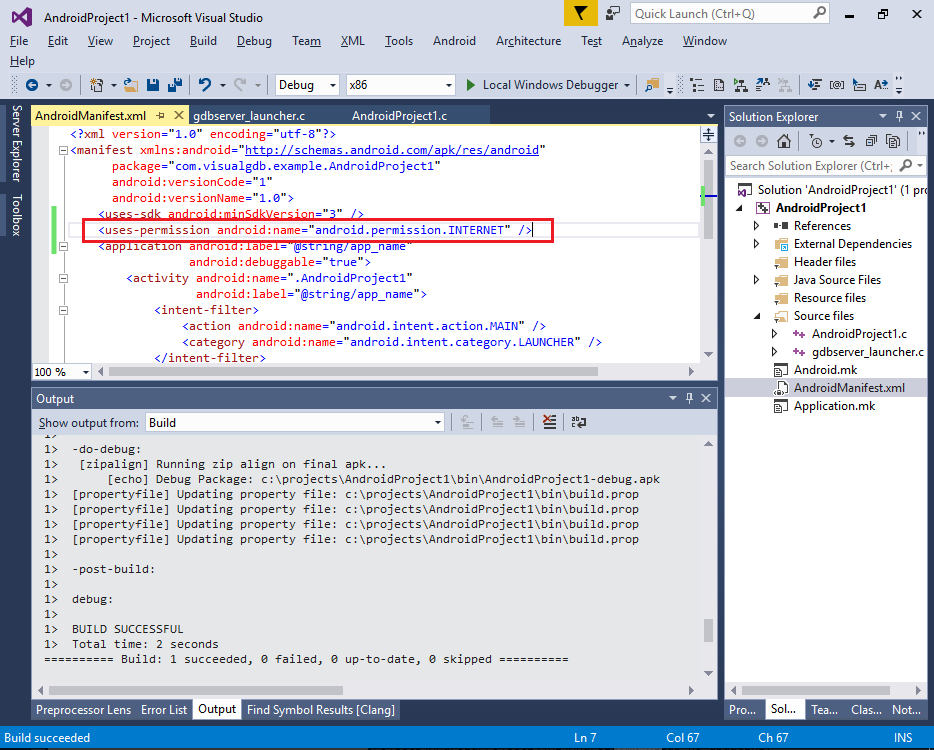
- Before you can debug your application, add the “android.permission.INTERNET” permission to the AndroidManifest.xml file. This will ensure that the application (and gdbserver) can actually open sockets and accept connections:
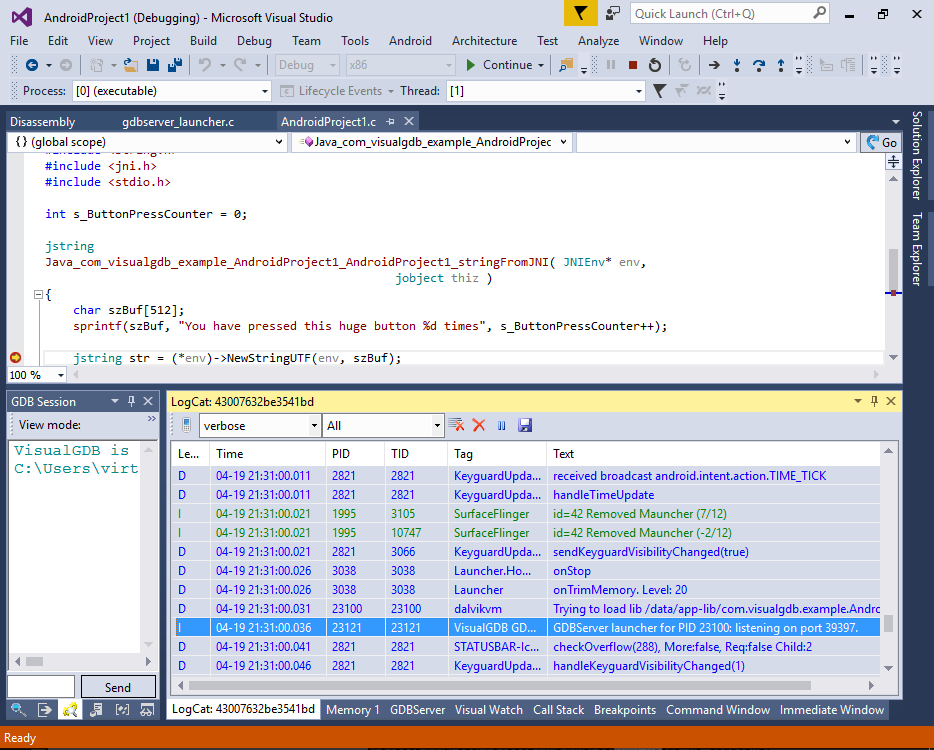
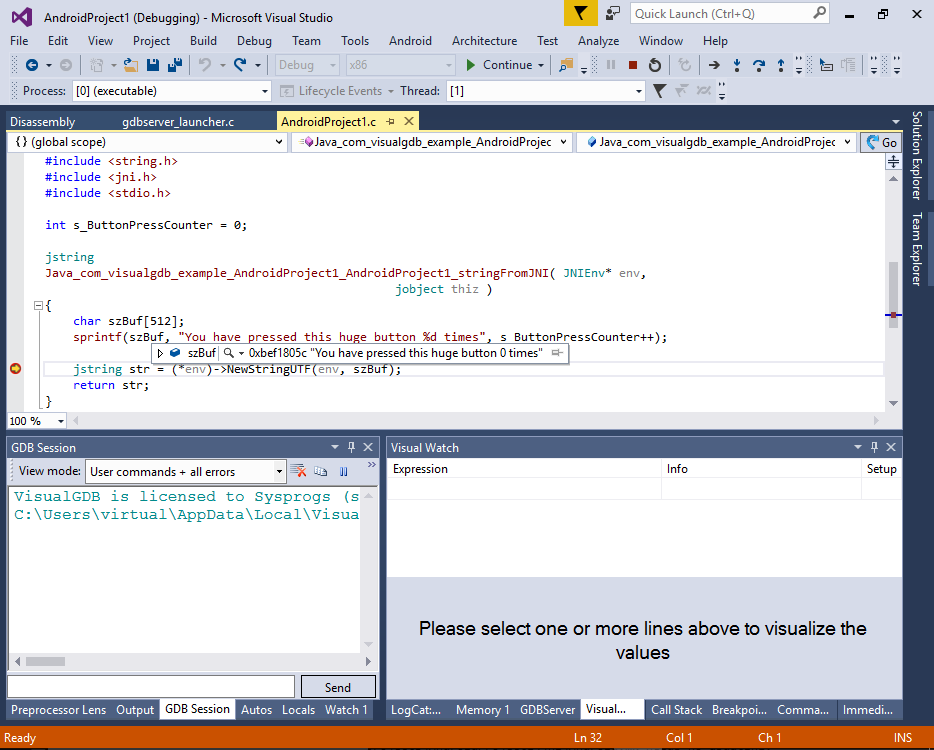
- If you press F5 now, VisualGDB will automatically take care of locating and launching gdbserver and will start debugging for you:
 The only differences from the regular debugging will be:
- Your app will always launch gdbserver and wait for the debugger when it is started. If you want to launch the app without debugging, build a separate configuration of it without the LAUNCH_GDBSERVER_FROM_APP macro so that the gdbserver_launcher won’t engage.
- If your app uses several native libraries, the gdbserver_launcher.c will need to be included in the one that is loaded the first. Otherwise you won’t be able to debug any code that runs before gdbserver is launched.
- If you encounter any problems with the gdbserver launcher, observe the logcat output of your Android device. The gdbserver launcher will report any errors it encounters there: