Debugging the san-angeles project with Visual Studio
This tutorial shows how to build and debug the San-Angeles sample provided with Android NDK.
Before you begin, please install VisualGDB 2.0 or later (ensure that “Android Edition” is checked in the installer). If you are not familiar with VisualGDB, please first go through the Android Quickstart tutorial.
Warning! The Android Emulator does
not support OpenGL. You will need a real device for this
tutorial.
- Start Visual Studio. Select File->New project->VisualGDB->Android Project Wizard.
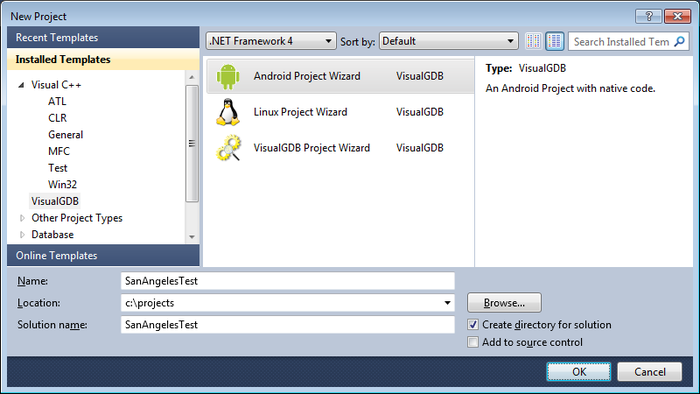
- Enter the path where you want to copy the sample and an arbitrary project name (e.g. SanAngelesTest).
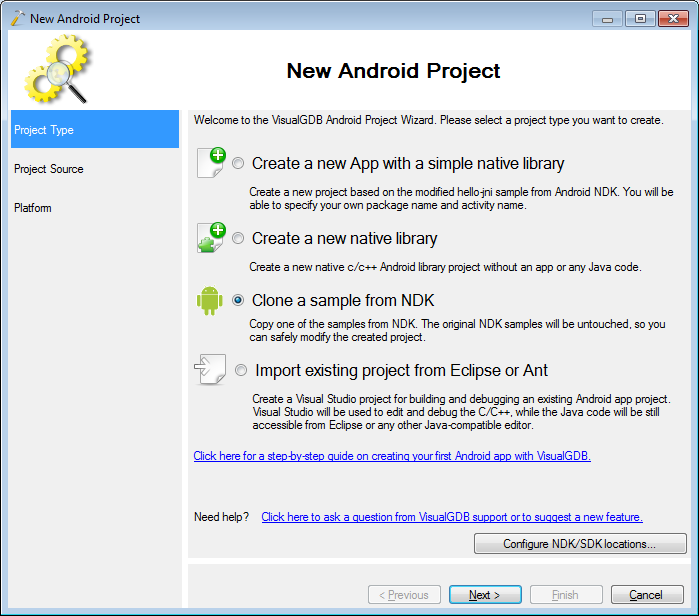
- Select “Clone a sample from NDK”.
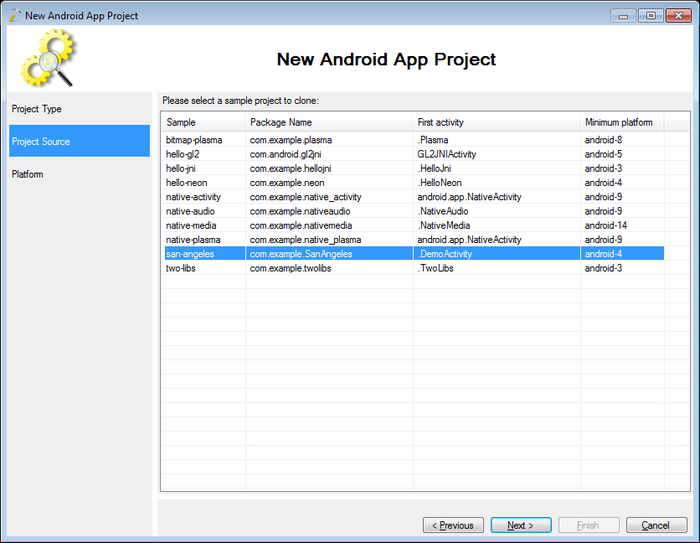
- Select “San-Angeles” from the sample list.
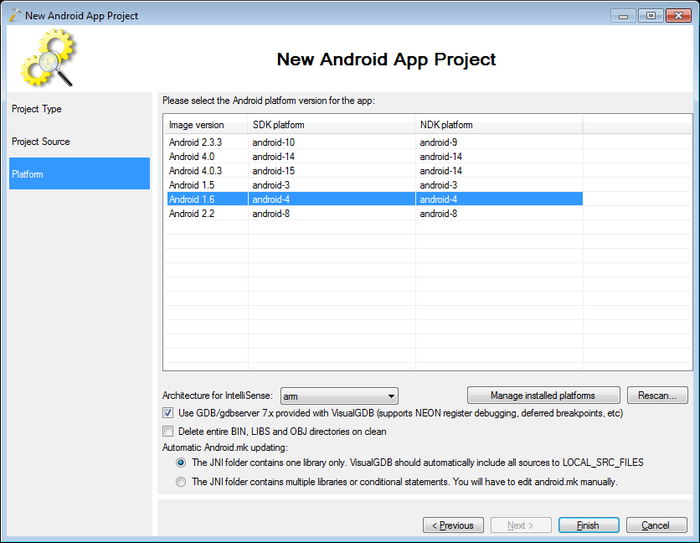
- Keep the default Android 1.6 platform and press Finish.
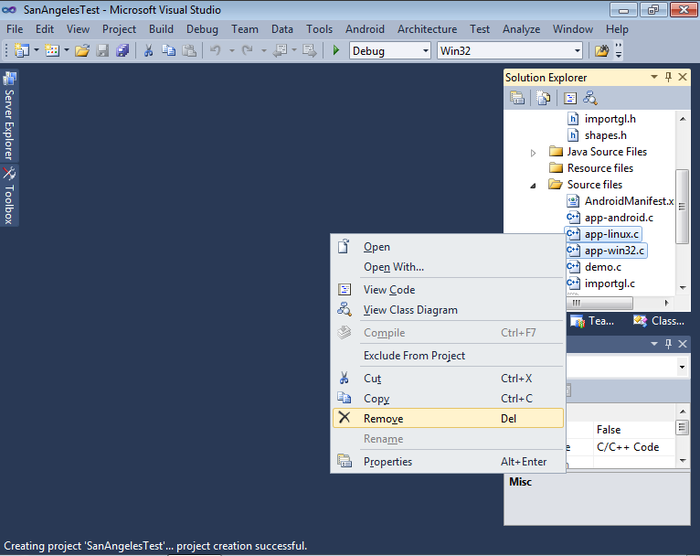
- The san-angeles project folder includes files from Windows and Linux ports of the demo that won’t compile on Android. Select them in Solution Explorer, right-click and select “Remove”.
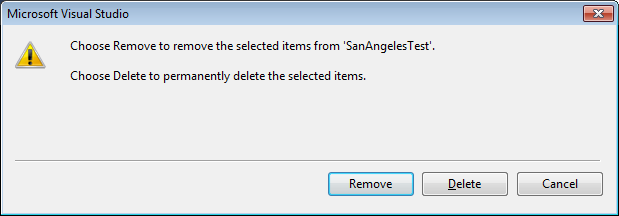
- Press “remove” in the confirmation window.
- Build the project by selecting “Build->Build All”.
- Prepare your device for debugging (follow this manual if doing it for the first time) and connect it to PC.
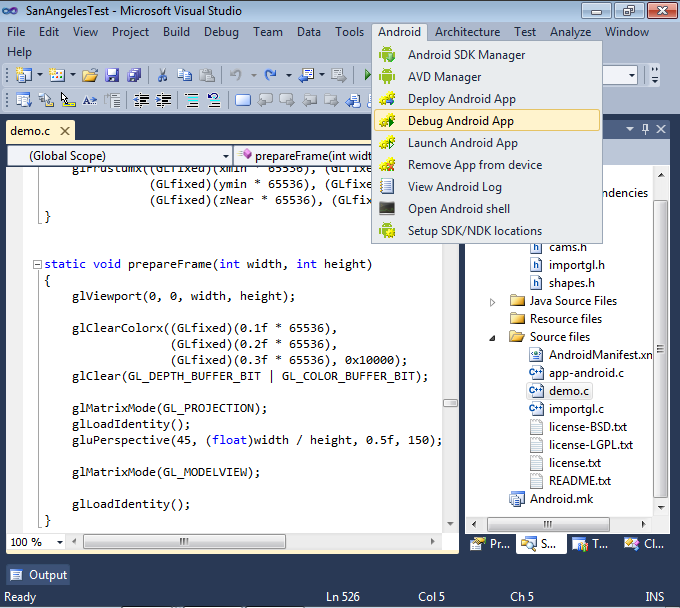
- In Visual Studio select “Android->Debug Android App”.
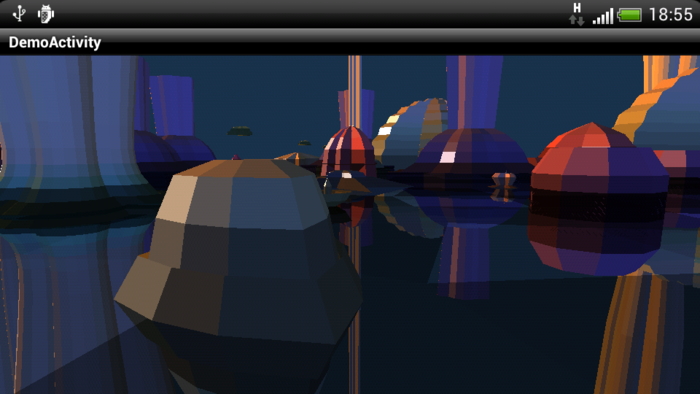
- VisualGDB will deploy the app automatically and start it. If your device supports OpenGL, you will see the demo on the screen:
- To test debugging functionality, set a breakpoint on the prepareFrame() function by navigating there in Visual Studio and pressing F9. The breakpoint will trigger almost immediately:
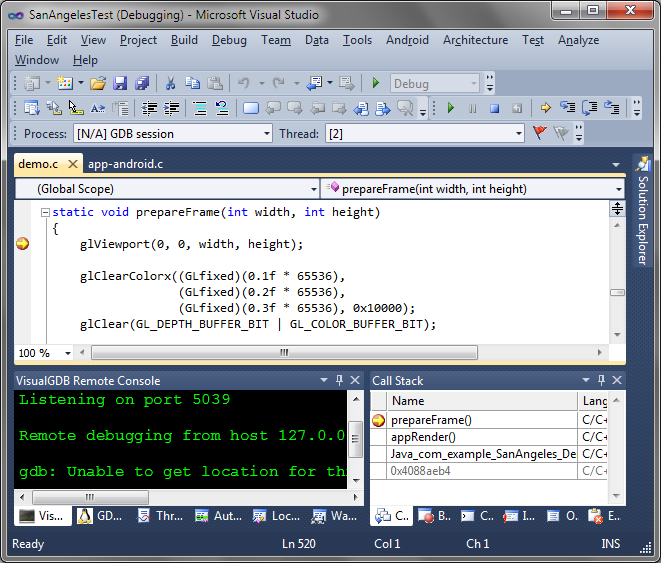
- You can use the usual Visual Studio tools to examine call stack, variables and threads, or the GDB Session window to send commands directly to GDB.
- To finish debugging, press Shift+F5.


