Using Visual Studio to debug Cygwin applications
This tutorial shows how to create, build and debug cygwin-based applications with Visual Studio.
Before you begin, please install cygwin and VisualGDB .
- Start Visual Studio. Select File->New project->VisualGDB->MinGW/Cygwin Project Wizard
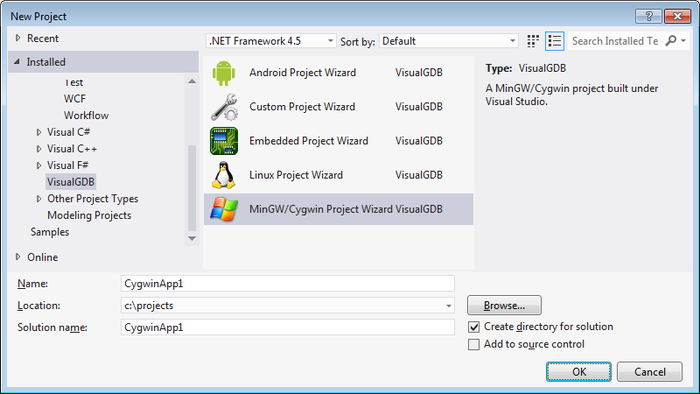 Select project location and enter a project name. Then click ‘OK’.
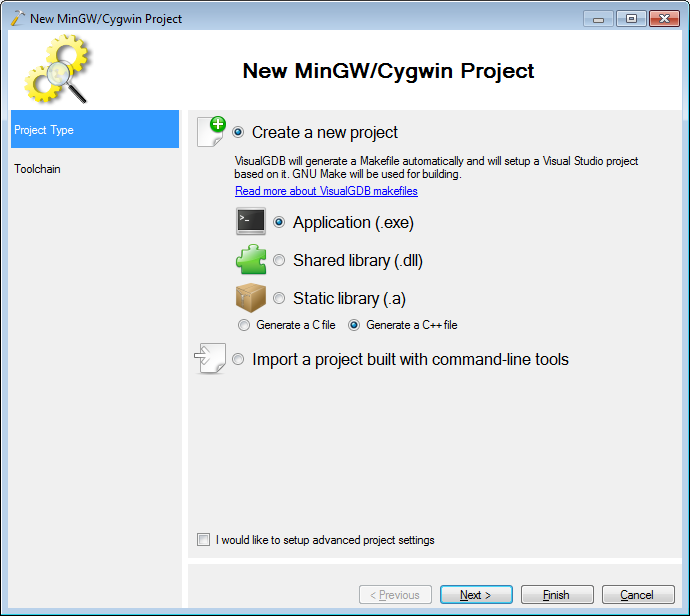
 - Make sure that “Create a new project” is selected and click on ‘Next’.
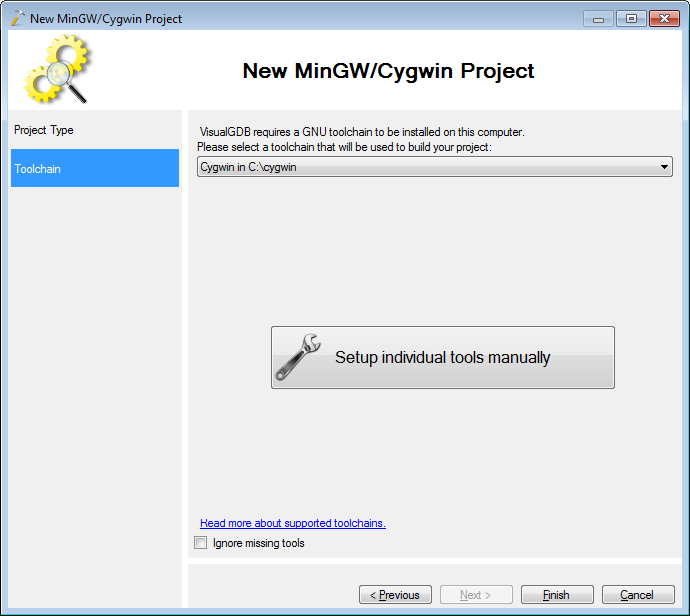
- On the toolchain page select “Cygwin”. VisualGDB will detect its location automatically or you can also select the installation directory manually. Click on ‘Finish’.
- The wizard will generate a Visual Studio project for a simple “Hello, World” application built with cygwin tools. To build it just select Build->Build Solution or press Ctrl+Shift+B.
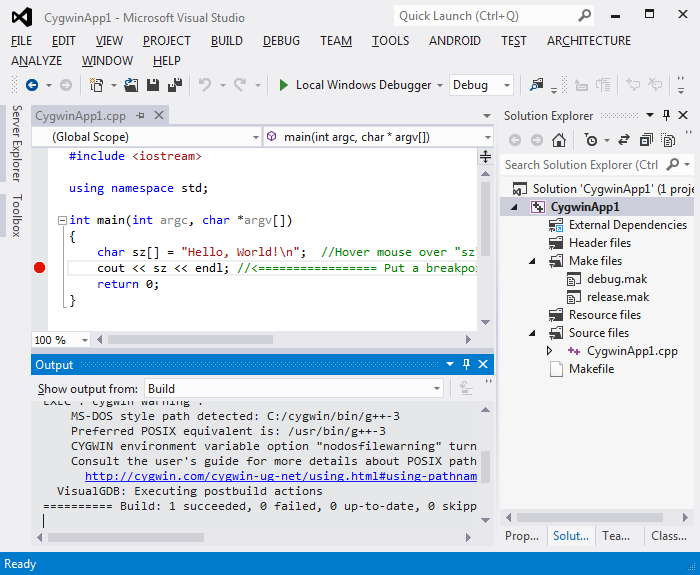
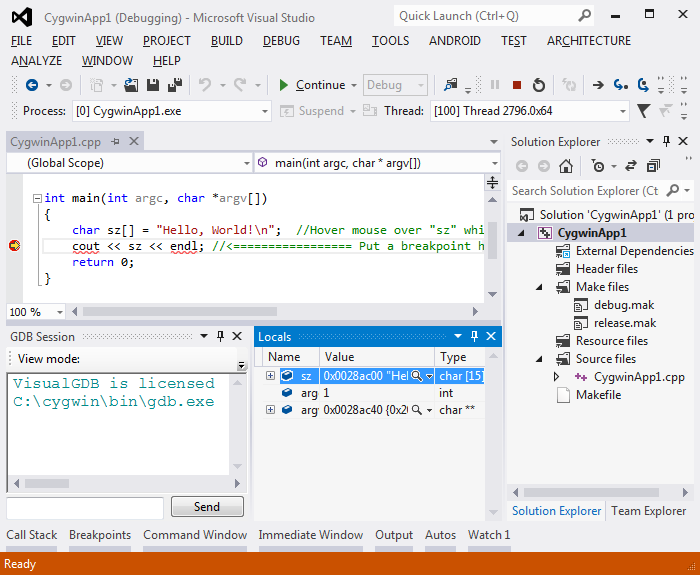
- Set a breakpoint on the cout line and start debugging by selecting Debug->Start Debugging or pressing F5. Debugging your cygwin-based app with VisualGDB is not much different from debugging normal Windows applications: stepping, watch windows, call stack, memory view and many other features will work as usual. VisualGDB will seamlessly control the GDB debugger on behalf of Visual Studio. You can also enter GDB commands directly in the GDB Session window.
 To end debugging, press Shift+F5.
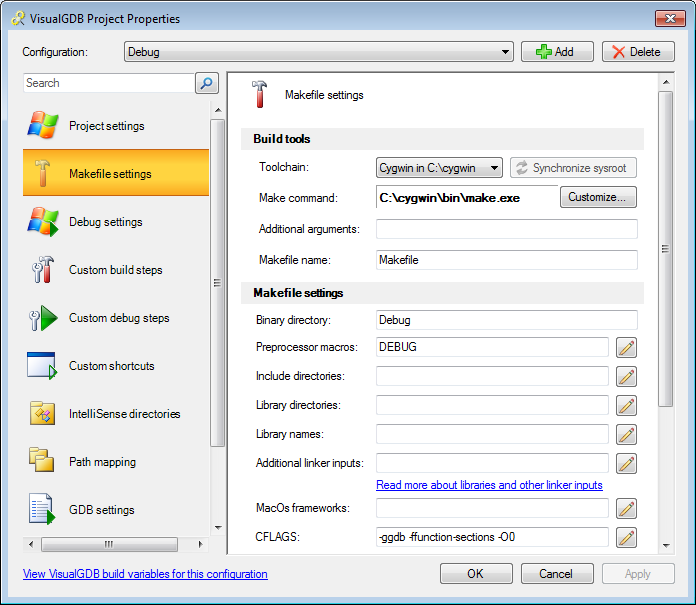
 - You can always customize the properties of your project by right-clicking at it in Solution Explorer and selecting “VisualGDB Project Properties”.
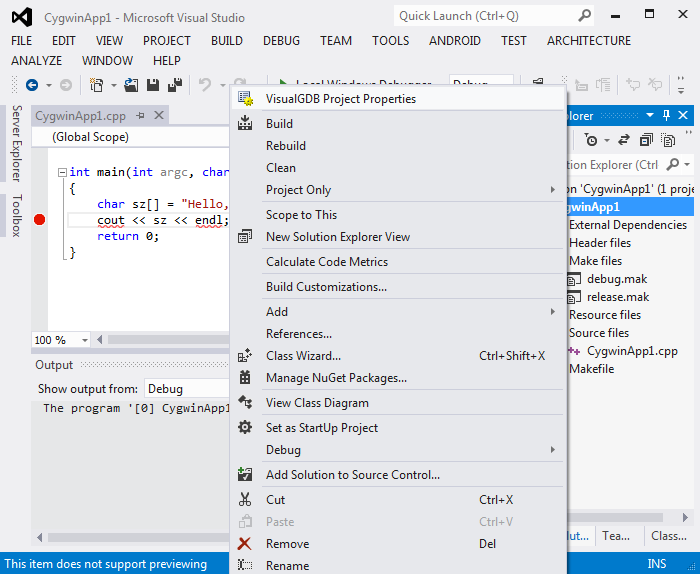
- From the properties window you can control build and debug command lines and many advanced parameters.