Using Visual Studio to debug GNU tools
This tutorial demonstrates how to debug GNU applications built with GCC using Visual Studio.
We will show several debugging techniques by applying a patch created for gdb 7.2a to gdb 7.4 (and thus obtaining a crashing executable due to no backward compatibility), debugging the crash with VisualGDB, locating the problem and resolving it.
Although the specific case demonstrated in this example (applying an old patch to GDB) is rare, the tutorial shows various powerful debugging techniques made possible using GDB with Visual Studio.
To reproduce the steps described in this tutorial one-by-one, follow these steps:
1. Download and install MinGW, and VIsualGDB.
2. Download gdb 7.4 to c:\mspgcc-build and start the MinGW shell.
3. Run the following commands to unpack the GDB sources:
cd /c/mspgcc-build
tar xjf gdb-7.4.tar.bz2
4. Download the MSP430 patch for gdb 7.2a to c:\mspgcc-build.
5. Apply the patch. The patch adds support to the MSP430 processor family.
cd gdb-7.4
patch -p1 < ../msp430-gdb-7.2a-20111205.patch
6. Create a build directory and configure GDB for MSP430 target:
cd ..
mkdir gdb-build
cd gdb-build
../gdb-7.4/configure --target msp430 --prefix /c/mspgcc
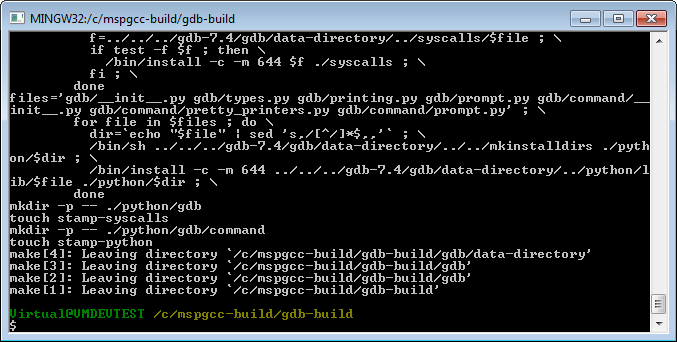
7. Build the GDB:
make -j16
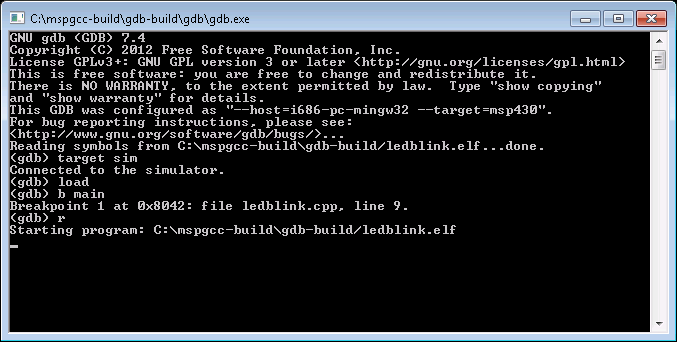
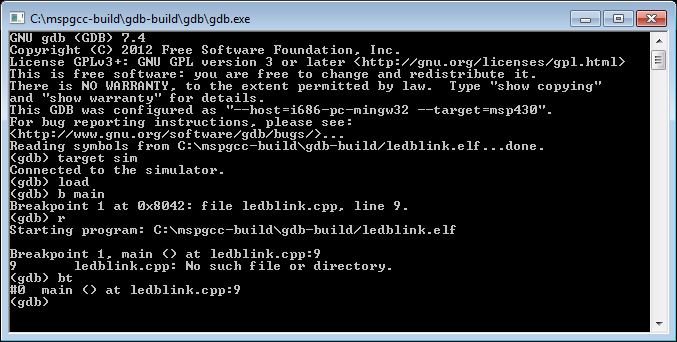
8. Reproduce the GDB crash. Load a simple ELF file into the simulator, set a breakpoint and run it. You can download a sample MSP430 ELF file here.
gdb/gdb LEDBlink.elf
Once GDB starts, execute the following commands:
target sim
load
b main
run
Once the breakpoint in main() is hit, GDB will crash:
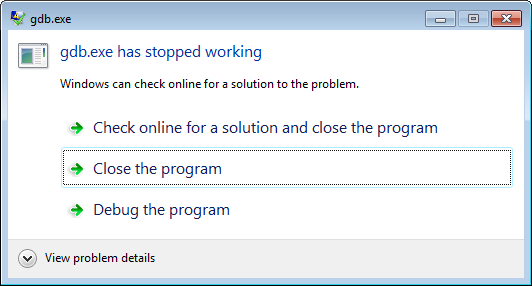
9. To analyze the problem with VisualGDB we’ll be creating a Visual Studio project to build and debug it. Start Visual Studio, select File->New->Project:
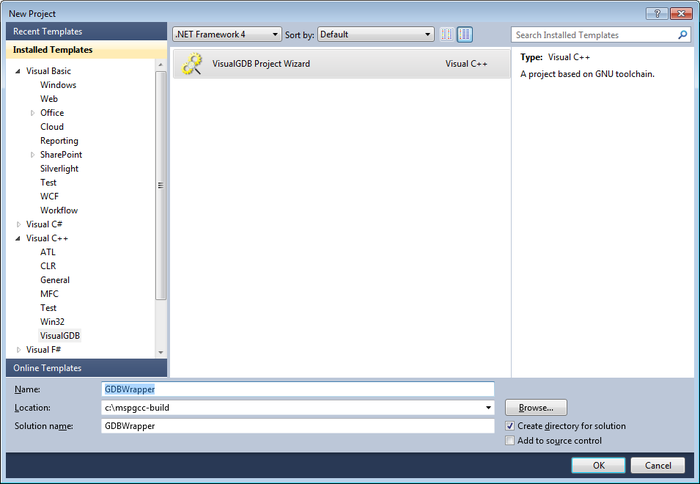
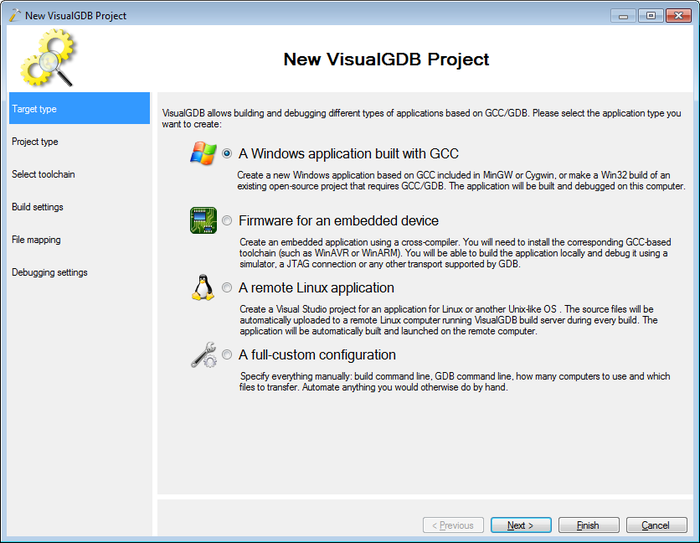
10. In the project type selection screen, please select “A Windows application”.
11. On the next screen select “Import existing project” and specify the location of the gdb-build folder. The folder you specify should contain the Makefile. Do not specify the folder with GDB sources.
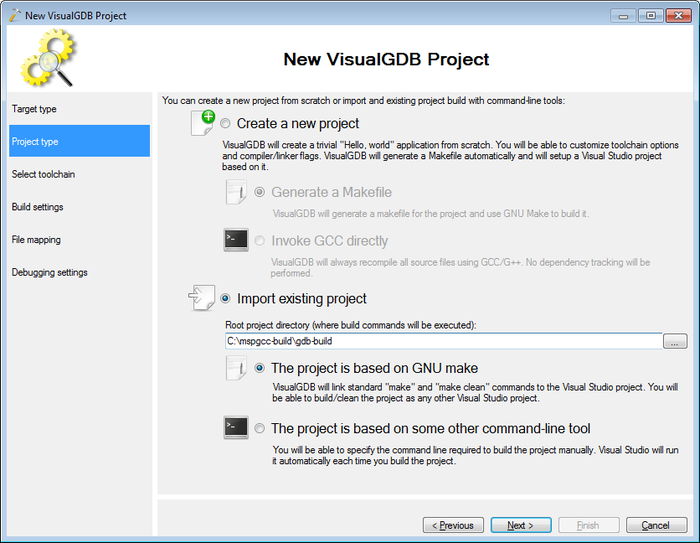
12. Ensure that the “GNU make” option was automatically activated. If not, you have specified a wrong directory (containing no Makefile).
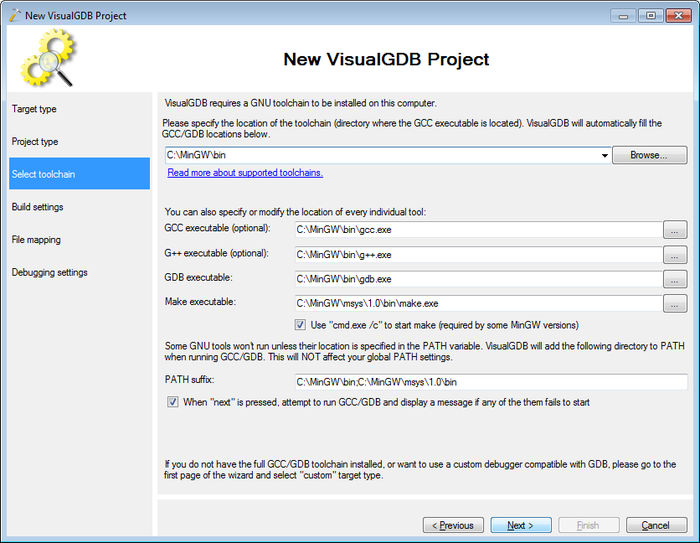
13. The next screen allows selecting the toolchain. Normally, you should leave the default settings.
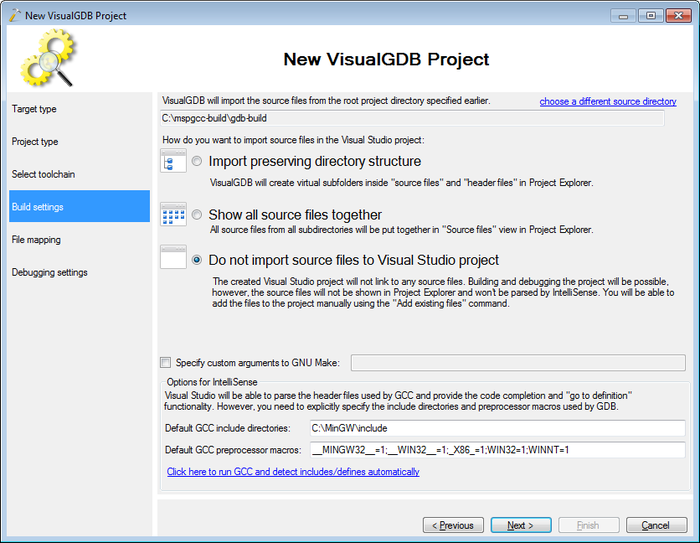
14. At this point you can import all GDB source files to Visual Studio project. This will make them available from the Solution Explorer and will also import them to IntelliSense. However, importing over a 1000 GDB source files might take more than 10 minutes. Thus, it’s recommended to skip import at this point:
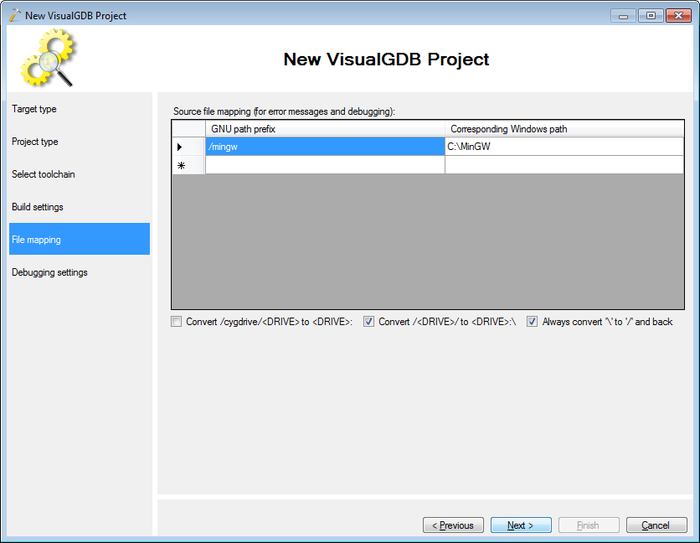
15. As you are not using remote building, leave the default values on the file mapping page:
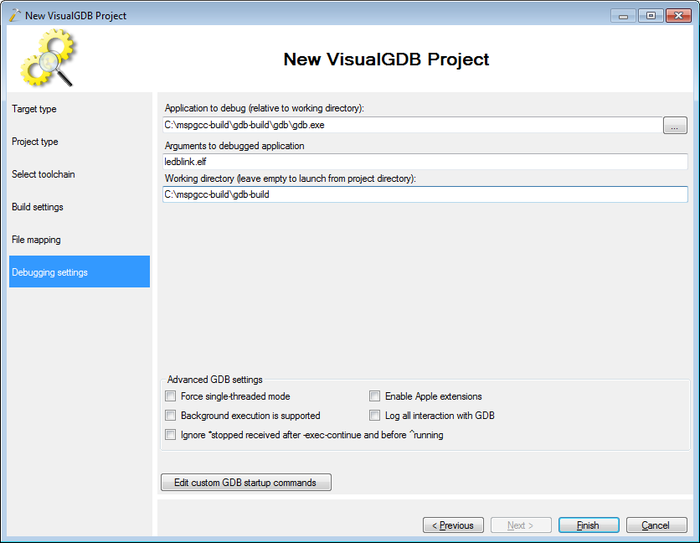
16. When we were reproducing the bug manually, we started “gdb/gdb ledblink.elf” from the c:\mspgcc-build\gdb-build directory. Now we need to tell VisualGDB to start this command automatically:
17. When the wizard is done, an empty project will be created. Start debugging by selecting Debug->Start debugging with GDB.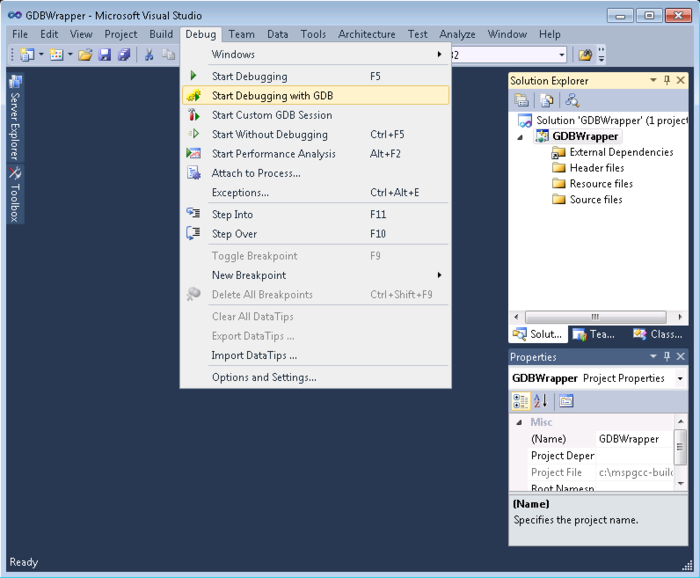
18. VisualGDB will use the GDB from MinGW to debug our freshly built GDB for MSP430 platform.
19. To reproduce the bug enter the commands that caused it before:
target sim
load
b main
run
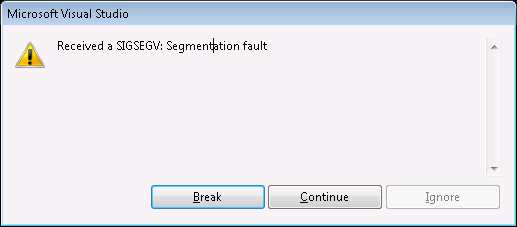
20. Visual Studio will report a caught SIGSEGV:
21. Press “break”. Visual Studio will show the location of the error in the source code:
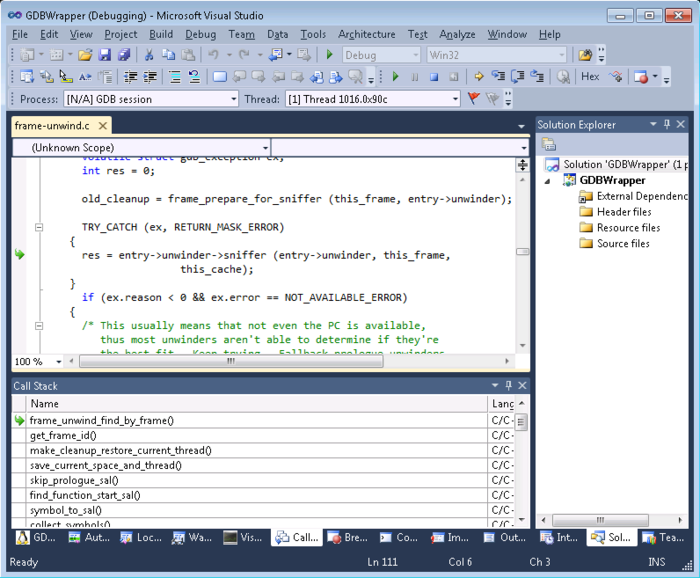
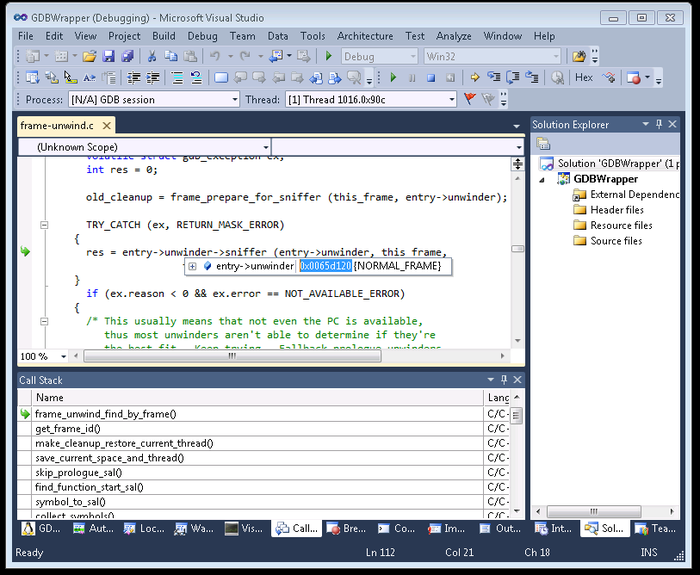
22. By hovering the mouse over sniffer we can see that its value is zero. To see where does it come from, hover the mouse over unwinder. Let’s retrieve more information about the address of unwinder from GDB. Double-click at the value popup, select the address and press Ctrl+C to copy it to clipboard.
23. Open the GDB Console window type “info symbol <space>” and press Ctrl+V to paste the address. Press Enter to execute the command.
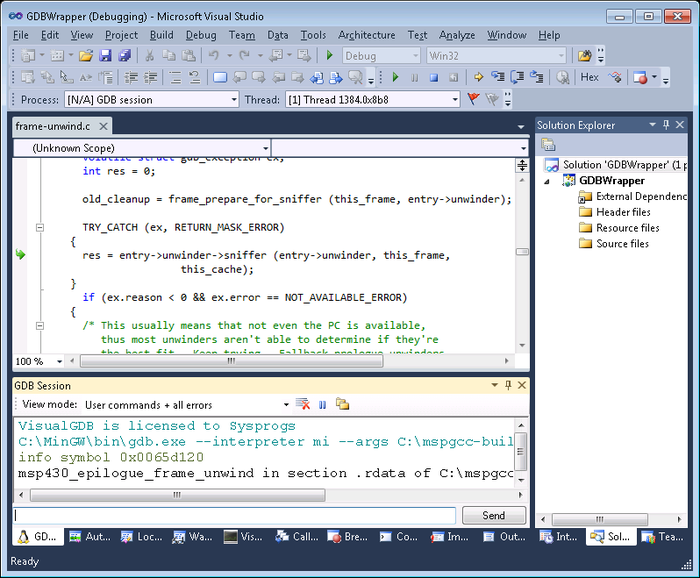
24. The address actually corresponds to msp430_epilogue_frame_unwind symbol. Copy it and paste into the watch window by selecting it and pressing Ctrl+V.
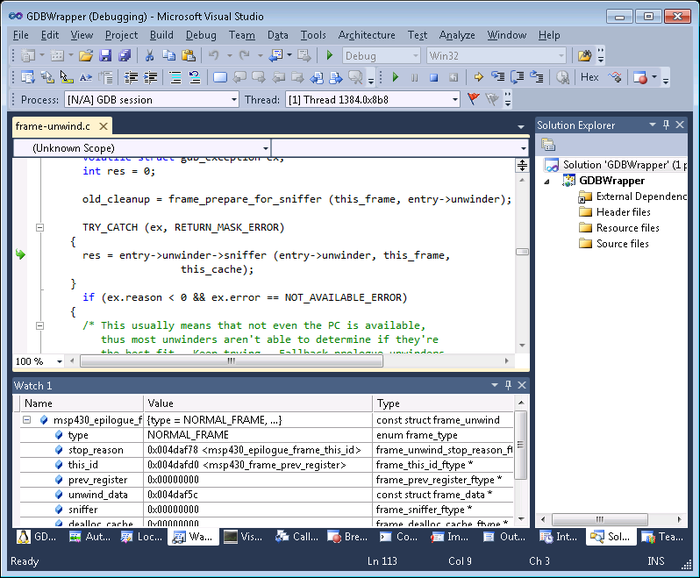
25. Looks like the field values after NORMAL_FRAME do not correspond to the field names. E.g. the msp430_epilogue_sframe_this_id is assigned to stop_reason instead of this_id, and so on.
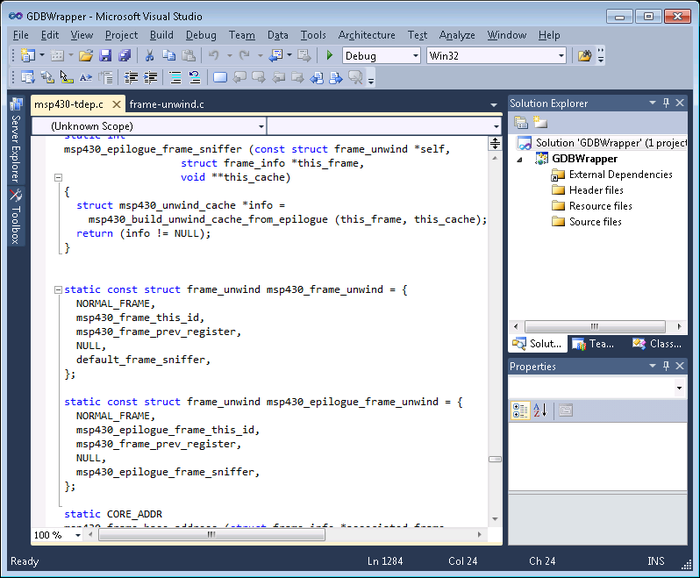
26. Search the source files in the GCC directory for msp430_epilogue_frame_unwind. Open the msp430-tdep.c file containing the definition.
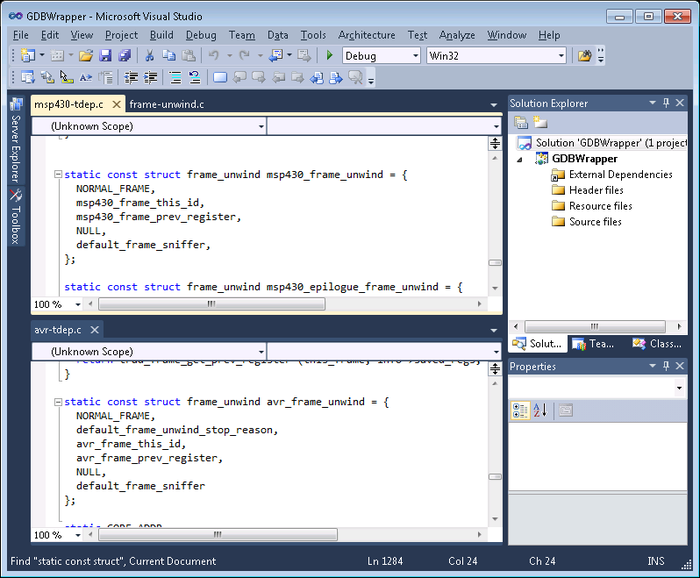
27. It seems that at some point a new member was added to the frame_unwind structure after the first one, breaking the compatibility with previous patches. To check this, open the avr-tdep.c file and search for similar definitions:
28. Looks like the stop_reason member was added and thus has to be initialized. Copy the member initialization from the AVR code to both structures. When done, build the project by pressing Ctrl+Shift+B.
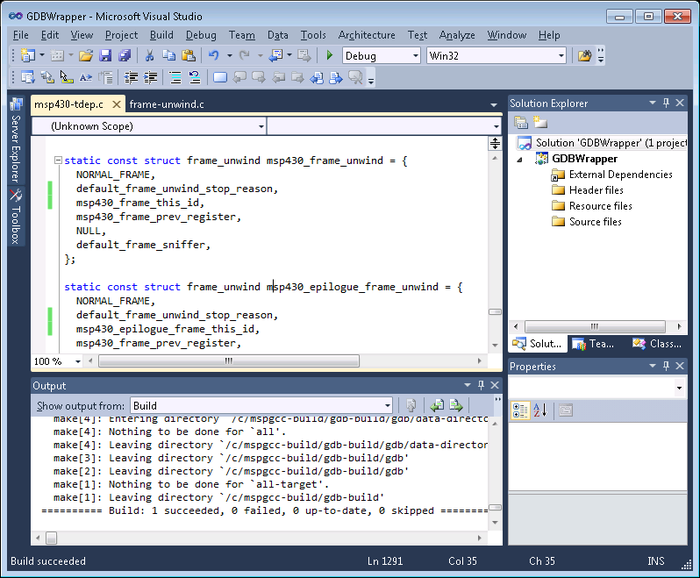
29. If you made any errors, GCC will report them and Visual Studio will display them in the error list. You can then press F8 to automatically jump to the first error and so on.
30. Select Debug->Start debugging with GDB and try to reproduce the problem:
31. As you can see, updating the frame_unwind initialization solved the problem.