Importing remote Linux projects to Visual Studio
This tutorial shows how to import a Linux project from a Linux machine to Visual Studio to build and debug it remotely. We will download the sources of Midnight Commander to the Linux machine, import them to Visual Studio, build, debug and modify them directly from the Visual Studio. We will use the VisualGDB wizard to setup a network share and connect to it automatically.
To proceed with the tutorial you will need a Windows machine and a Linux machine. You can use 2 physical computers, a Windows computer running Linux inside VirtualBox/VMWare or vice versa.
- Install VisualGDB on your Windows machine with Visual Studio.
- On your Linux machine get the source code of Midnight Commander by running the following commands from your home directory:
sudo apt-get build-dep mc
apt-get source mc
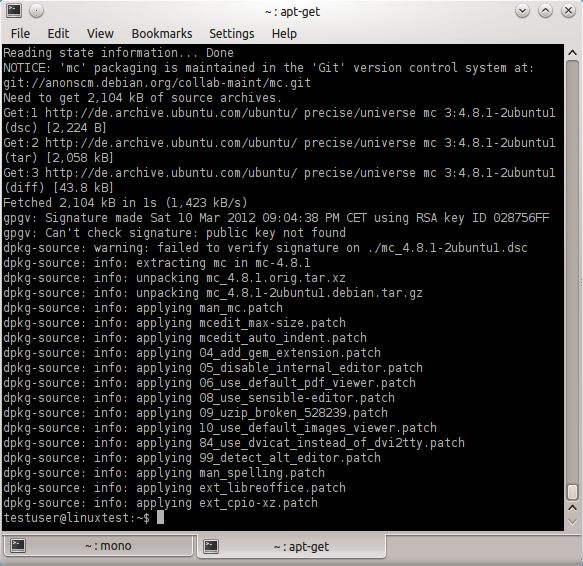
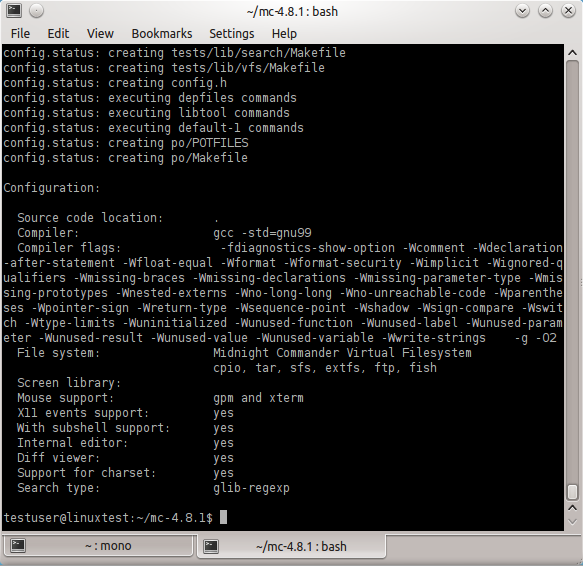
- When the source code is downloaded, go to the newly created directory and configure Midnight Commander with default settings:
cd mc-<VERSION>
./configure
- Open Visual Studio on your Windows machine. Select File->New->Project and find VisualGDB project wizard:
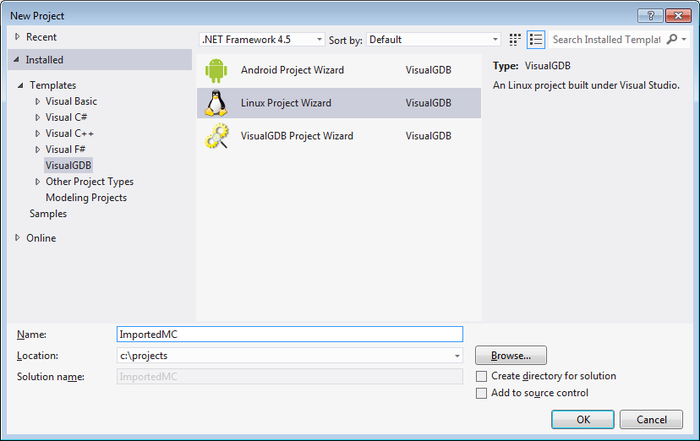
- Enter a project name and specify the directory where it should be stored. Press OK.
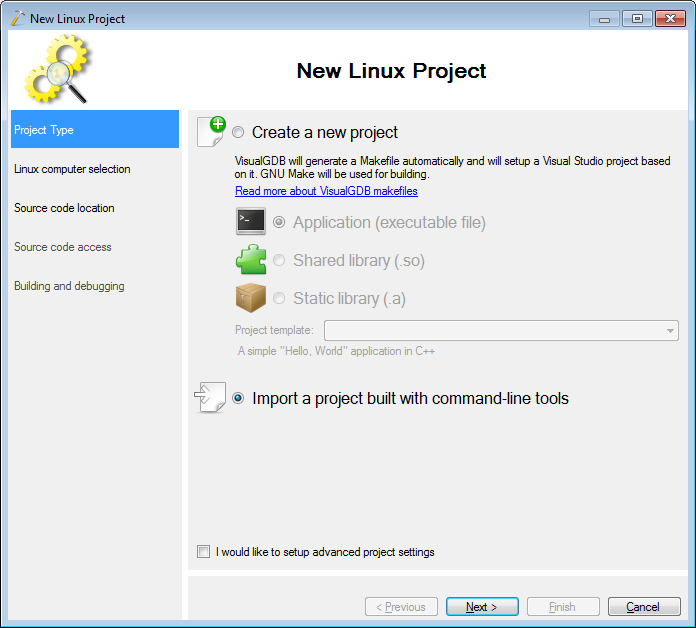
- On the first page select “Import a project”:
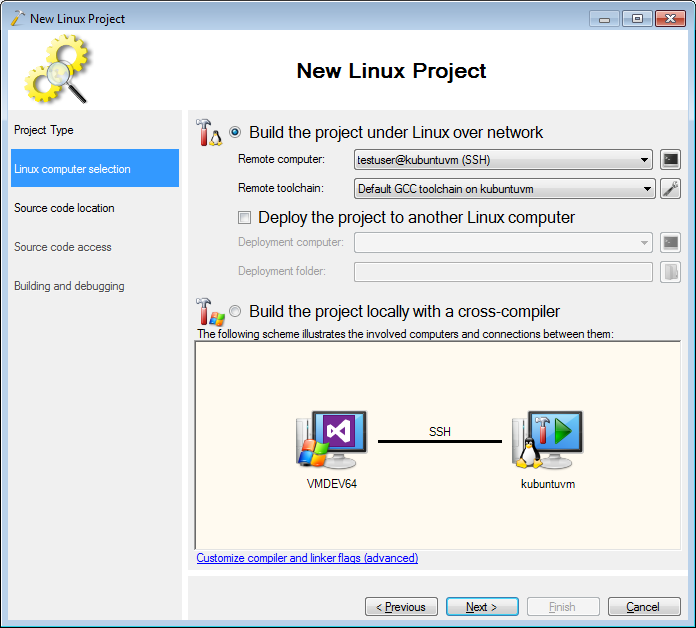
- If you have not used this computer with VisualGDB before, you will need to setup an SSH connection (see this tutorial if you get stuck). Otherwise simply select the machine from the list:
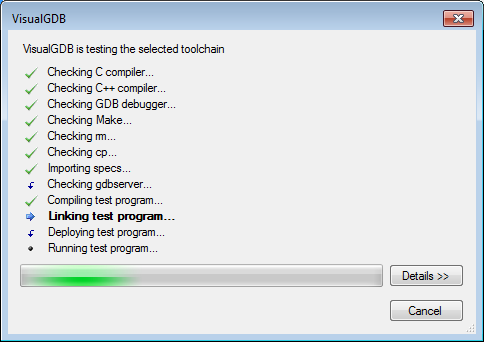
- When you press “Next”, VisualGDB will test your toolchain for inconsistencies. If missing packages are detected, you will see a detailed error message.
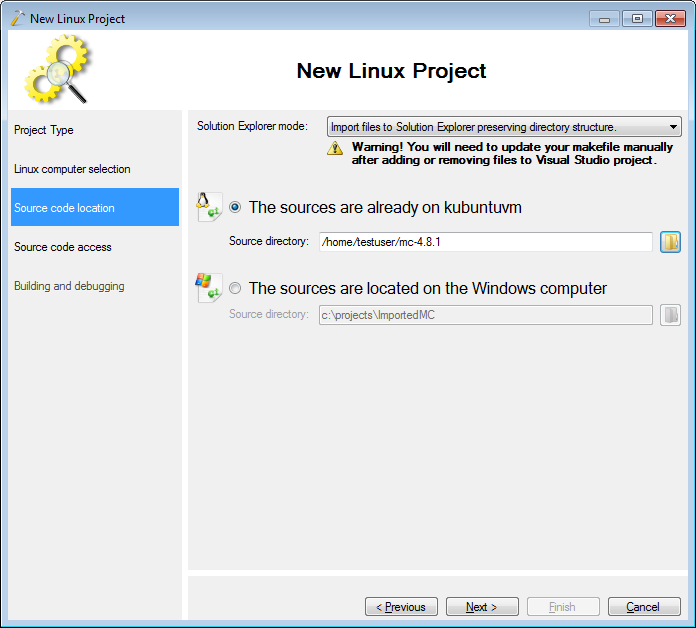
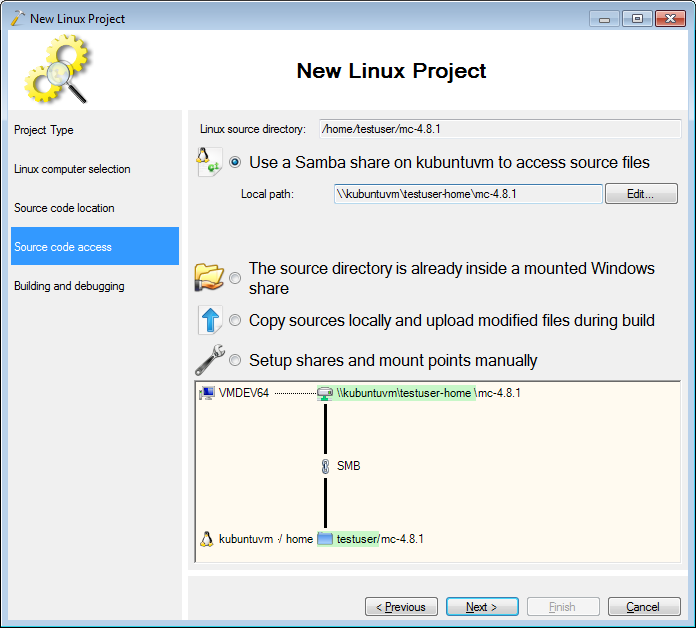
- On this page you need to specify the location of your source files on the remote machine. Use the browse button to find it easily:
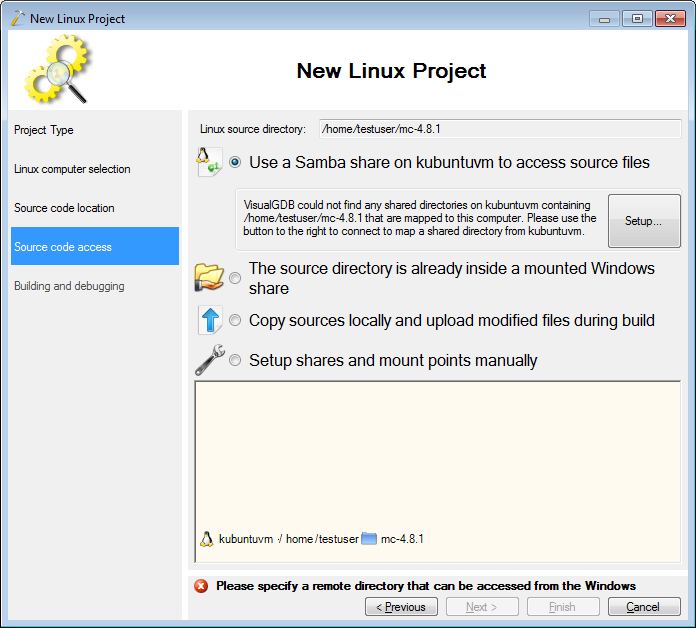
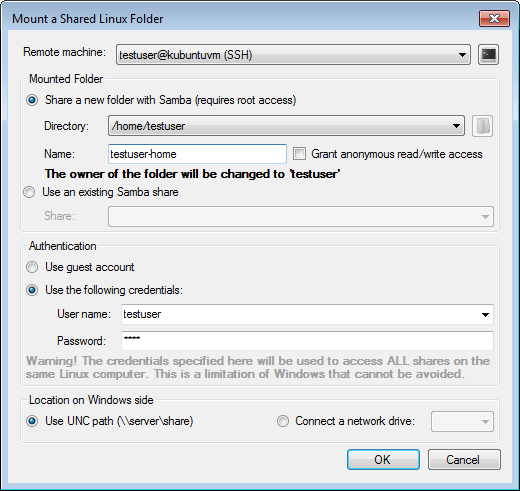
- This page allows selecting how Visual Studio will access the source files on the Linux machine. The recommended way would be to share a folder using samba. Click “Setup” to do it automatically:
- Creating a separate shared folder for each project would be too much overhead, so we simply share a parent folder (the home folder in this case). You can pick any valid folder and any share name here. To prevent access from unauthorized users you can specify a username and a password that will be used to access the folder over SMB. VisualGDB will remember them and use them automatically to establish the connection.
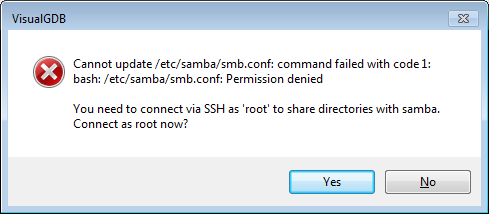
- When you press OK, you will most likely get an error message stating that you have no permission to modify the samba configuration. This is by design – only the root user can normally create shared folders on Linux. Press “yes” to reconnect as root and sharing the folder again:
- Once the share is made, the VisualGDB wizard will display the information about it on the diagram below. Use it to verify that the setup matches your expectations.
- On this final page you can specify the commands VisualGDB should use to build your project. You can also select the main executable right now, or choose to provide it later.
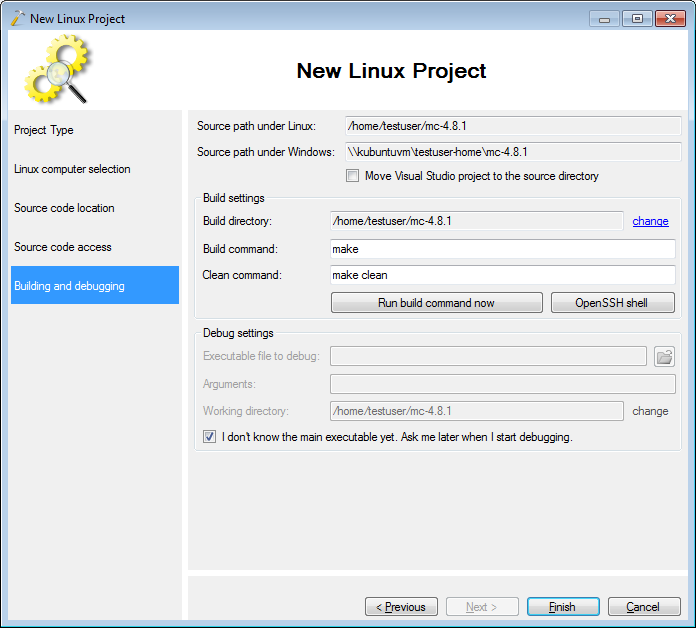
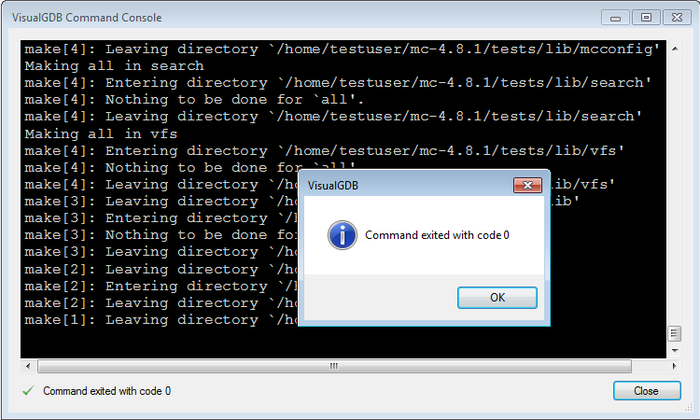
- If you are not sure about the build command and build directory, press the “Run build command now” button to test the command right now before saving your choices:
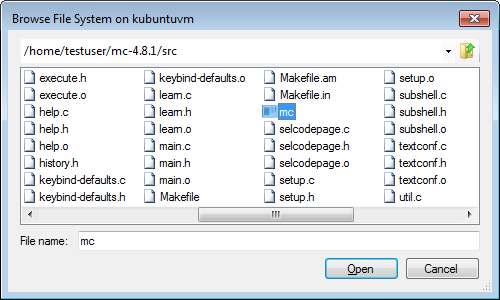
- Press Finish to create your project. Now you can build it with Ctrl+Shift+B and start debugging with F5. If you have not selected the main binary before, VisualGDB will kindly ask you to do it now:

- Use the “browse” button to find the binary easily. For the mc project it is located inside the src directory:
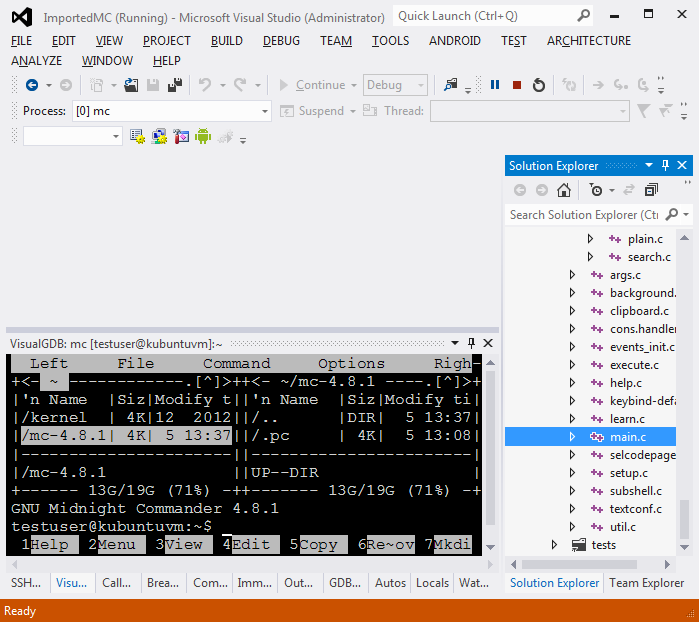
- VisualGDB will launch your project and show the output in the Program console window. VisualGDB provides an XTerm-compatible terminal emulator, so you can use your keyboard an mouse as usual:
- Click on the “break all” button to stop the execution and see the call stack:
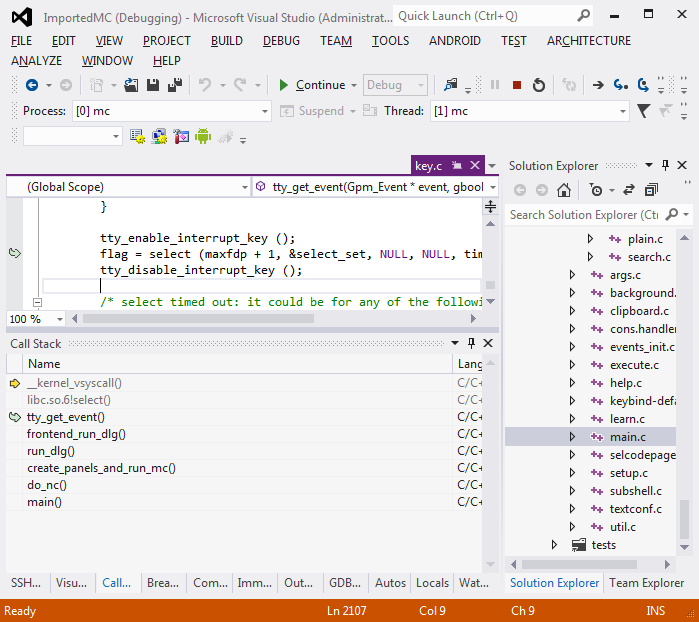
- You can now use all the usual Visual Studio debugging techniques: set breakpoints, examine call stack, watch windows, etc. When done, press Shift-F5 to stop debugging.


