Debugging GNU Octave plugins with VisualGDB
This tutorial shows how to debug a plugin of an Linux application by attaching to a process. We will make a simple function for GNU Octave and debug it in Visual Studio with VisualGDB.
- Please install VisualGDB 3.0 or newer on your Windows machine.
- On your Linux machine install octave and its headers that are needed to make oct files:
sudo apt-get install octave
apt-get install octave-headers
- Next make a file named ourpluginfunction.cpp in /tmp containing the following code.
#include <octave/oct.h>
DEFUN_DLD(ourpluginfunc, args, nargout, "Example Plugin Function")
{
    int nargin = args.length();
    if (nargin != 1)
        print_usage();
    else
        return octave_value(args(0)*42);
    return octave_value_list();
}
- Compile the file with the following.
sudo mkoctfile /tmp/ourpluginfunc.cpp
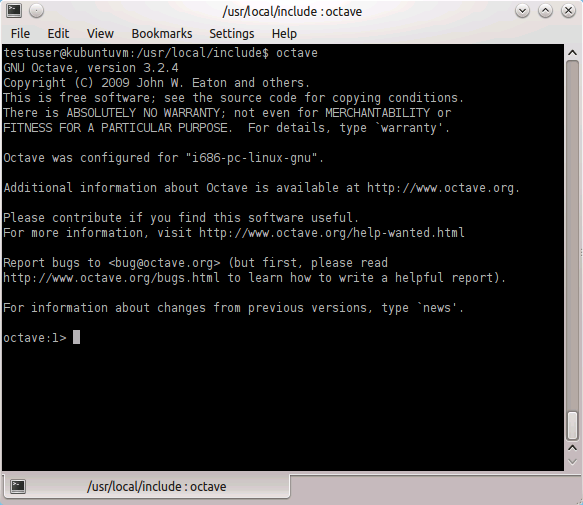
- Run octave.
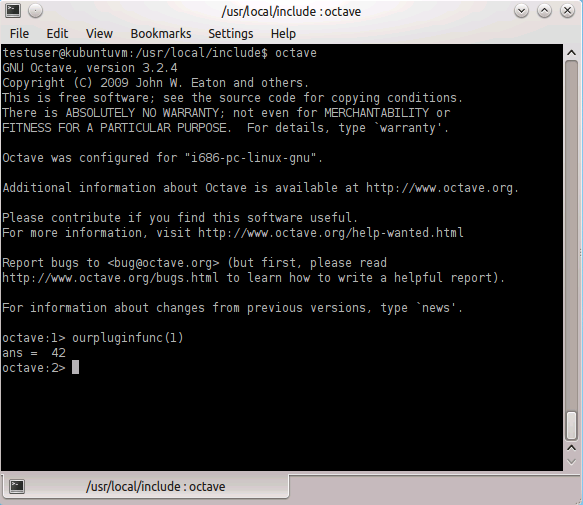
- Run our command ‘ourpluginfunc(1)’.
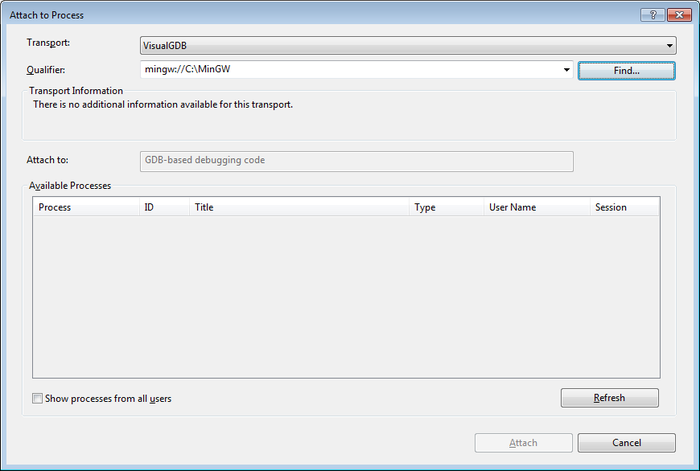
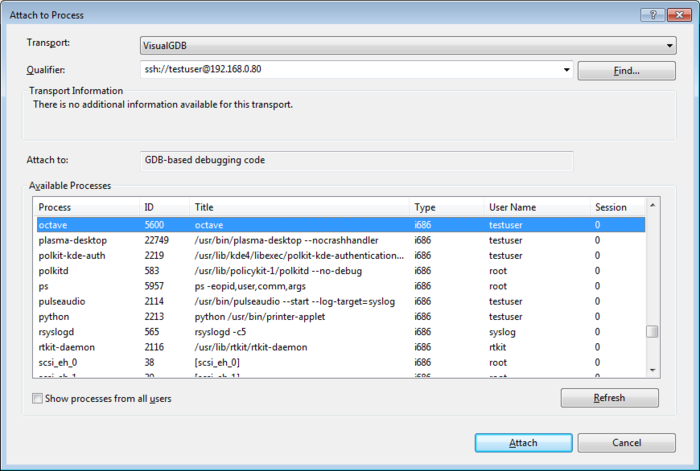
- Inside Visual Studio go to Debug->Attach to Process, choose VisualGDB as transport and click on ‘Find…’.
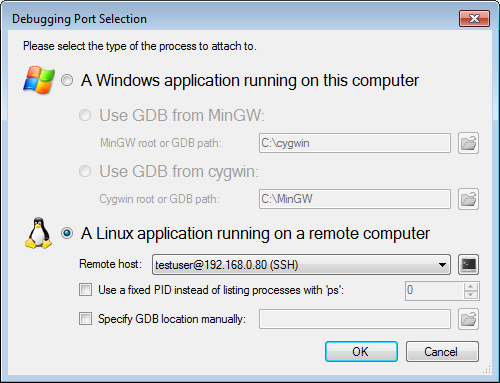
- Choose the Linux machine as the remote host and click on ‘OK’.
- Find octave from the list and click on ‘Attach’.
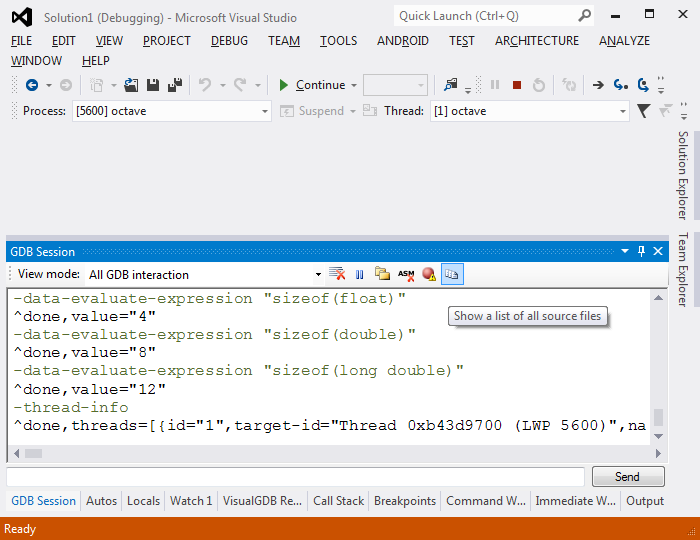
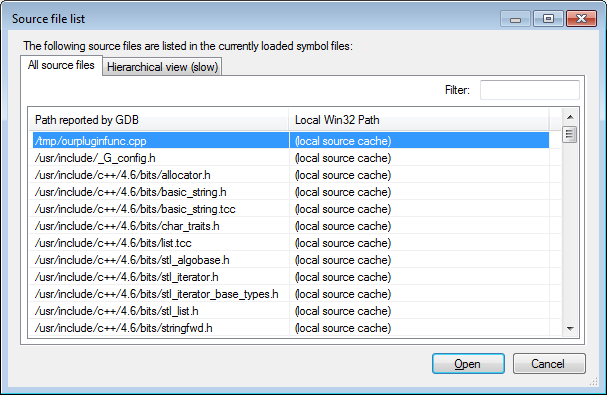
- VisualGDB has attached to the Octave process and suspended it. Click on the source file list icon in the GDB Session window to locate your source file in order to set a breakpoint.
- Open the ourpluginfunc.cpp from here.
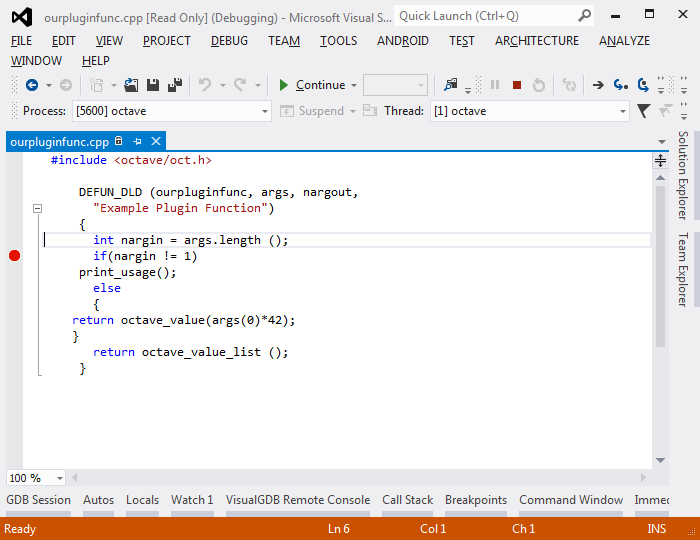
- Set a breakpoint inside the function and continue execution.
- Go to the Linux machine and enter into octave the command ‘ourpluginfunc(1)‘ again.
- Go back to Visual Studio. Note how we are now stopped inside our function and can debug it.
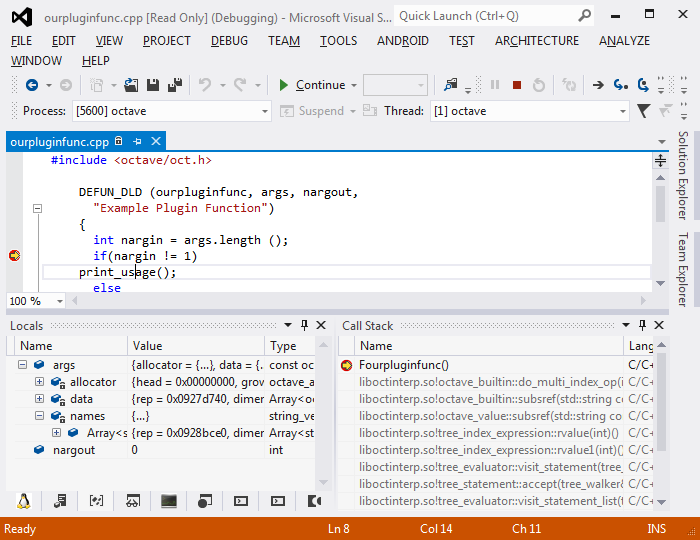
- You can use all common debugging techniques (e.g. variable evaluation, modification, step through code). When done, press F5 to continue executing Octave.


