Using Quick Debug to debug Linux applications
This tutorial shows how to quickly debug a Linux program built with GCC without creating a separate Visual Studio project.
In this tutorial we will build GNU binutils on a Linux machine and use Visual Studio to debug the cxxfilt program (GNU C++ name demangler) to find out which function inside it does the actual demangling. You can use the techniques described here to debug any other tool built with GCC.
- On your Linux machine download and unpack binutils source code. If you are using a Debian-based Linux distribution, you can do it by running the following command:
apt-get source binutils
- Configure and build binutils by running the following commands on your Linux machine:
cd ~
mkdir binutils-build
cd binutils-build
../binutils-2.22/configure
make
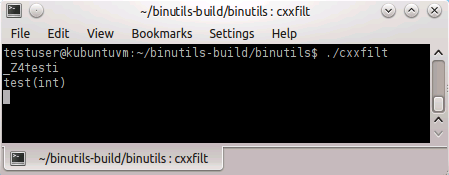
- At this point the ~/binutils-build/binutils directory will contain the cxxfilt binary. If you run it and type in a C++-mangled name as seen in a binary file (e.g. _Z4testi) it will demangle it for you (e.g. test(int) for _Z4testi).
- The fastest way to debug the cxxfilt binary remotely from Visual Studio is using the Quick Debug feature available in VisualGDB 3.0 and later.
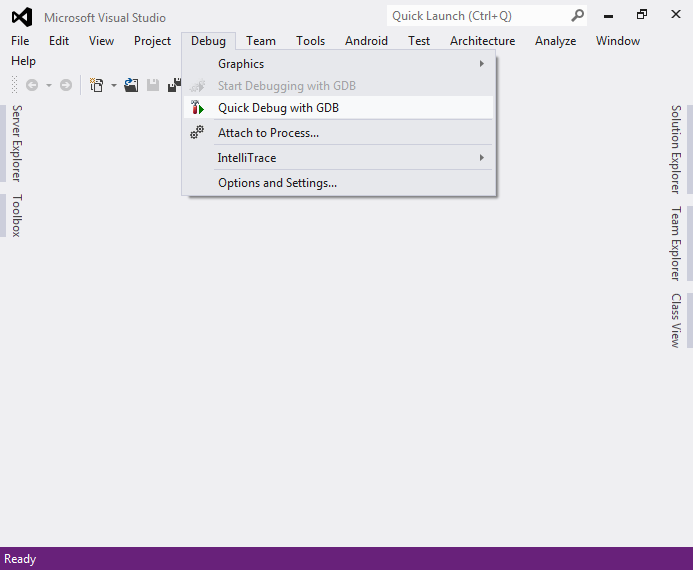
- Start Visual Studio and select Debug->Quick Debug with GDB:
- Select “Debug a Linux app”, then select the remote machine. Setup a new SSH connection if needed.
- Specify the path to the program you want to debug (i.e. cxxfilt). Use the button to the right to browse the files on your Linux machine. Specify “gdb” as the GDB binary to use the default GDB available on your Linux machine.
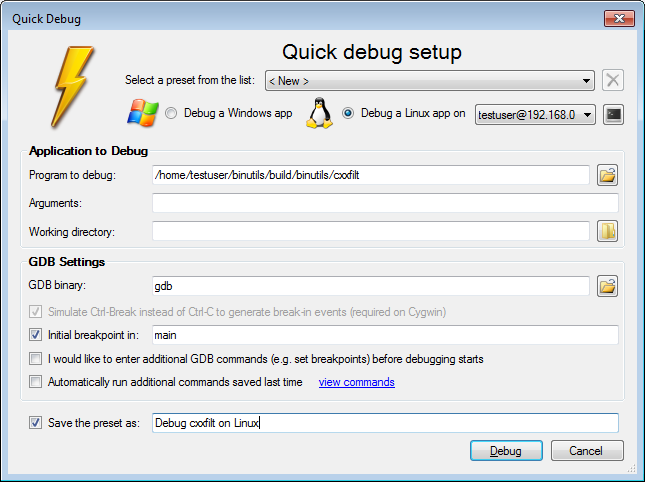 It is recommended to save the preset under some meaningful name to avoid doing manual setup next time you want to debug the same executable. You can always delete saved presets once you don’t need them any more.
 - Press “Debug” to start debugging. A breakpoint in main() will be triggered:
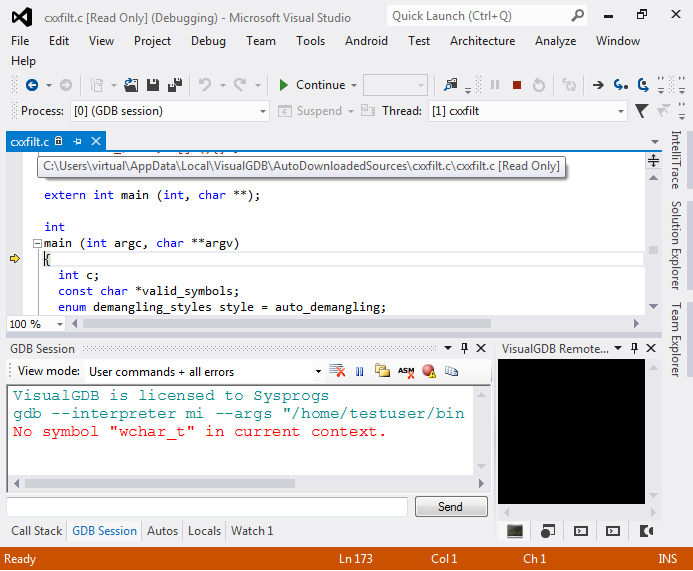
- Note that VisualGDB has automatically downloaded the cxxfilt.c source file from your Linux machine into %LOCALAPPDATA%\VisualGDB\AutoDownloadedSources. VisualGDB will continue downloading necessary files once you step into them or select them in Call Stack. However, the download process is one-way: you cannot modify those files from Windows. If you want to edit your Linux sources from Windows, create a new Linux project with VisualGDB Project Wizard.
- Resume the application by pressing F5. Then break into it by clicking “Break All”:
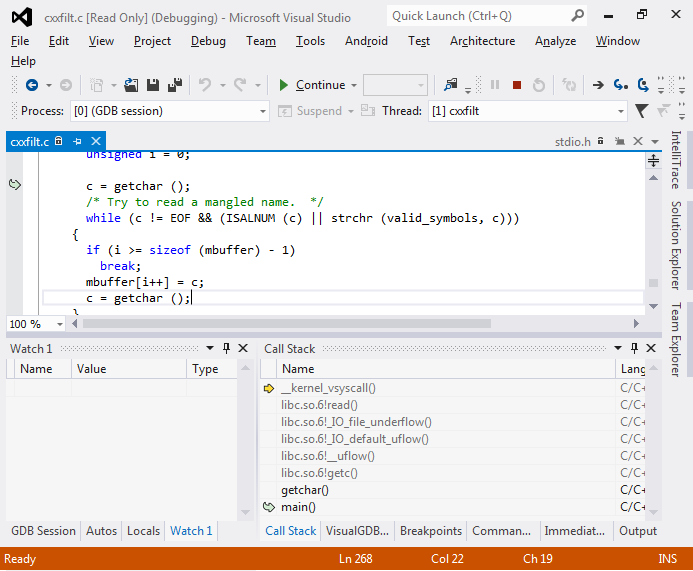
- Use Call Stack to find the code that is waiting for user input. Scroll down and set a breakpoint on the demangle_it() call. Resume the program by pressing F5.
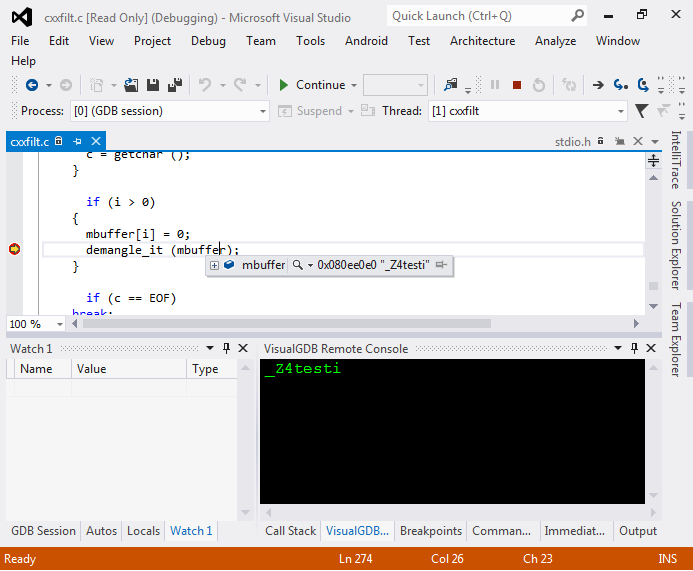
- Go to the Remote Console pane, type _Z4testi and press Enter. Your breakpoint will be hit:
- Step into the demangle_it() function to see where is the actual demangling performed:
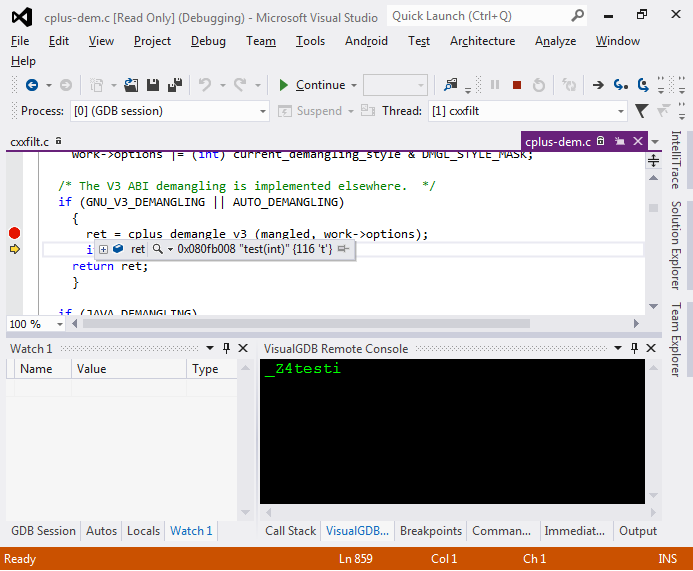
- As you can see, the demangling is done by calling cplus_demangle_v3() inside cplus-dem.c from libiberty.
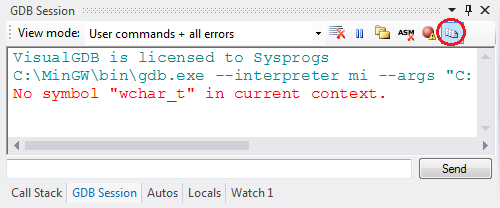
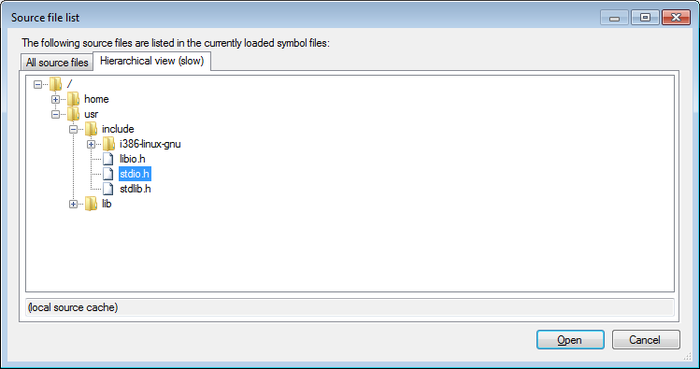
- Note that as you have not created a VisualGDB project, the Solution Explorer won’t show any files. To browse through all source files listed in symbol files, press the Source File List button on the GDB Session window:
- The VisualGDB source browser will show you all files reported by GDB, the corresponding Windows locations (if any path mapping was established) and will allow opening the files in Visual Studio. Missing files will be automatically downloaded. Go to the Hierarchical View, select an arbitrary file and press Open. The file will be downloaded and opened by Visual Studio:
- Press Shift-F5 to end debugging.


