Using Visual Studio to develop MSP430 firmware
In this tutorial we will show you how to develop and debug a simple “LED blinking” firmware for TI MSP430 microcontrollers using VisualGDB. We use the EZ430-RF2500 development board to demonstrate the integration with debugging tools; however, you can use any of those tools/programmers supported by the MSP430.DLL provided by TI.
Step-by-step guide
Before you begin, please ensure that you installed the latest version of VisualGDB. If you are targeting one of the newer devices we recommend downloading and installing the repackaged version of the TI toolchain from gnutoolchains.com that includes all necessary device definitions for VisualGDB: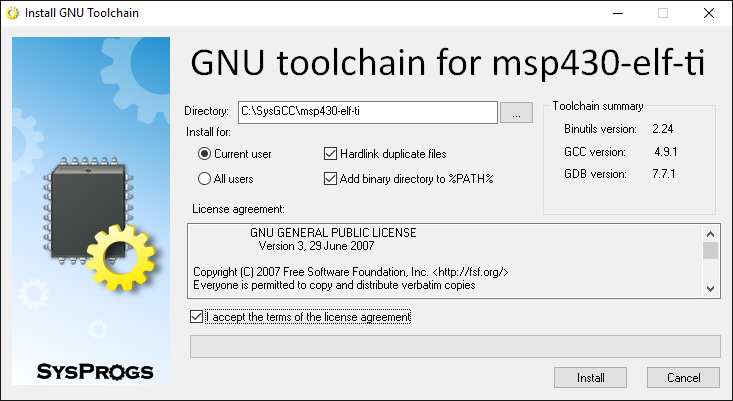 Once it’s installed, follow the steps below:
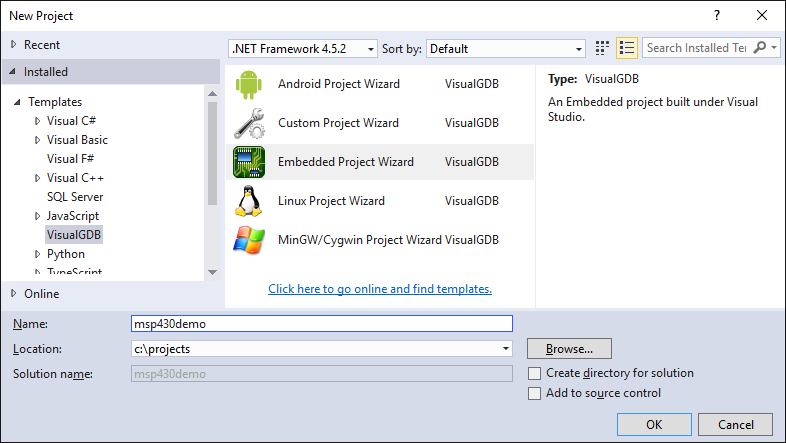
- Start Visual Studio, select “File->New->Project”. Then select “Visual C++->VisualGDB->VisualGDB Embedded Project Wizard”.
 Please avoid spaces in directory names, as GDB does not support it.
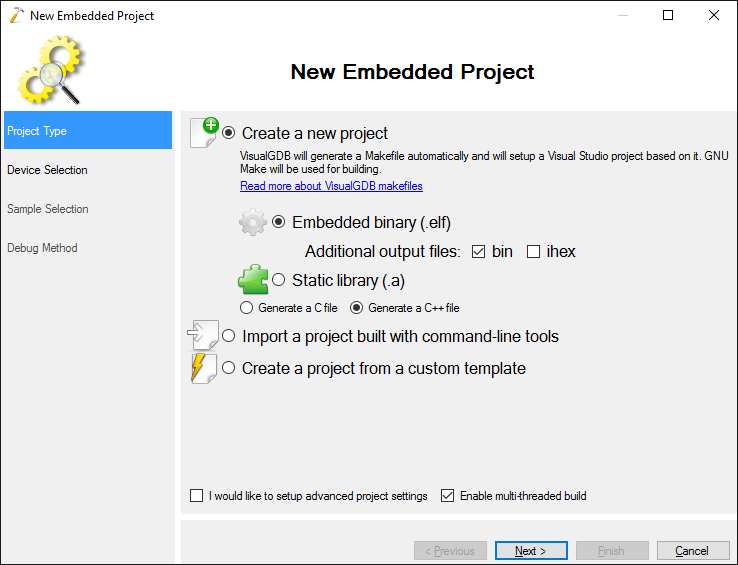
 - On the first page of the wizard proceed with the default settings and click “Next”:
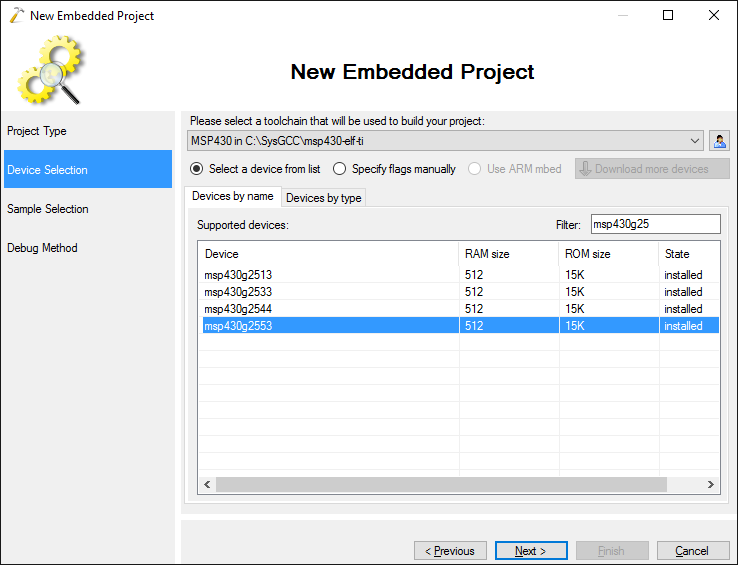
- Select “MSP430” from the toolchain list. If the MSP430 toolchain has not been installed before, VisualGDB will download and install it automatically. You can also download it yourself from http://gnutoolchains.com/msp430. Then select the MCU type that you want to target. The EZ430-RF2500 kit has the msp430f2274 MCU. The LaunchPad board comes with msp430g2553. You can use the “Filter” textbox to simplify finding the right MCU:
 On the next page enter the location of the LED. The EZ430-RF2500 and LaunchPad have a LED connected to P1.0, so the default settings will work.
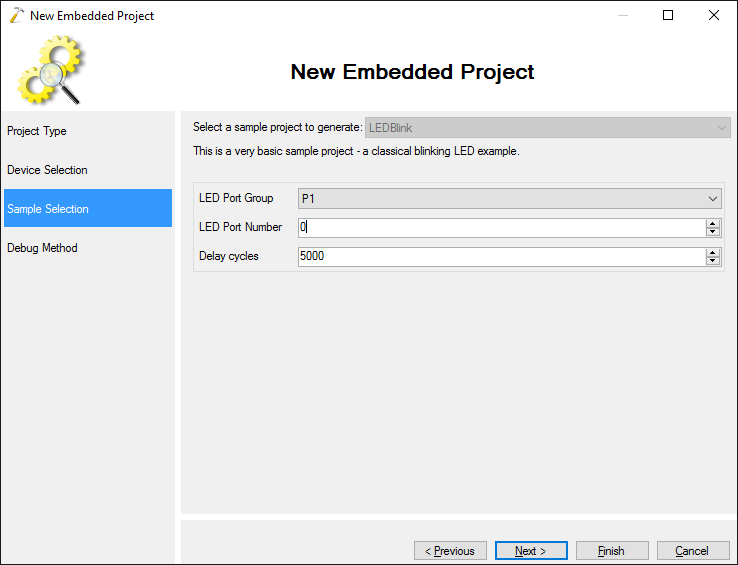
- On the debug settings page select “JTAG (gdbproxy++)”.
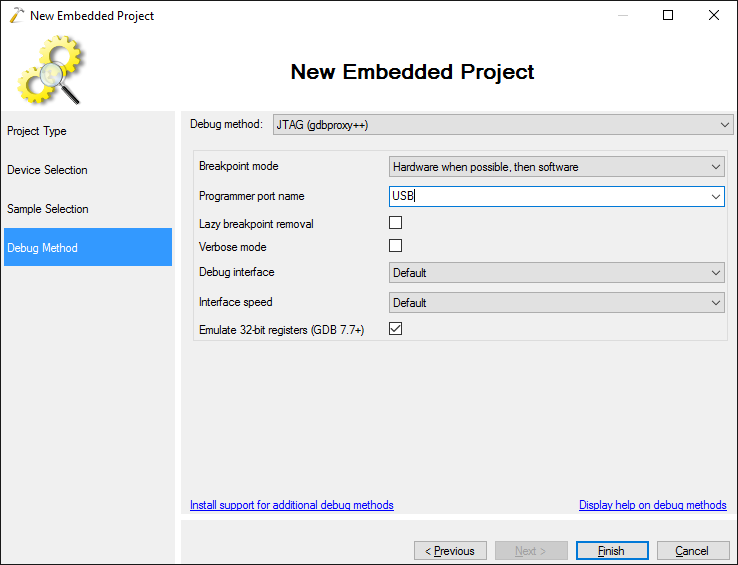 Press Finish when done.
 -
Congratulations! You have created a Visual Studio project for a simple MSP430 firmware. Press Ctrl+Shift+B or select Build->Build Solution to build the project.
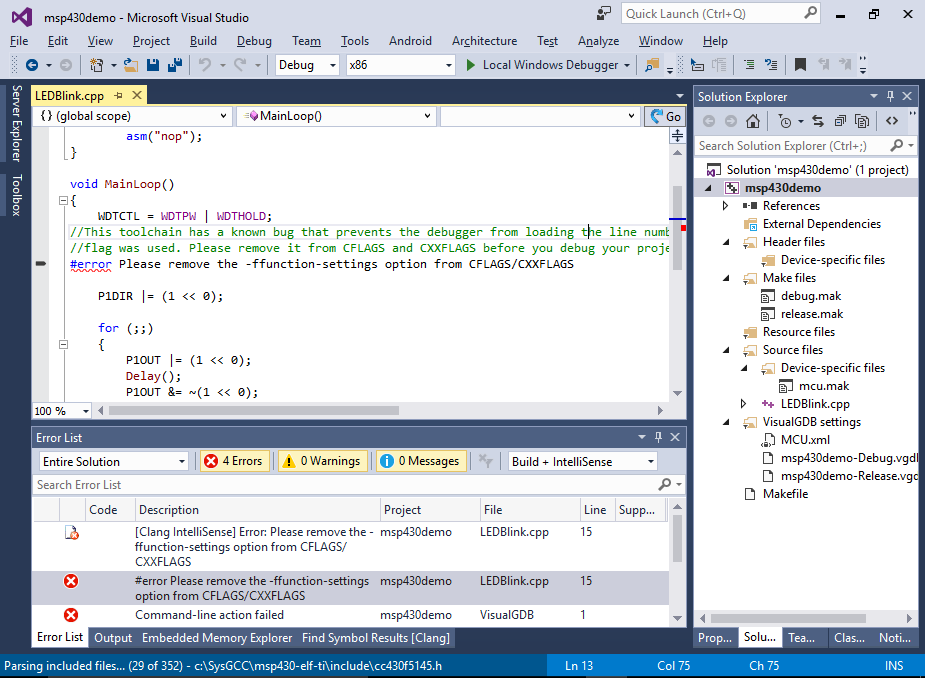 If you are using the TI toolchain, VisualGDB will warn you that the toolchain does not support the -ffunction-settings flag. Open VisualGDB Project Properties and remove the flag from both CFLAGS and CXXFLAGS:
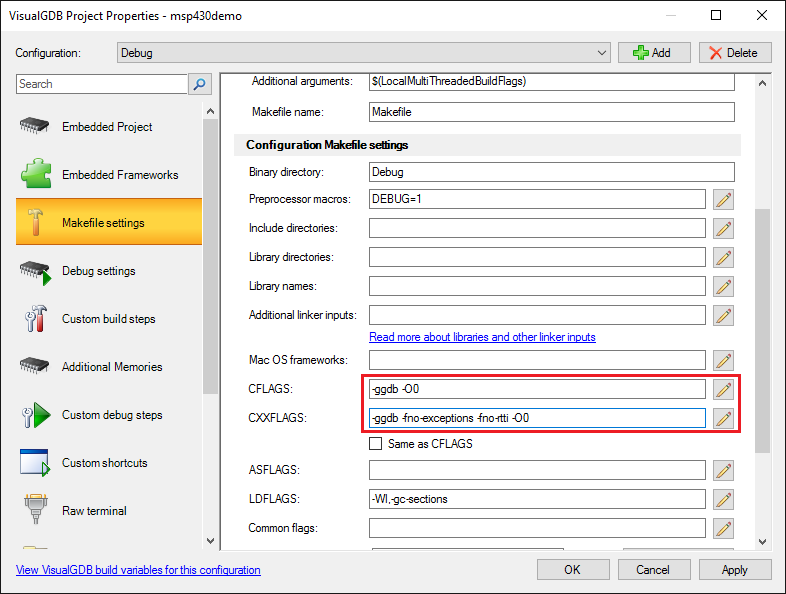
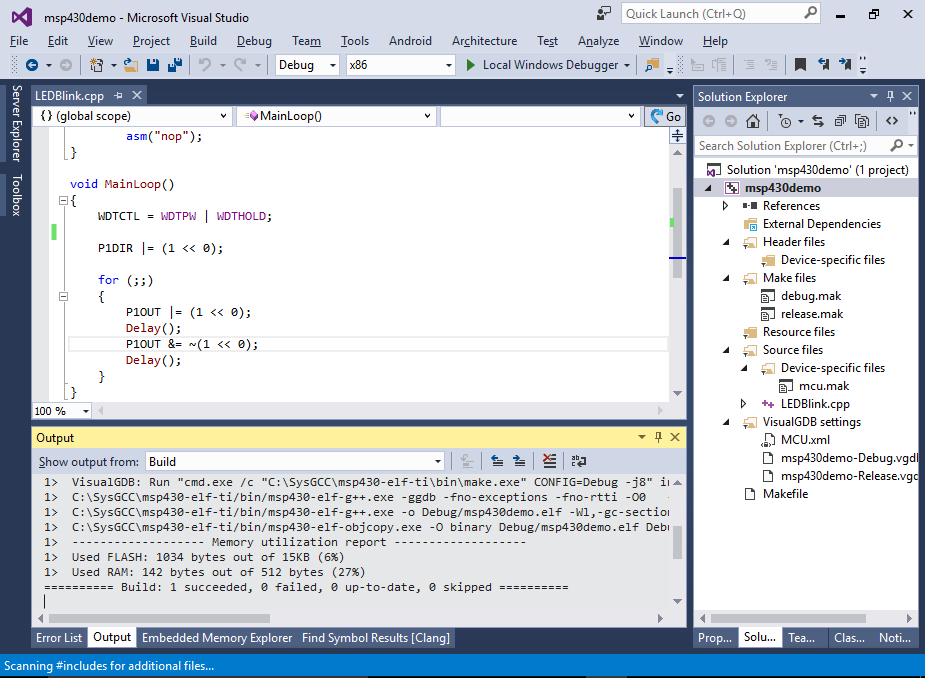
- Then remove the error directive from the main file. The project should now build successfully:
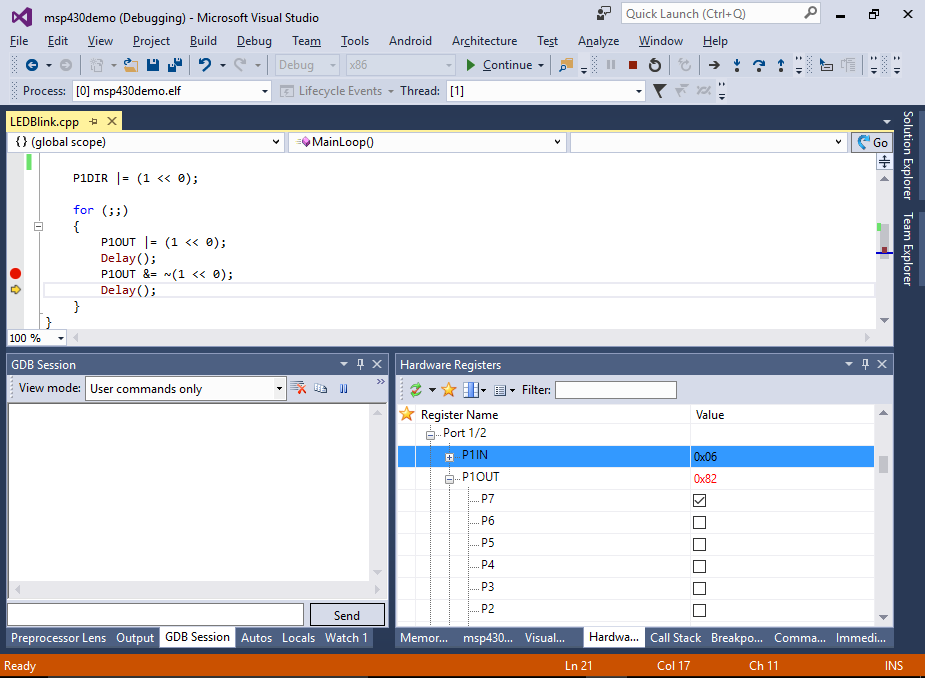
- To start debugging, put a breakpoint on the line assigning P1OUT, connect your device to the USB port and start the debug session by pressing F5. When the breakpoint is hit, open the Hardware Registers window via Debug->Windows->Hardware Registers:

- Step over the assignment line and observe how the register value in the Hardware Registers window got changed:
 You can step through your program, modify variable values, change next statement, just like you are debugging a Windows application. When done, press Shift+F5 to stop debugging.
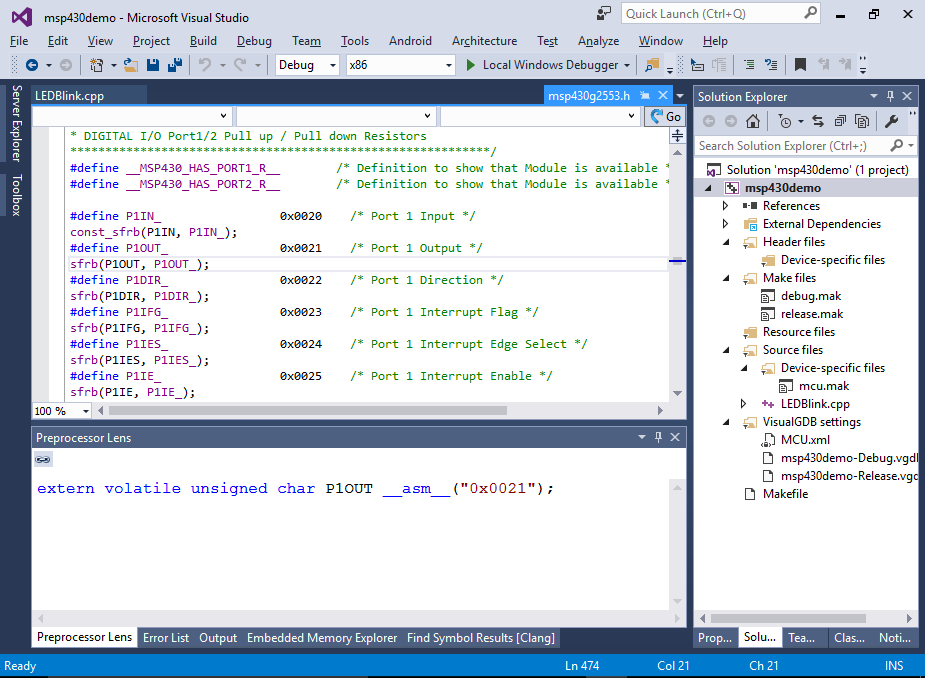
 - The MSP430 header files heavily rely on the complex preprocessor macros. You can simplify understanding them by right-clicking on the lines using them and selecting “Preprocess selected lines”. E.g. you can expand the ‘sfrb’ macro and quickly understand how the P1OUT variable is defined: