Diagnosing breakpoint problems on Linux
This tutorial explains how to solve breakpoint problems using VisualGDB’s breakpoint diagnostics feature.
Before you begin, please install VisualGDB 2.8 or later.
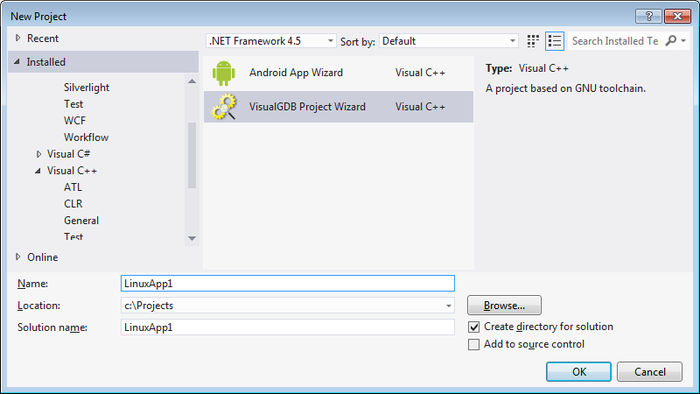
- We begin with making a new Linux project. Hence in Visual Studio go to File->New Project. There specify the name and location of the project and press ‘OK’.
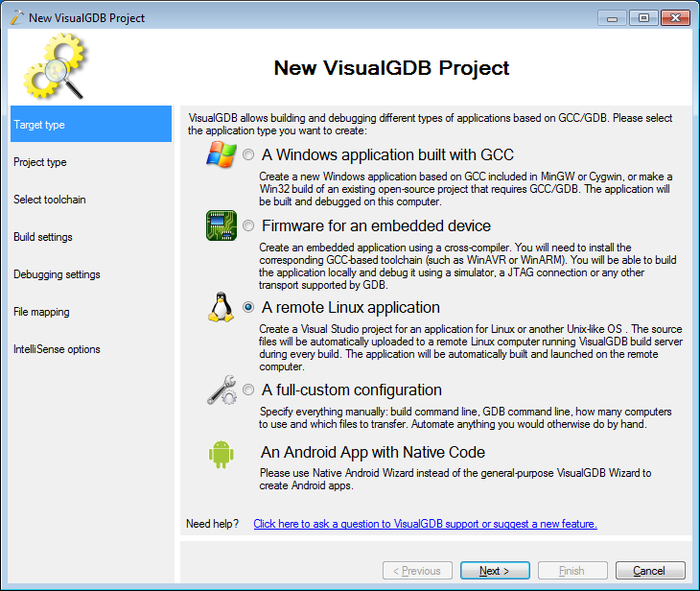
- Choose ‘A remote Linux application’. Press ‘Next’.
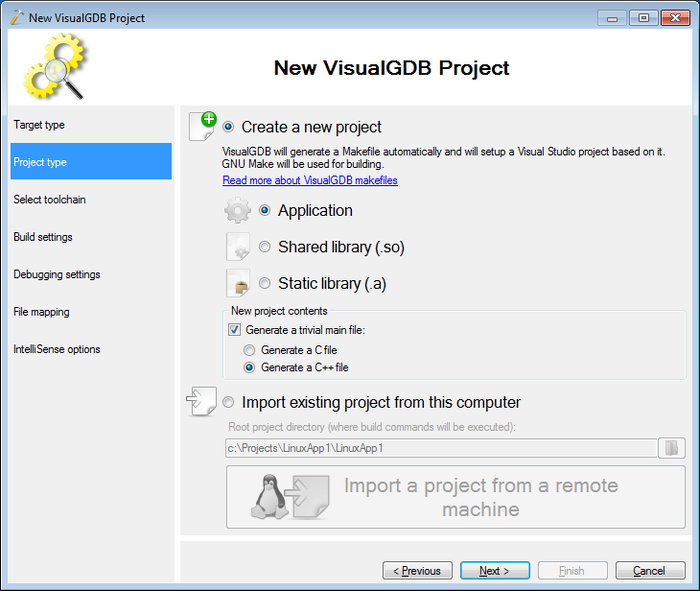
- Choose ‘Create a new project’. Press ‘Next’.
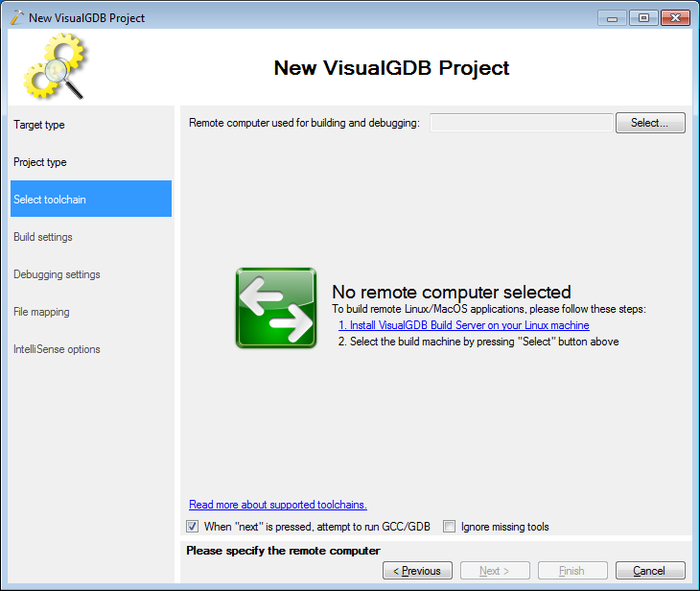
- Choose the Linux machine used for building and debugging. Press on ‘Select’.
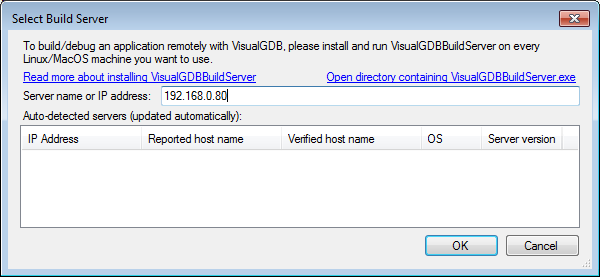
- Choose from list or enter the ip address of the Linux machine. Press ‘OK’.
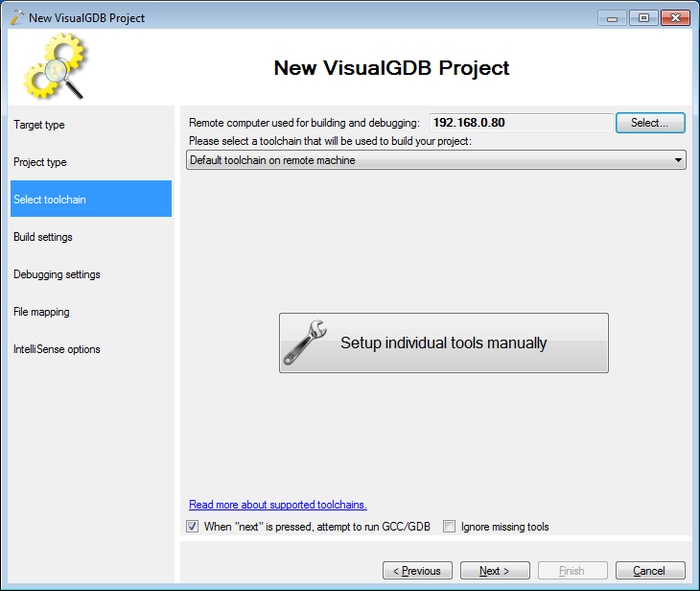
- As we want to use just the default toolchain on the Linux machine, we do not need to change any of the tools. Press ‘Next’ and the toolchain will be tested.
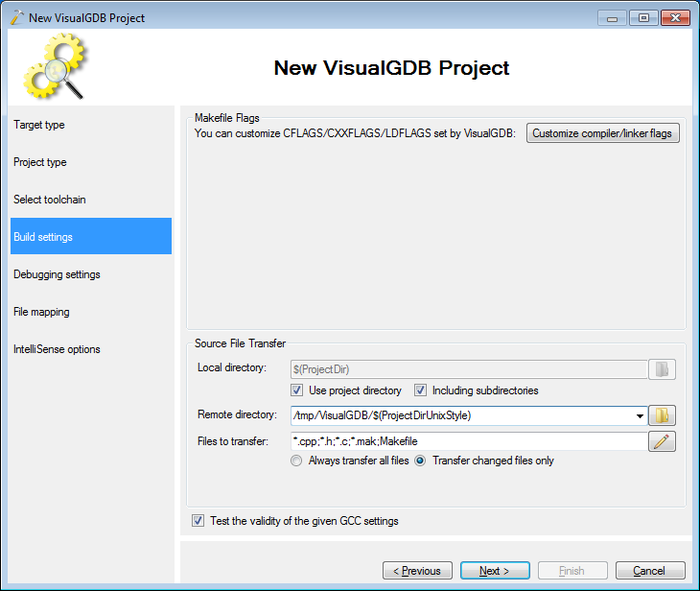
- Make a note of the directory in tmp where the project files will be automatically copied to. We do not need to make any changes on this page, so press ‘Next’.
- We do not need to change any debug settings, so press ‘Next’.
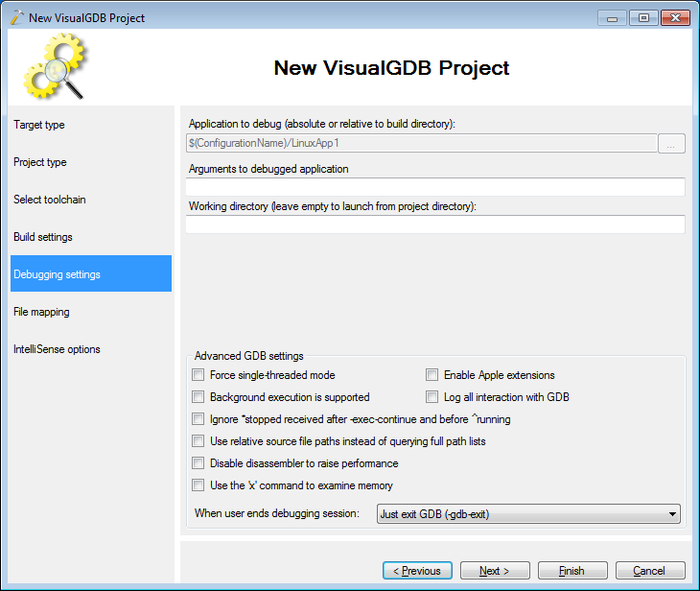
- We are currently not going to add any file mappings, press ‘Next’.
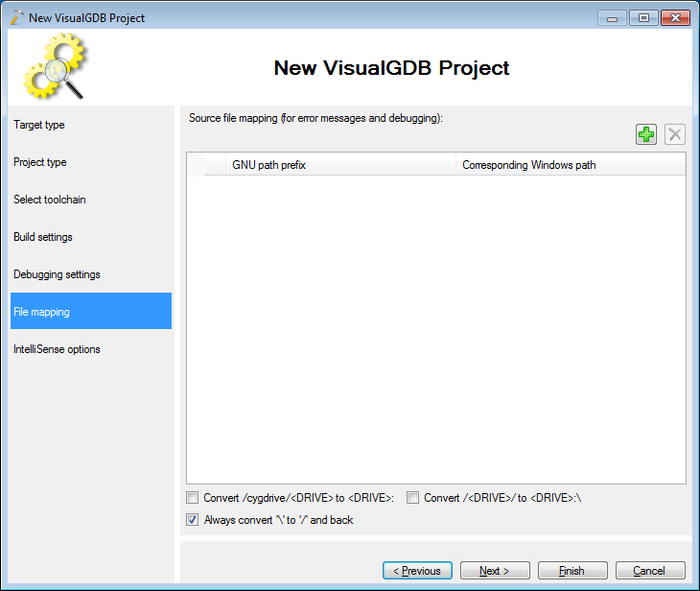
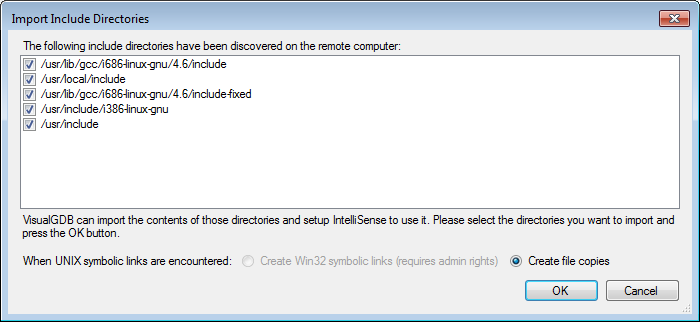
- Import the system includes to the IntelliSense. Click on the link to import the includes automatically. Press ‘OK’ and in the wizard press ‘OK’.
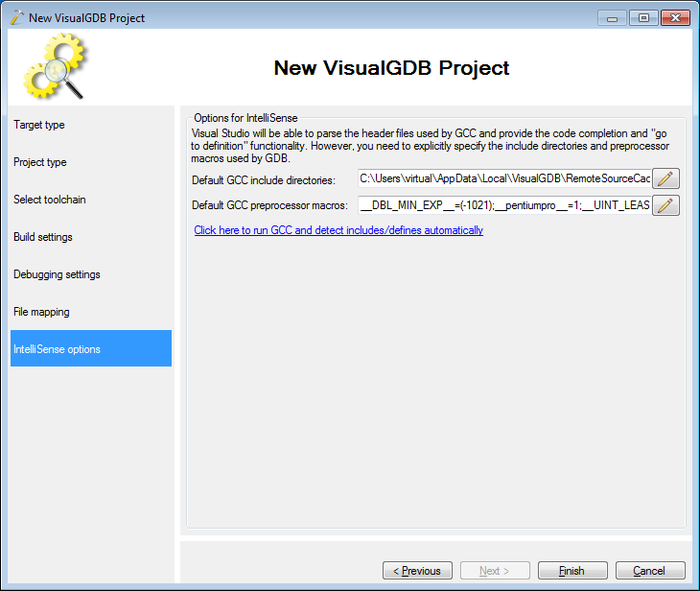
- Build the solution in Visual Studio at Build->Build Solution.
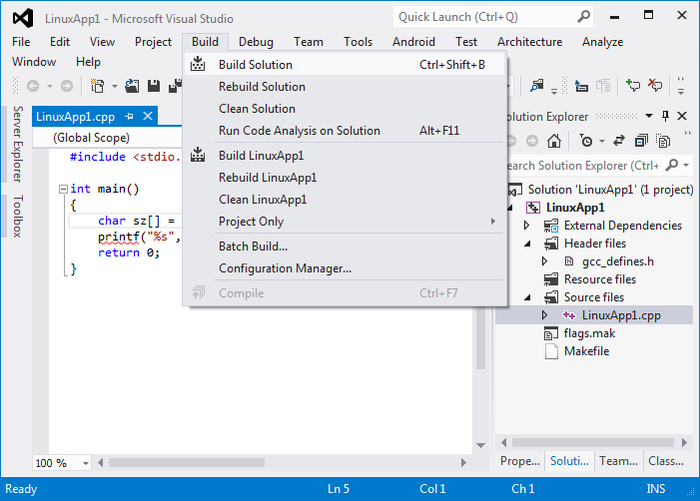
- Set a breakpoint in the main function and start debugging.
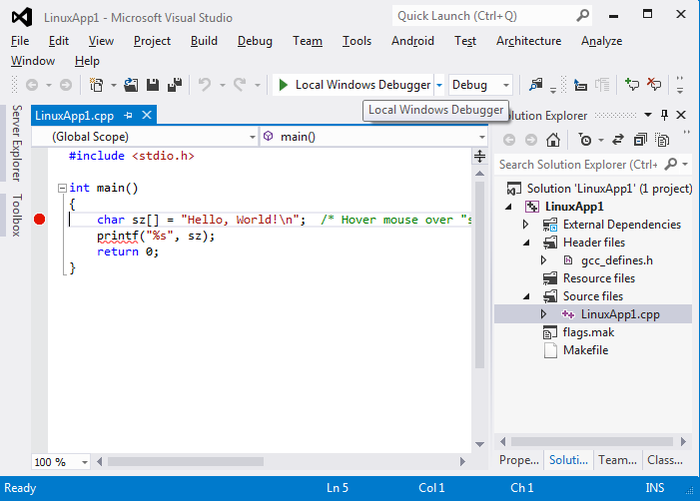
- Note that the program stops at the breakpoint. Hence currently the project is correctly set up.
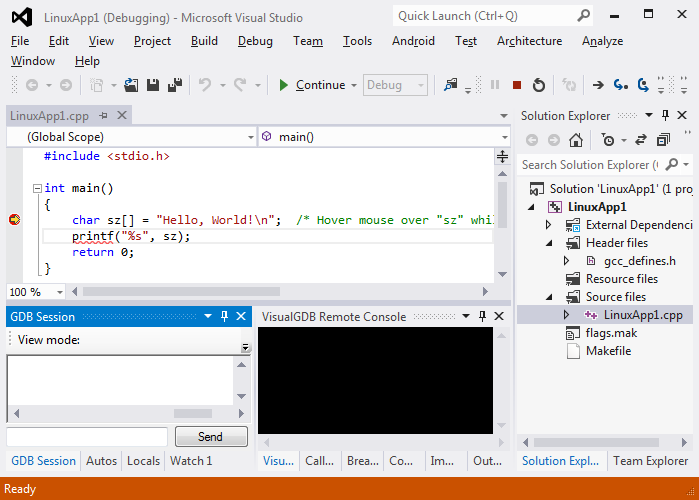
- Now we make some changes to the project to introduce a breakpoint problem. First create a new header file somewhere on the Linux machine, but not in the same folder the rest of the project is in tmp. In this example we create an header file called func.h in /tmp with the following content.
int func() { return 42; } - Then go back to the Visual Studio solution and add the inclusion and usage of this new func function. So, the main cpp file looks something as follows.
#include <stdio.h> #include "../../../../../func.h" int main() { int i = func(); char sz[] = "Hello, World!\n"; printf("%s", sz); return 0; } - Now copy the func.h file to some directory outside the project directory on the Windows machine. We copy it to C:\Temp\func.h.
- Next we add this file to the project by right clicking on the ‘Header files’ folder of the project and selecting Add->Existing Item.
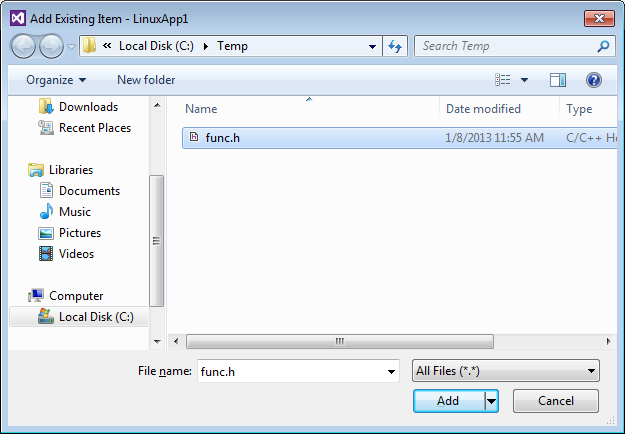
- Open func.h and set a breakpoint inside the func function.
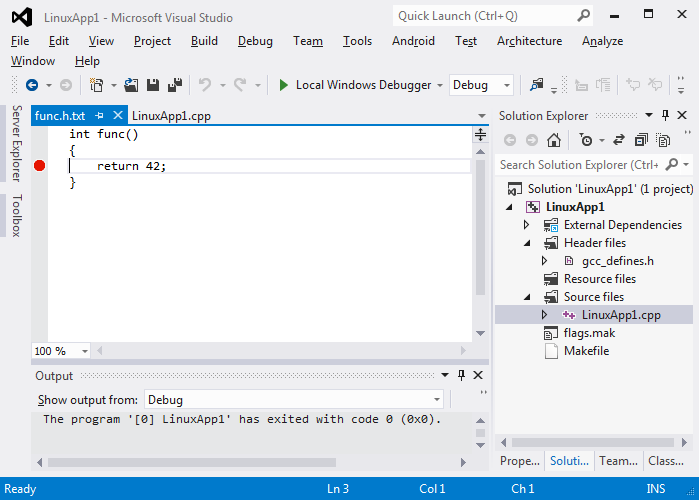
- Build the solution and start debugging. Note that debugging does not stop at the breakpoint in the new func function, as VisualGDB does not that you have copied /tmp/func.h to c:\temp.
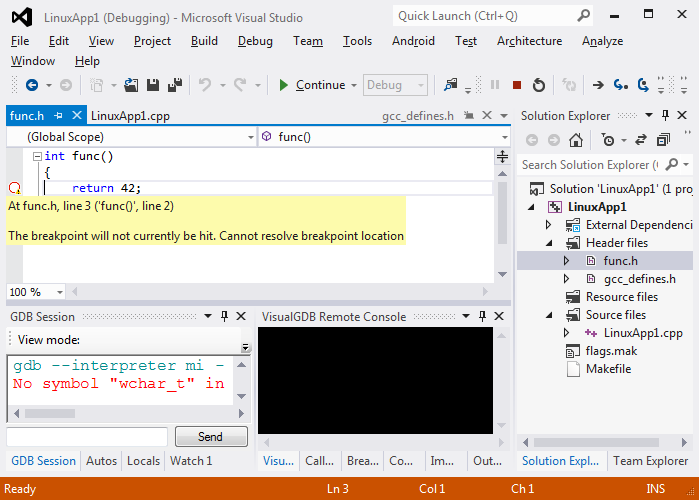
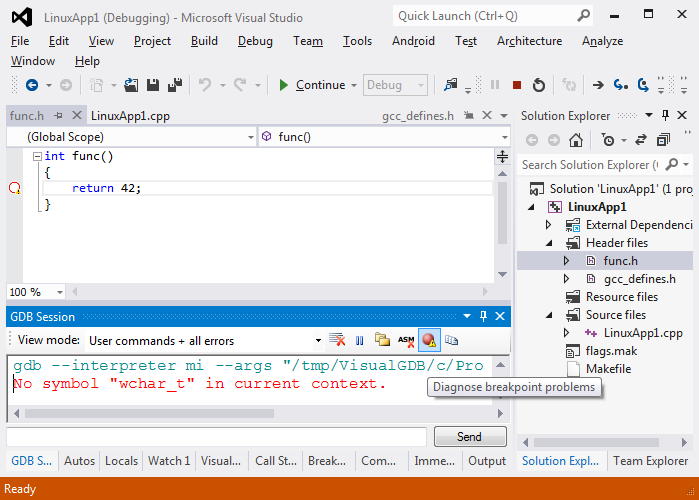
- Open the breakpoints diagnostics window from the ‘GDB session’ tool window.
- Select the source file in the list. As you can see, VisualGDB does not know how to translate it into a valid path on the Linux machine, so it tries c:/temp/func.h as the last resort, that is wrong in this case.
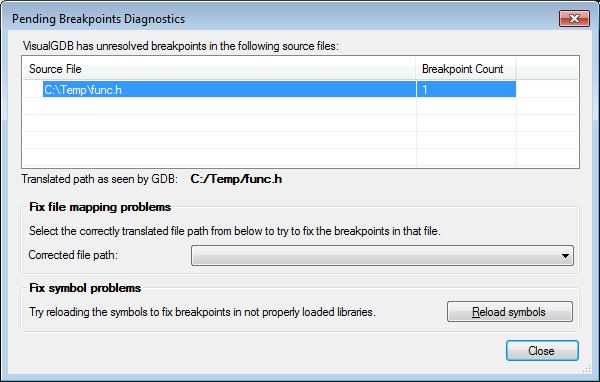
- Select a corrected file path from the suggestion list. The list is built based on the debugging symbols that contain file paths on the Linux machine, so it will actually contain the correct path.
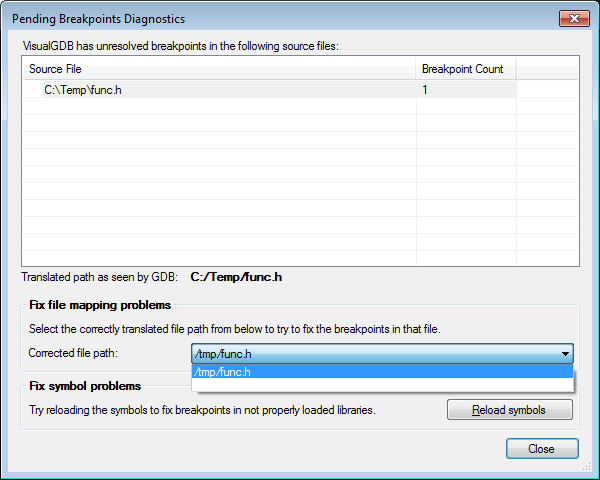
- VisualGDB will help you create a path mapping rule to resolve problems in further files copied from the same directory. Select an appropriate mapping from the suggestion list and press ‘Add’.


- Notice how both in Visual Studio and the diagnostics window the breakpoint is marked as fixed. Close the diagnostics window.
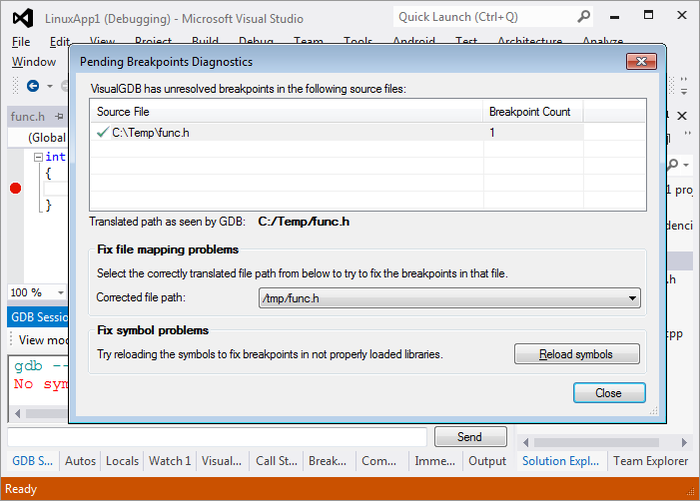
- Restart debugging. Notice how the breakpoint now works due to the added rule.
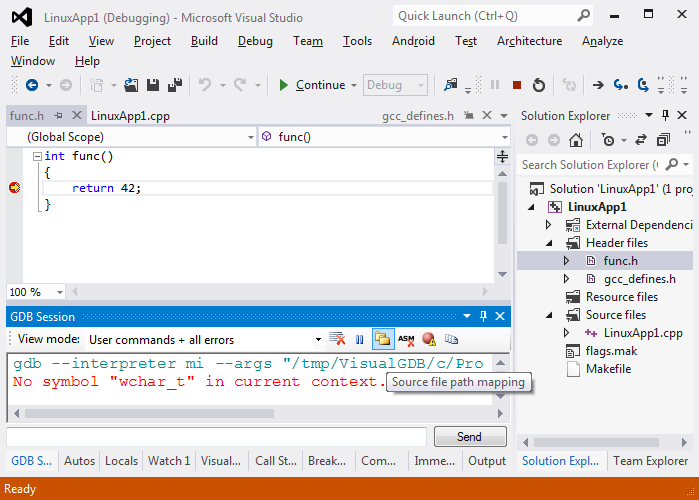
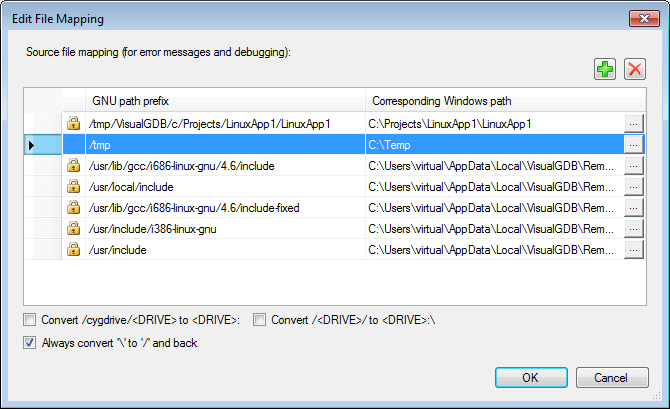
- Open the file mappings window from the ‘GDB Session’ tool window. This window lists all the file mappings used for debugging. Note that many of them are added by default, such as the project directory and the system includes. Due to our added rule, the extra file added to the project is now also in the list.
