Diagnosing Debugging Symbol Load Errors for Linux Applications
This tutorial shows how to diagnose common problems with debugging symbols for Linux C/C++ applications. We will create a basic application with VisualGDB, break the debug symbol generation to illustrate common project setup problems and will then show how to check the ELF files for debug symbols and restore the settings required for generating the debug information.
Before you begin, install Visual Studio and VisualGDB.
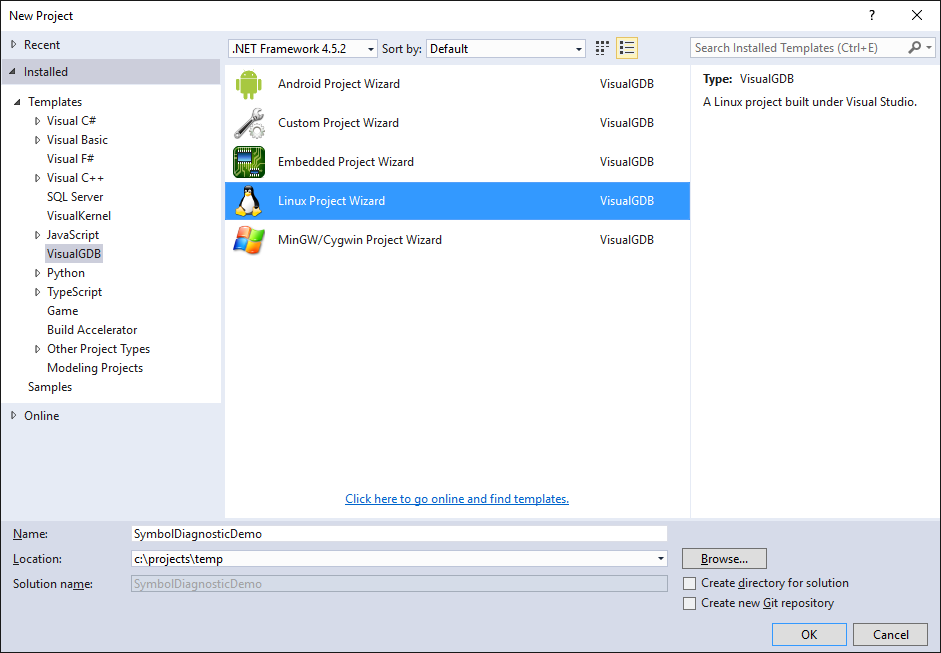
- Start Visual Studio and open the VisualGDB Linux Project wizard:
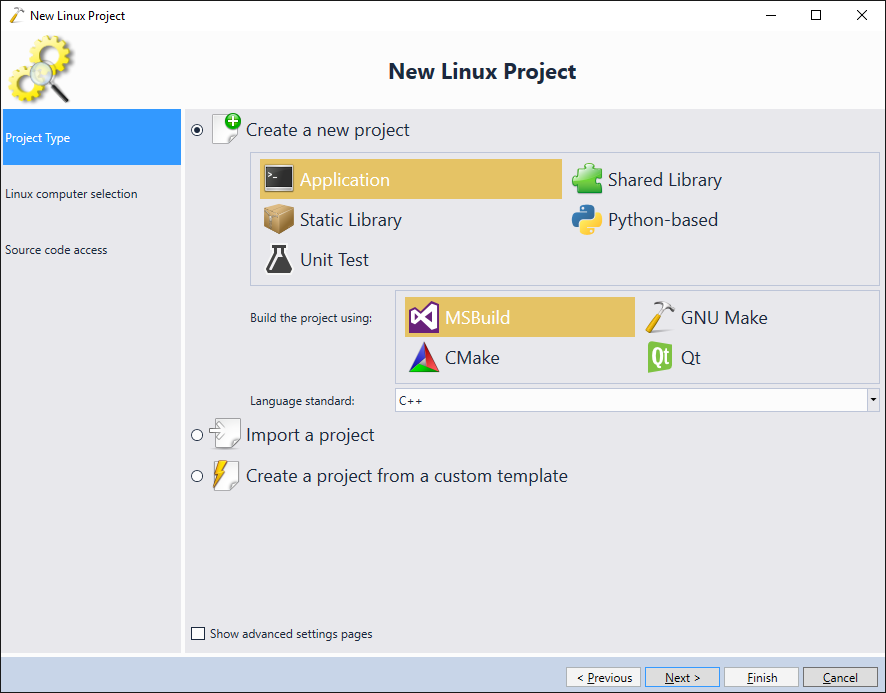
- Proceed with creating an MSBuild-based application:
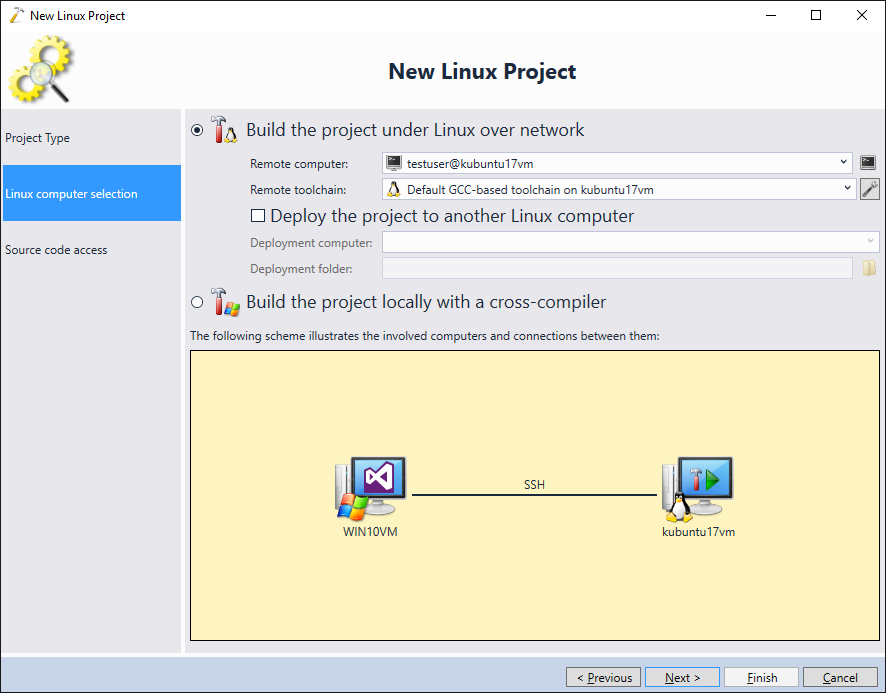
- Select the Linux machine you would like to use for building the code:
- Proceed with the default source code access settings:
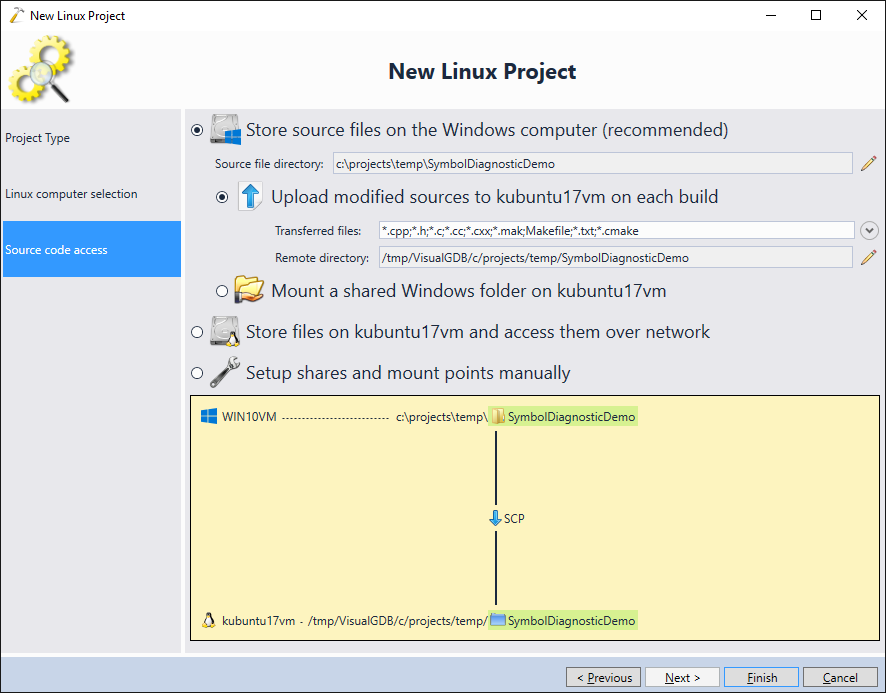 Then press “Finish” to create the project.
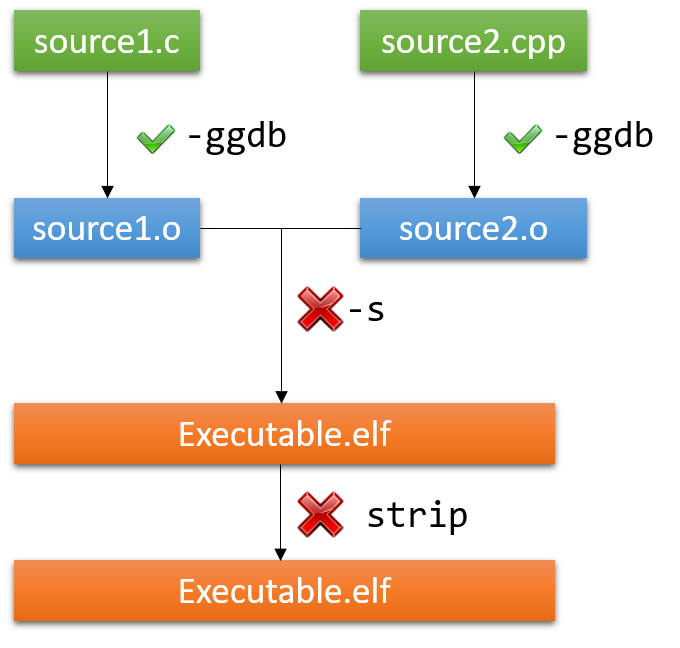
 - In order to successfully debug your project, the final ELF file needs to have debug symbols – information relating addresses in your program to specific source lines and variable names. This information is generated when you pass “-ggdb” to the gcc arguments when compiling each source file and and might be removed from the final executable by either specifying “-s” in the linker flags or using the “strip” tool after the linking:
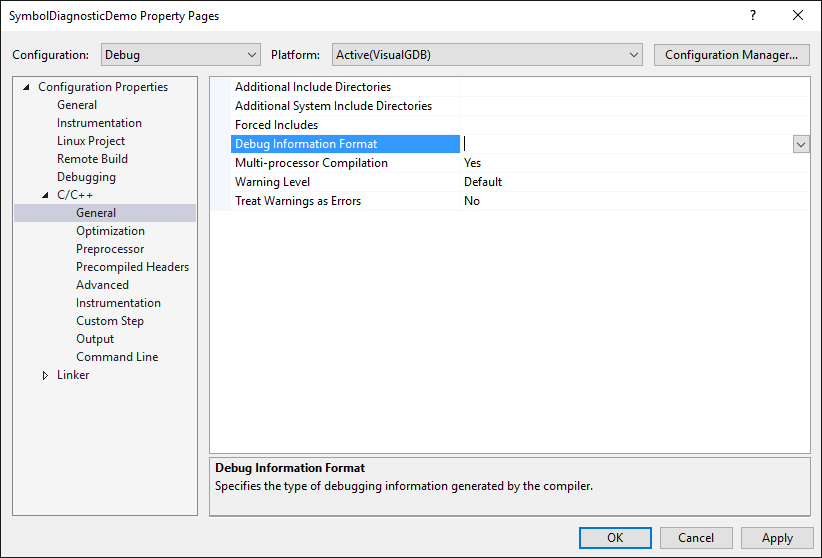
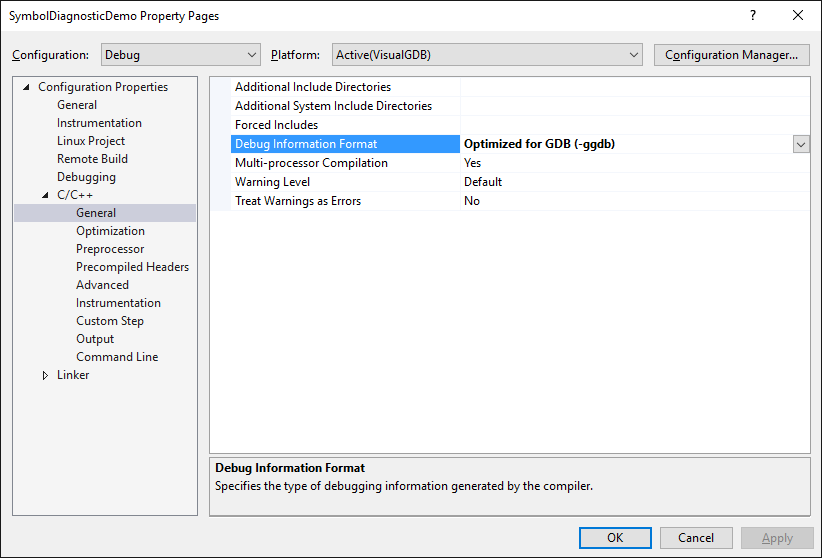
- We will now show what happens if the debug information is removed from the executable and how to track back the option responsible for removing it. Open VS Project Properties and clear the “Debug Information Format” setting under C/C++->General:
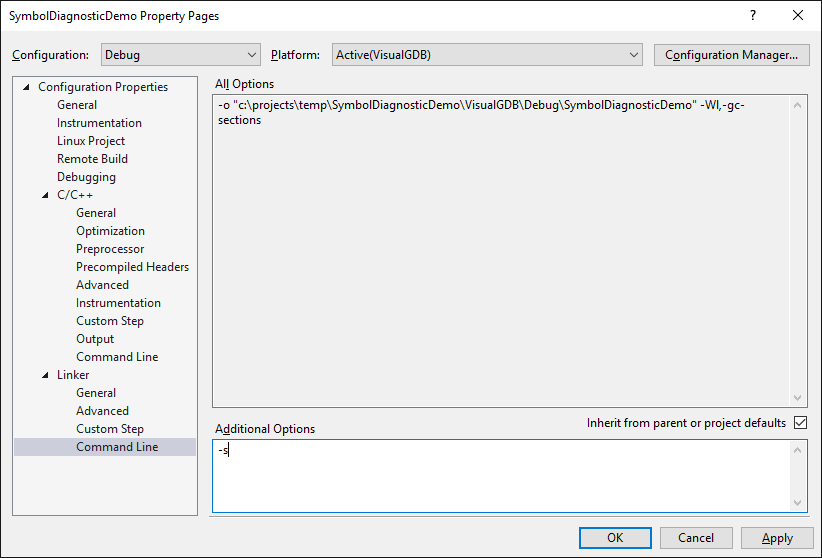
- Go to the Linker Settings and add “-s” to linker command line:
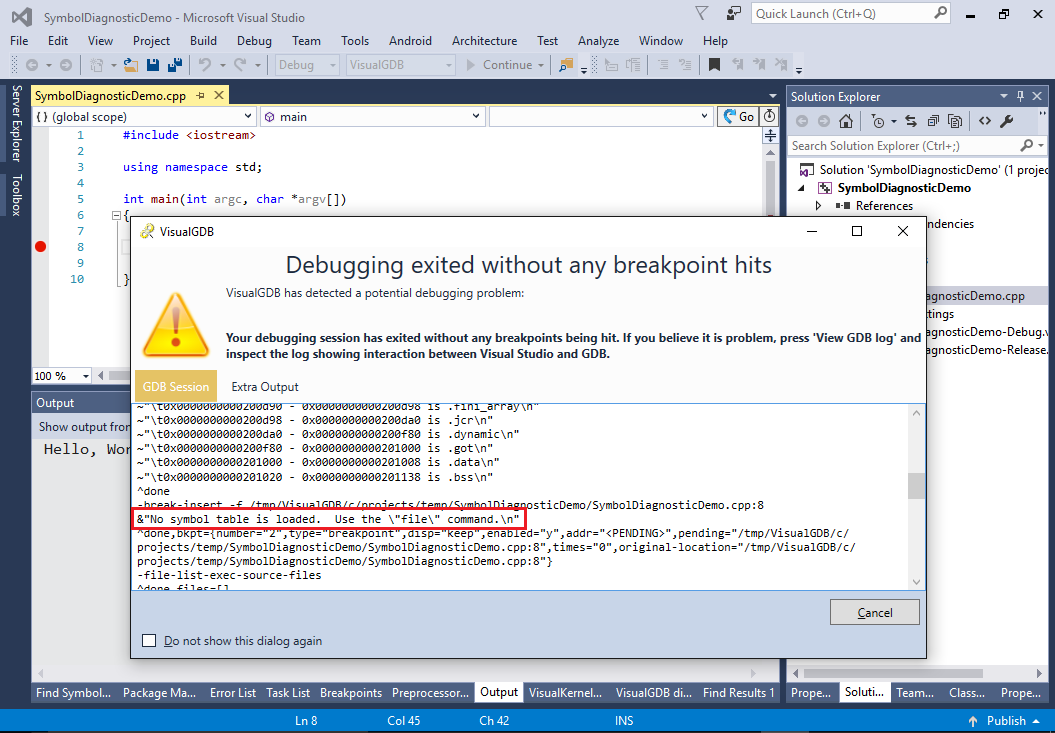
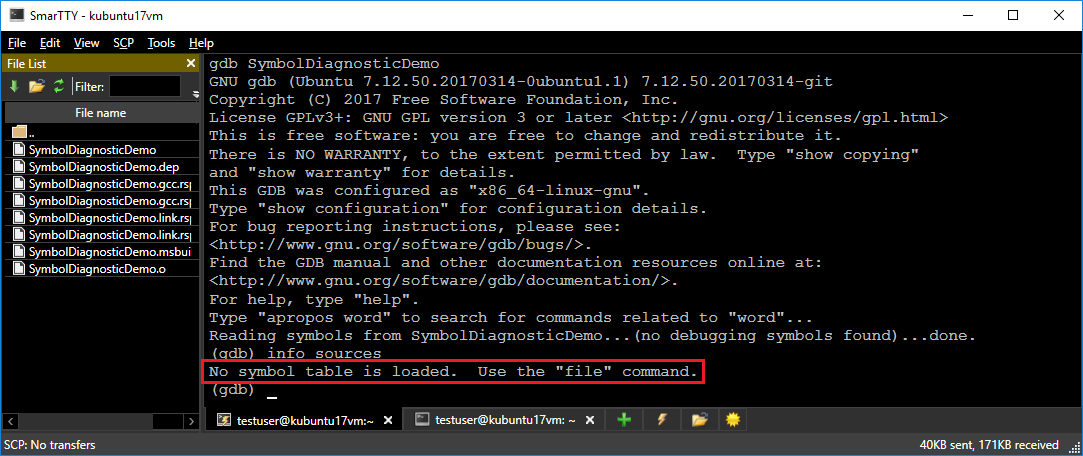
- Set a breakpoint in main() and try debugging the program. VisualGDB will warn that the program exits without triggering a single breakpoint. The GDB Session log will contain the following line:
No symbol table is loaded. Use the "file" command.
- This message means that the program debugged by gdb is missing the debug symbols. The first step of diagnosing it would be to locate the binary on the build machine and run the following command on it:
objdump -h <ELF file> | grep debug
- If the output is empty, locate some of the .o files corresponding to your source files and run the same command on them:
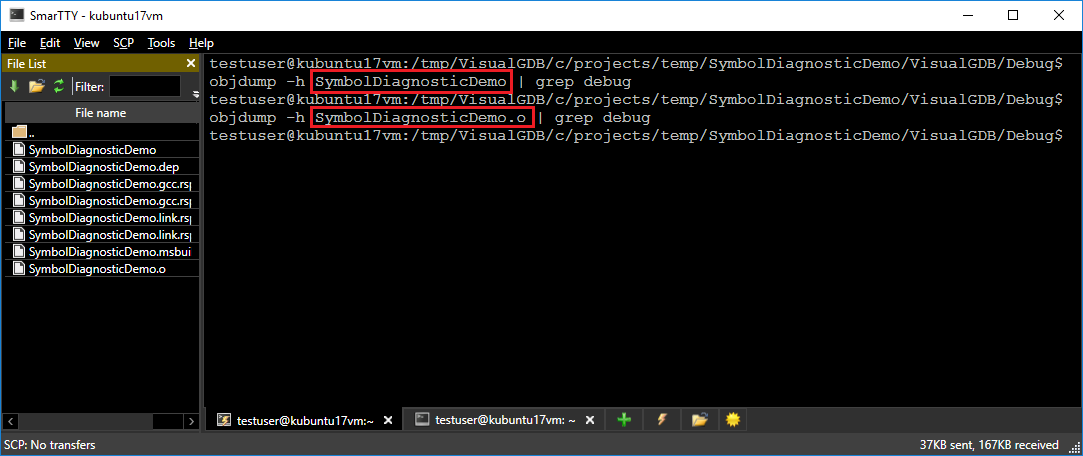 In this example the output is empty for both the final ELF file and the .o file (since we have disabled debug information generation via C/C++ compiler settings).
 - You can also open the file in gdb and run the “info sources” command (same will work for the .o file) to double-check this. GDB will respond that no symbols are present:
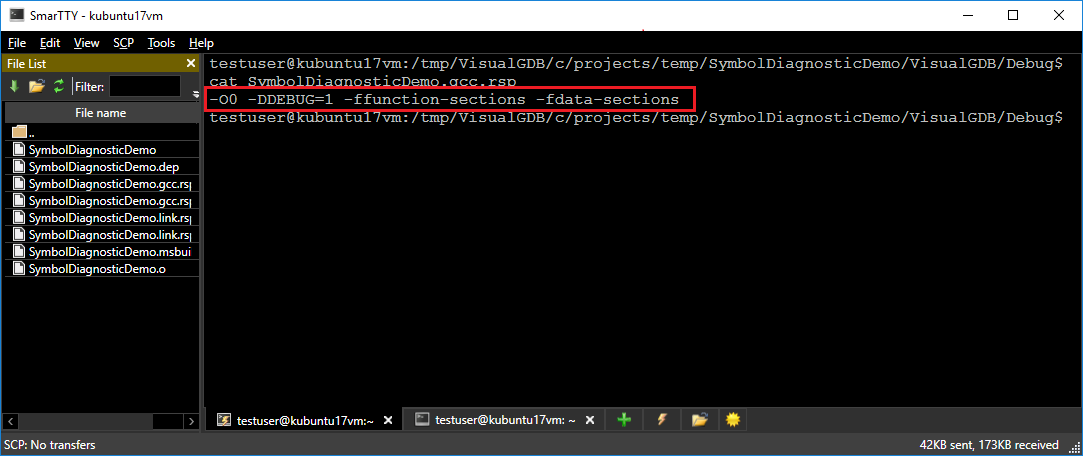
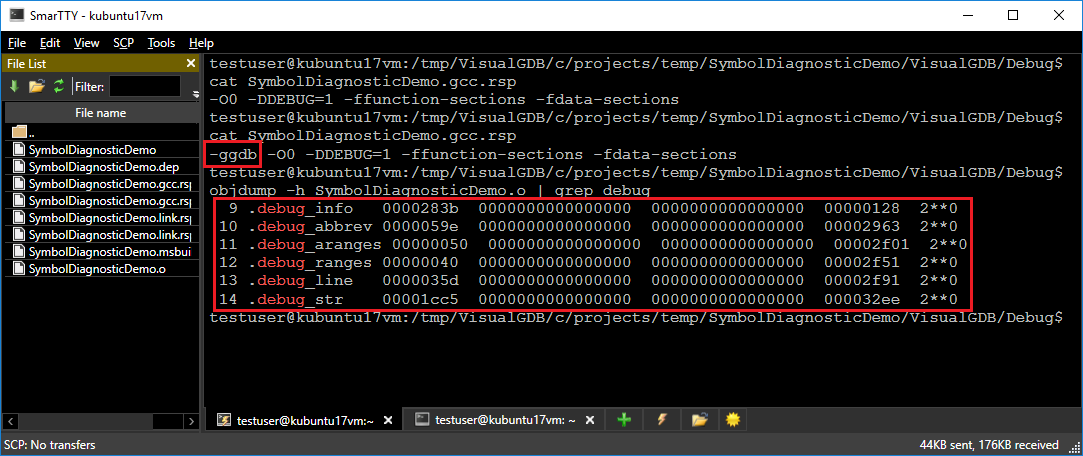
- Since the .o files don’t have the symbols either, we narrowed down the problem to the missing -ggdb flag. For MSBuild projects the flags are stored in the .gcc.rsp files, however if your project is built via custom Makefiles, you might need to enable verbose build mode (e.g. V=1, _V=1 or VERBOSE=1) to see the full command line:
- Go to VS Project Properties and restore the Debug Information Format setting:
- Build the project and re-run the objdump commands. See how the .o file now contains .debug_xxx sections storing the debug symbols:
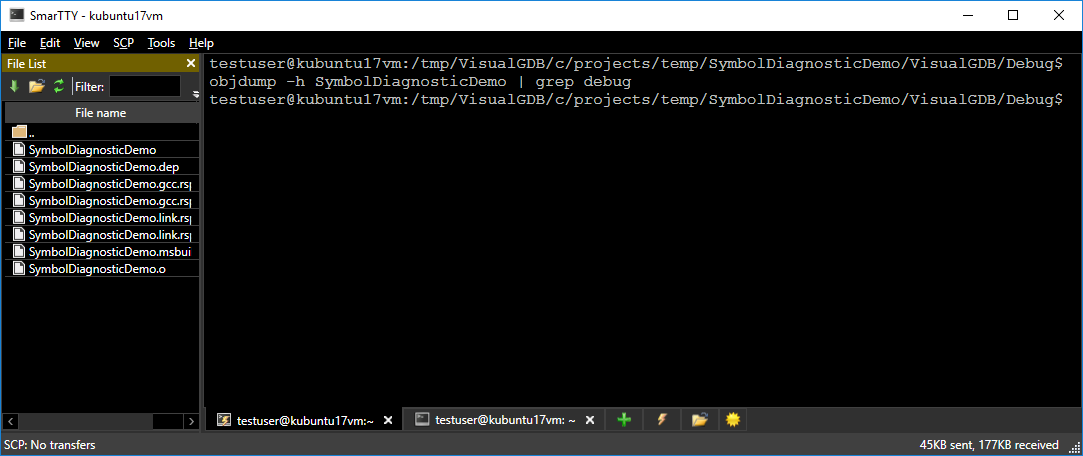
- The final ELF file is still not debuggable as we did not remove the “-s” option from the linker settings. Running objdump on it will confirm this:
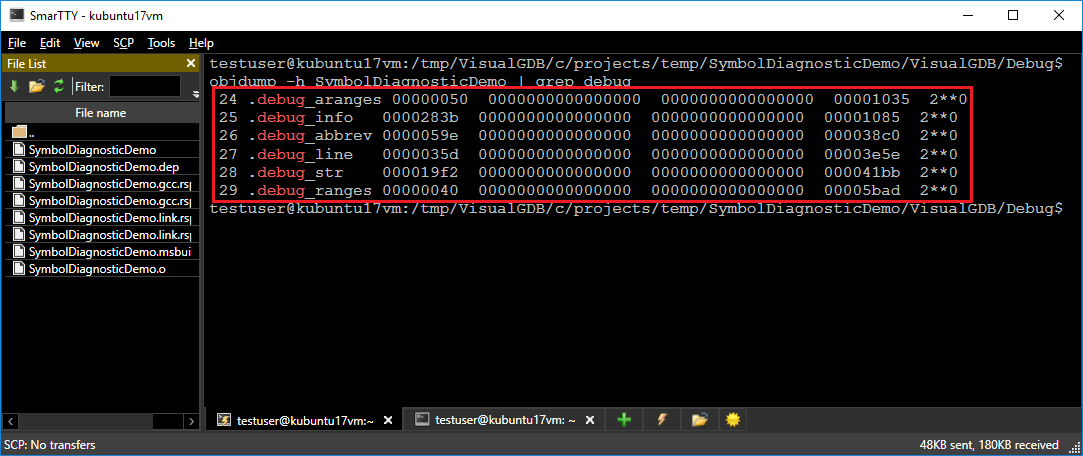
- If you observe this with your projects (debug information in the .o files, but not in the final ELF file), check that the linker command line doesn’t contain the “-s” switch. Once you remove it from the project properties, the debug information will get propagated to the final ELF file:
 If the command lines look correct, but the symbols are still not propagated (or generated), try copying the command line from the logs, removing the .o (or ELF) file, running gcc manually and recheck the generated file. You may find out that the custom Makefiles you are using are not displaying all build flags correctly or they do a some custom post-build step that removes the debug information.
 - You can also explore the debug information by running “objdump -g <ELF file> | less”:
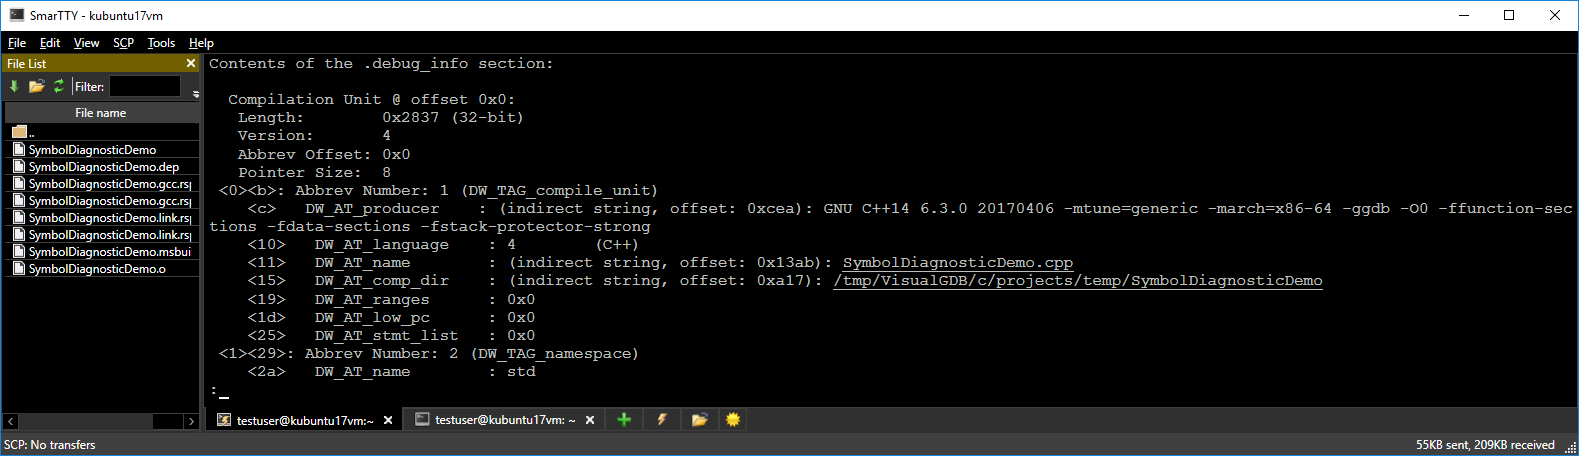 Scroll to the contents of the .debug_info section and check for the “Compilation Unit” records. Each source file compiled with debug symbols will have a corresponding record listed in the final ELF file.
 - Another reason why the debug information could be missing is the ‘strip’ tool. It dramatically reduces the size of the ELF binaries by removing debug information from them (also breaking source-level debugging). You can try running it on your executable and compare the sizes before and after it (also confirming that the .debug_xxx sections disappear):
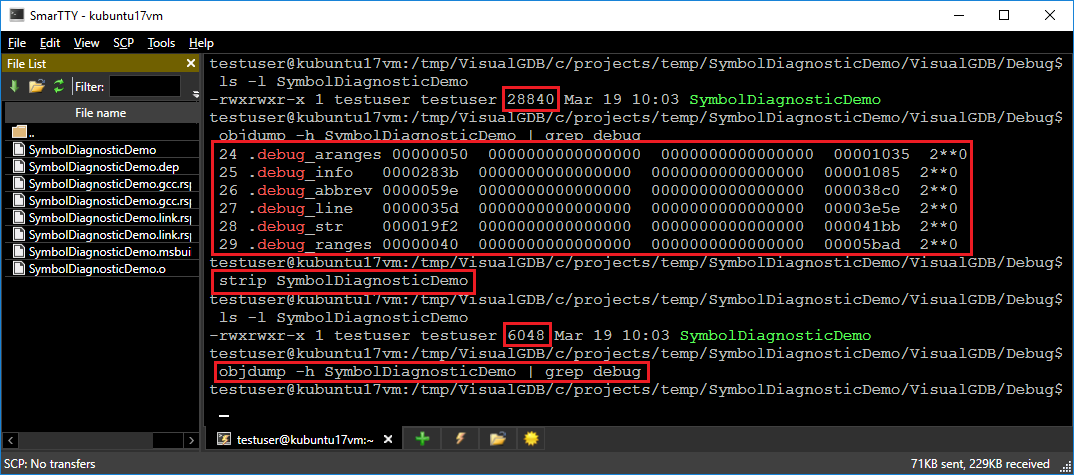 If running the link command line manually produces an executable with valid symbols, but the final executable built by your Make scripts doesn’t have them, most likely the Make scripts run the ‘strip’ tool to reduce the binary size. In this case disabling this command for debug builds should get debugging to work.