Debugging the hello-jni project with Visual Studio
This tutorial shows how to build and debug the hello-jni simple sample from Android NDK.
Before you begin, please install VisualGDB 2.0 (ensure that “Android Edition” is checked in the installer).
You will also need to install Java JDK, Android SDK, NDK and Apache ANT.
Step-by-step tutorial
- Start Visual Studio. Select File->New project->VisualGDB->Android Project Wizard.
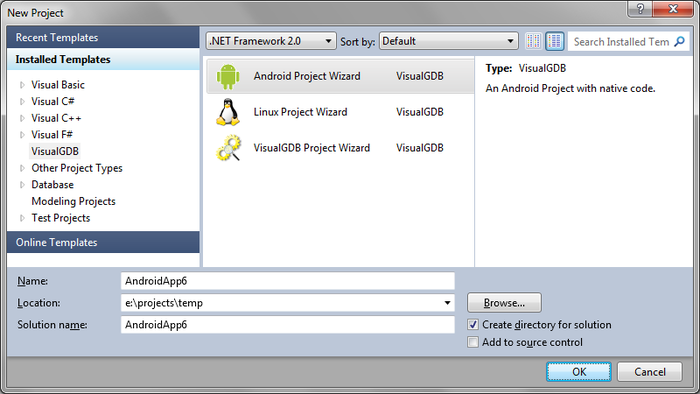
- We will make a copy of the hello-jni sample project to experiment with it leaving the original files untouched. Please select a directory and a name for the project copy.
- If you are running VisualGDB Android wizard for the first time, please press the “Configure NDK/SDK locations” button to tell VisualGDB the locations of your Android-related tools. If you don’t have any of the tools installed, simply press the “install” button.
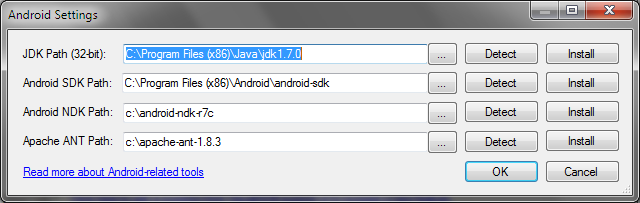 WARNING! After installing Android SDK please run the SDK manager as Administrator and install the Tools (SDK tools/Platform tools) and all required Android APIs (at least Android 1.5 and 2.3.3).
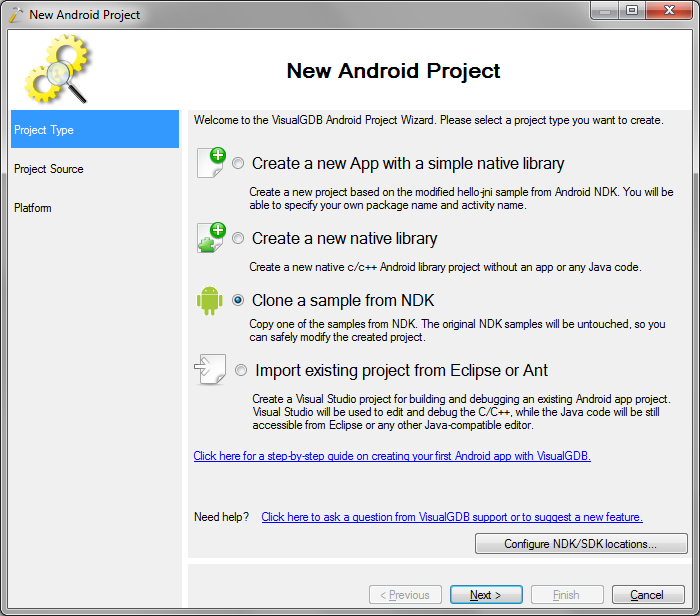
 - In this tutorial we are creating a copy of an existing NDK sample. Please select the option to do this:
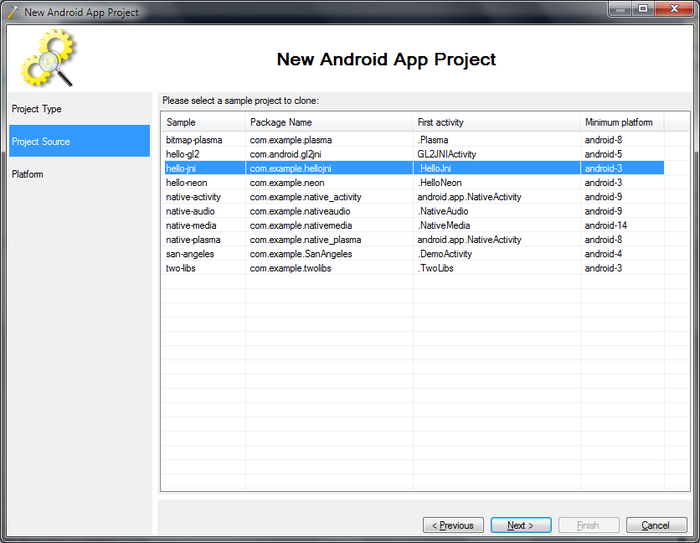
- The next page allows selecting a sample project to copy. Please select hello-jni and press “next”.
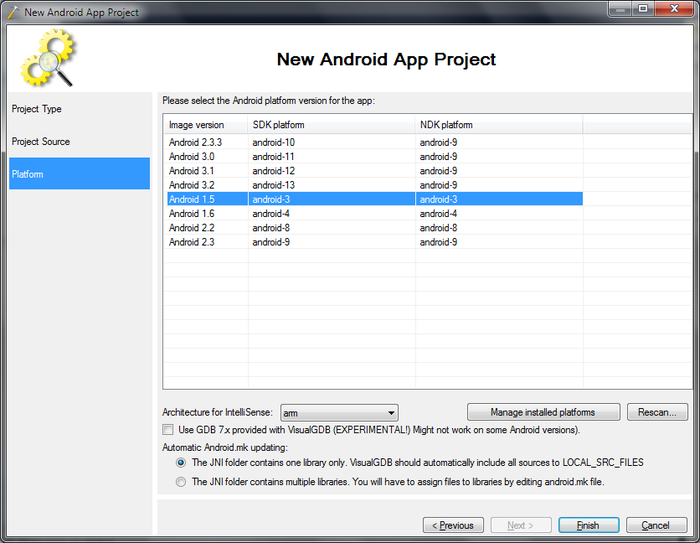
- Finally VisualGDB wizard will ask you for the targeted Android platform. You will be able to change the platform in the VisualGDB project settings later. Please select Android 1.5 for now.
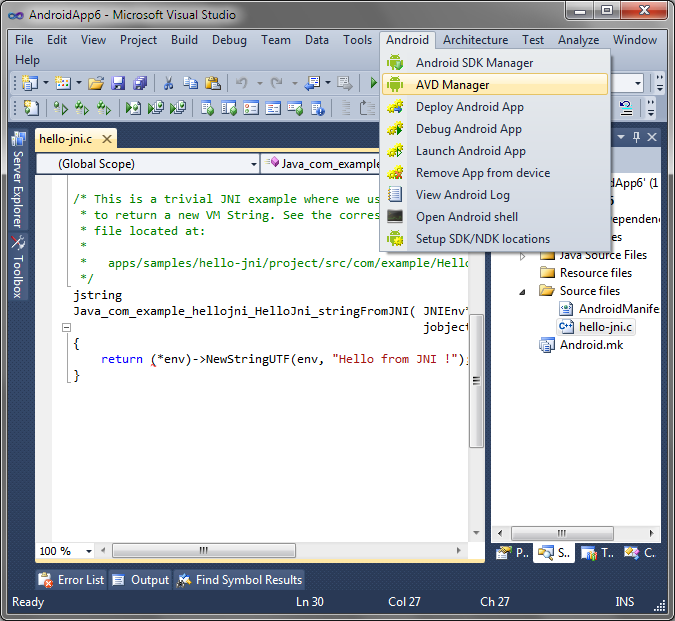
- When you press “Finish”, VisualGDB will create a copy of the hello-jni sample for you. If you have an Android phone or a tablet, you can enable USB debugging on it and connect it to your PC. If not, please start the Android simulator (AVD Manager) by selecting “Android->AVD Manager” in Visual Studio:
- If you have no virtual devices defined by now, please create one. It is recommended to specify at least Android 2.3.3 as the simulator platform.
- Start the virtual device. While it is booting, go to Visual Studio, and select Build->Build Solution.
- Once the solution has been built, please ensure that the virtual Android device has been started.
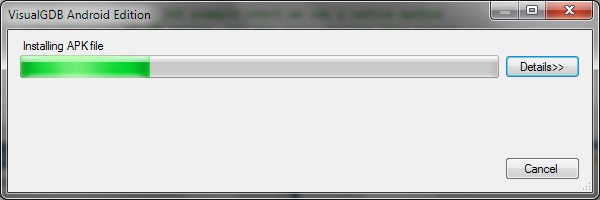
- Once the device is ready, go to Visual Studio and select Debug->Start Debugging with GDB. VisualGDB will deploy the APK file automatically and will start a debugging session.
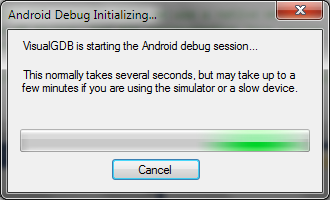
- If you are using the simulator instead of a real Android device, it might take up to several minutes for the debugging to start.
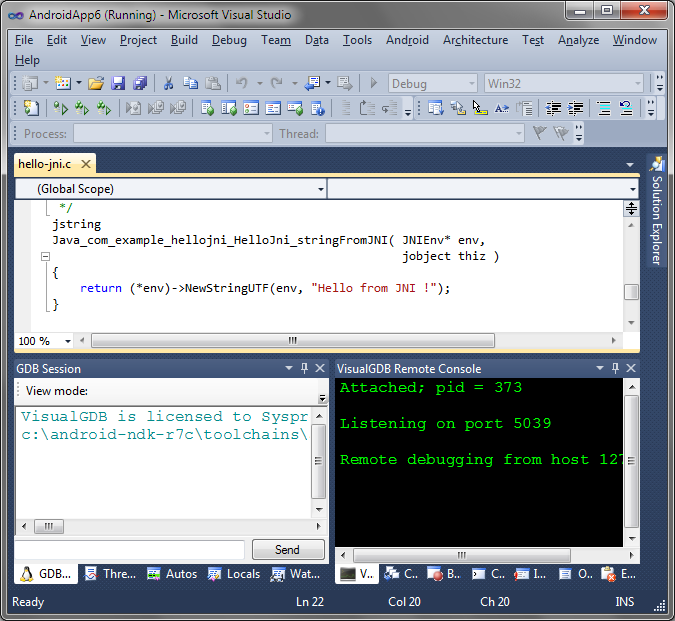
- Once the debugging is started, you can use the Visual Studio interface to set breakpoints, stop program execution, step through code or inspect variables. You will additionally see the output from the gdbserver in the Remote Console window:
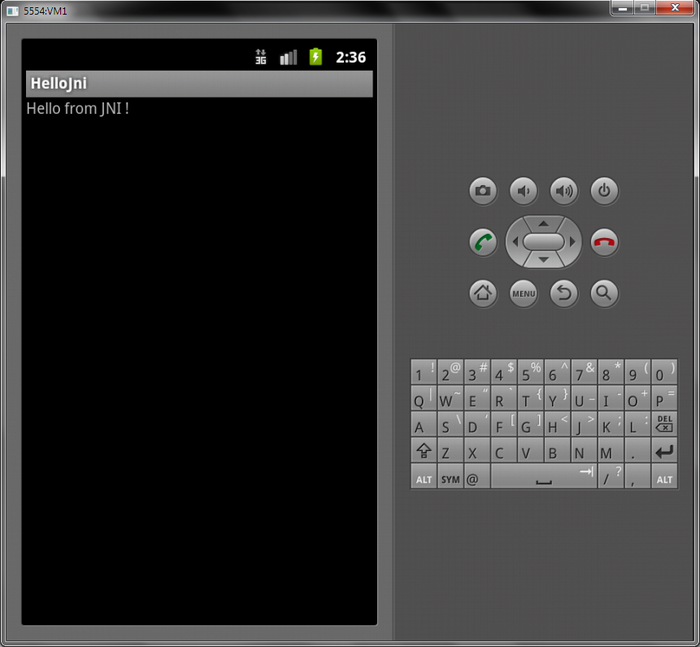
- Go to the simulator and ensure that the app has been started.
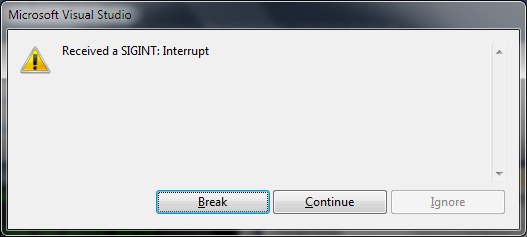
- As the native function is only invoked during startup when the debugger is not yet attached, setting a breakpoint there won’t result in any hits. You can either modify the Java code to call the native function continuously, or use the Debug->Break All command:
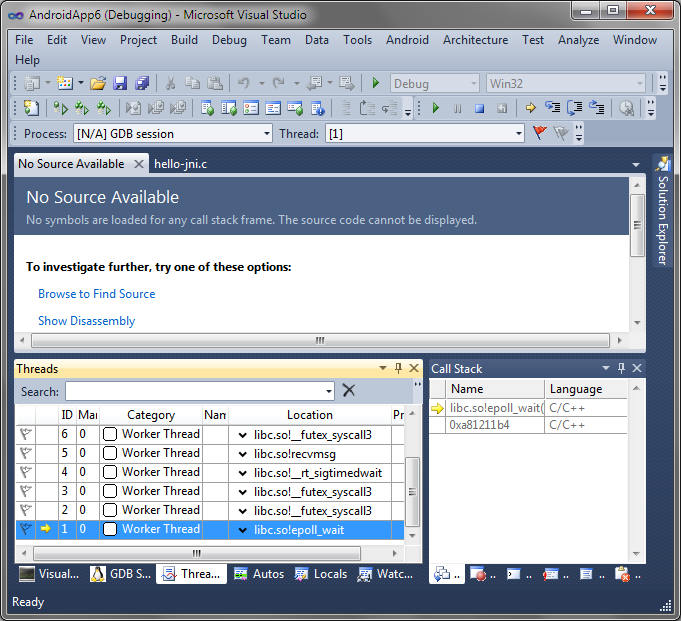
- You can use the Threads and Call Stack windows to observe currently running threads and their stacks:
- When you are done debugging, press Shift+F5 to close the app.


