Co-debugging hello-jni with Eclipse and Visual Studio
This tutorial shows how to debug the hello-jni project with both Eclipse and Visual Studio:
- Eclipse will be used to debug the Java part of the project
- Visual Studio will be used to debug the C/C++ part of the project
Both debuggers (Eclipse and Visual Studio) will be attached to the application at the same time allowing you to debug both Java and C++ code simultaneously. For simplicity we’ll use the hello-jni project provided by Android NDK.
Before you begin, please install VisualGDB 2.0 or later (ensure that “Android Edition” is checked in the installer) and Eclipse with the ADT plugin.
- First, copy the <NDK_directory>\samples\hello-jni folder to a new location (e.g. e:\projects\android\hello-jni). We will use this copy for debugging leaving the original sample untouched.
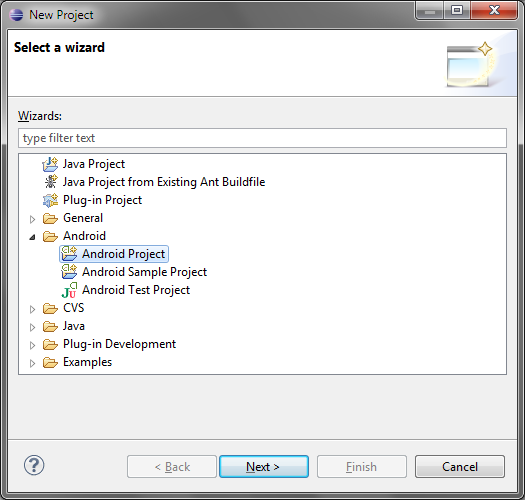
- Start Eclipse. Select File->New->Project. Then select Android->Android Project.
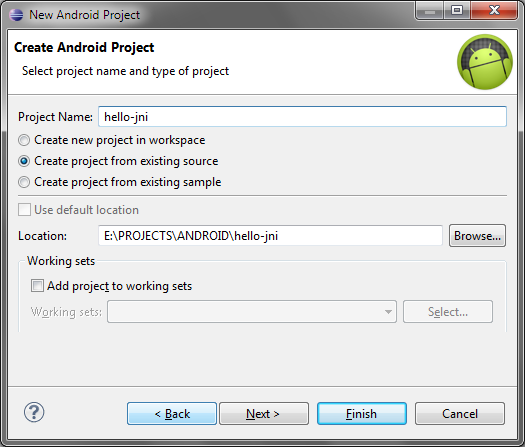
- Select “create project from existing source”. Specify the project name (hello-jni) and the location where you have copied the hello-jni sample (e.g. e:\projects\android\hello-jni):
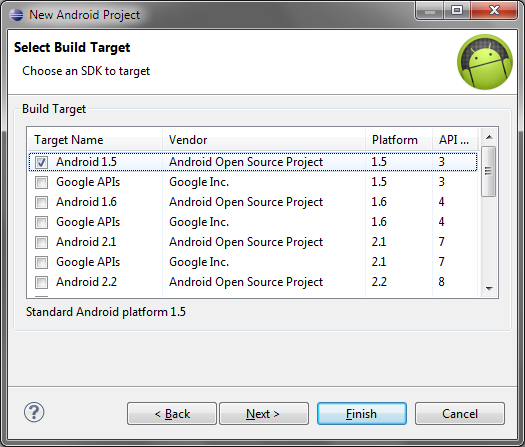
- In the next step select the “Android 1.5” platform:
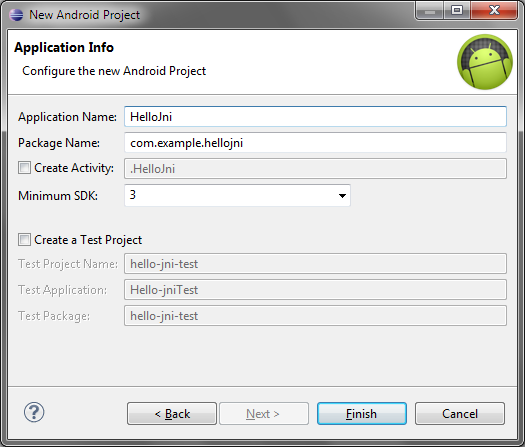
- Ensure that the application name and the package name match the names specified in AndroidManifest.xml:
- Press Finish to import the project to Eclipse.
- From now on you can build and debug the Java part of the example. Now let’s setup the C/C++ part.
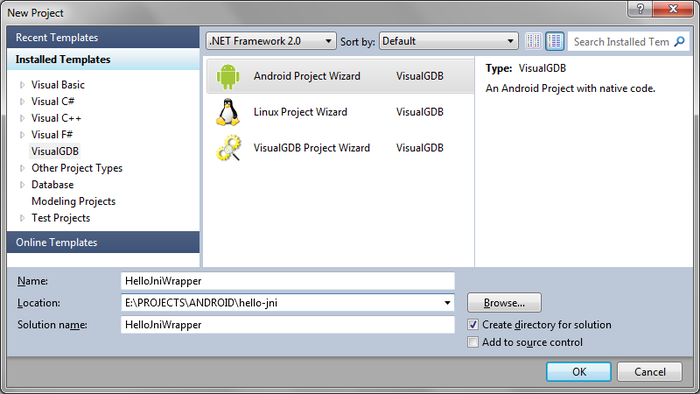
- Open Visual Studio, select File->New->Project. Select Visual VisualGDB->Android Project Wizard. Enter an arbitrary location for the Visual Studio project. The project folder won’t contain any source files. Instead it will link to the hello-jni source code you have copied in the first step. In this example we create the HelloJniWrapper subdirectory in the project directory.
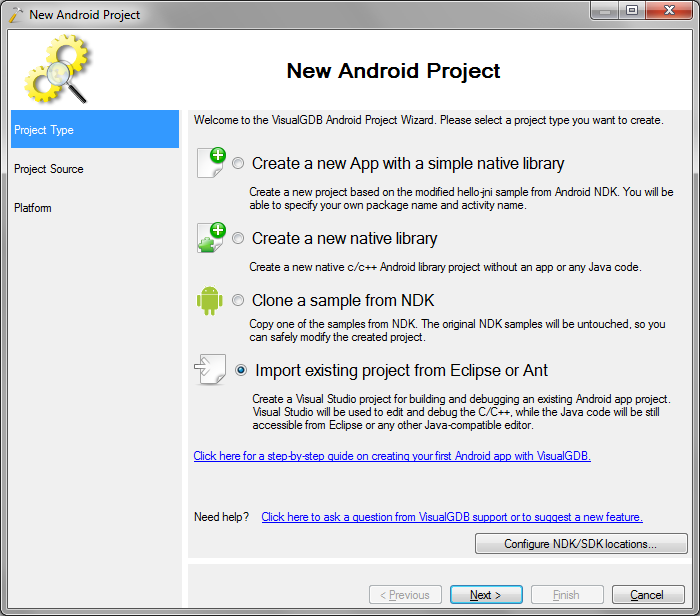
- In VisualGDB wizard select “Import existing project“:
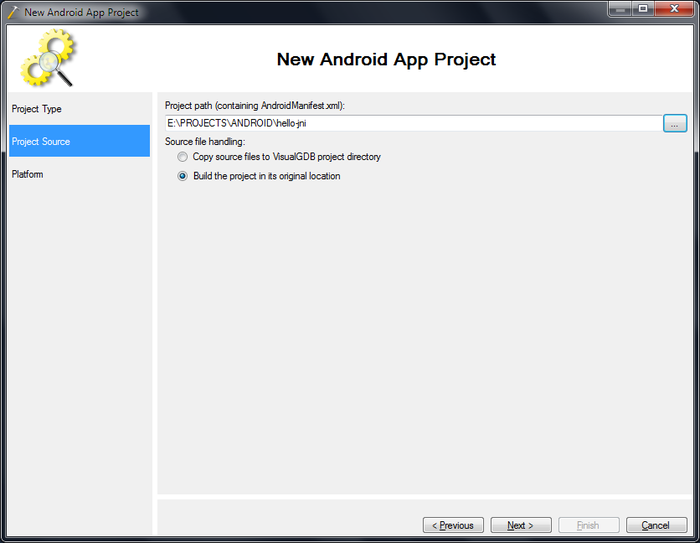
- In the next step specify the location where you have copied the hello-jni code (step 1). It should be the same location you used when creating the Eclipse project. Ensure that the “build the project in its original location” is selected.
- On the next step select the same target platform you specified when creating Eclipse project.
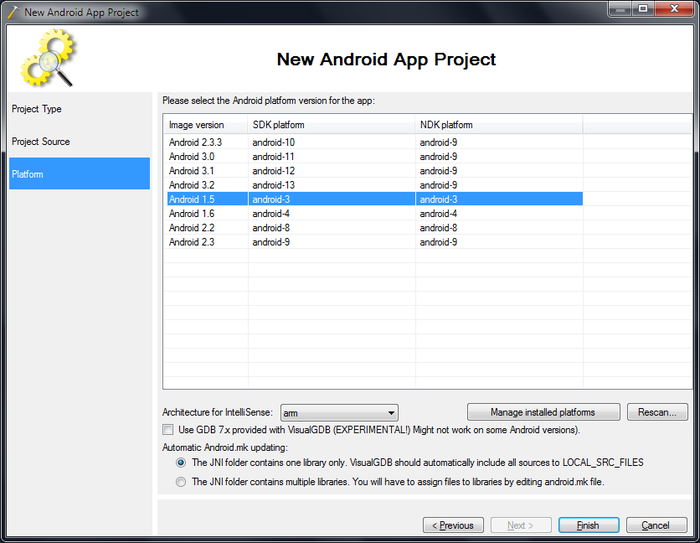
- Press Finish to create the Visual Studio project.
- Build the C part of the project by selecting Build->Build solution in Visual Studio.
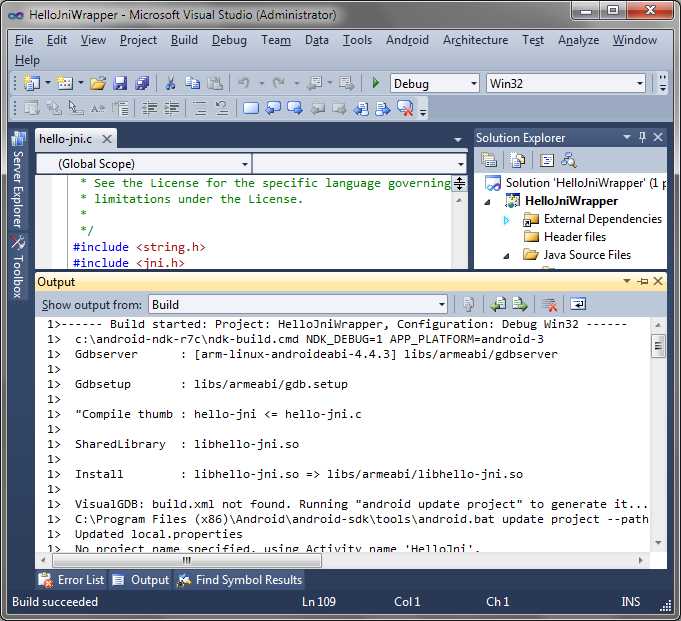
- VisualGDB will also build the Java code using Ant, however, you can ignore it when using Eclipse.
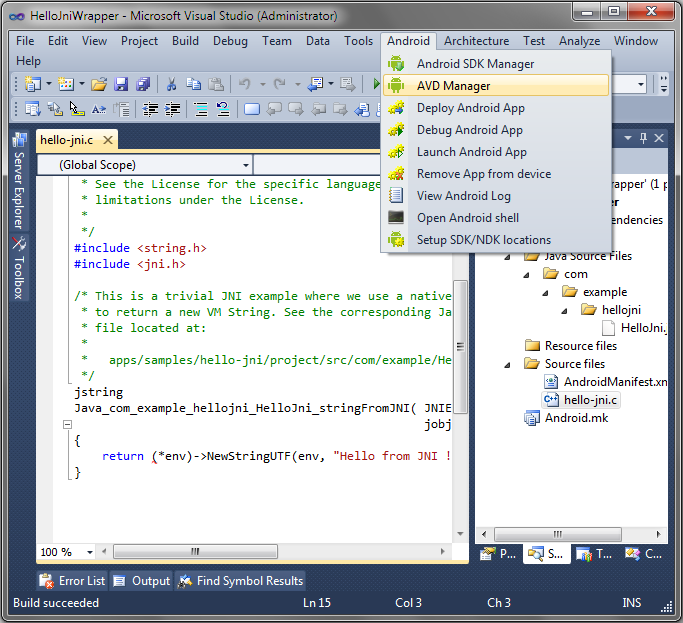
- Start the AVD manager (Android simulator):
- Create a virtual Android device. It is recommended to use Android 2.3.3 or later. Start the newly created virtual device and wait till it starts up.
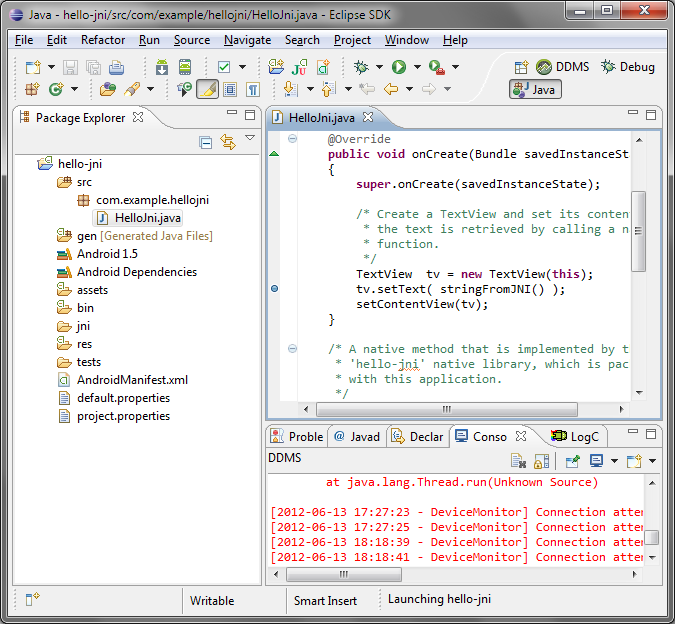
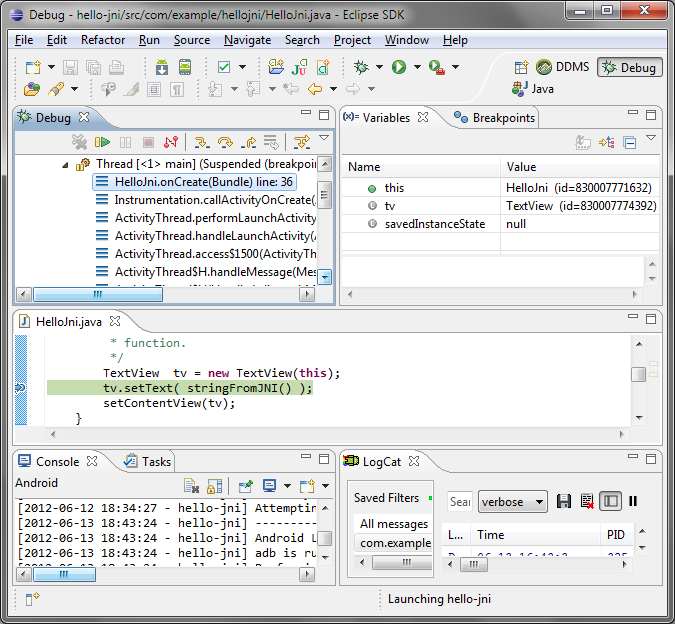
- Go to Eclipse. Open HelloJni.java and set a breakpoint on the line containing the stringFromJNI() call.
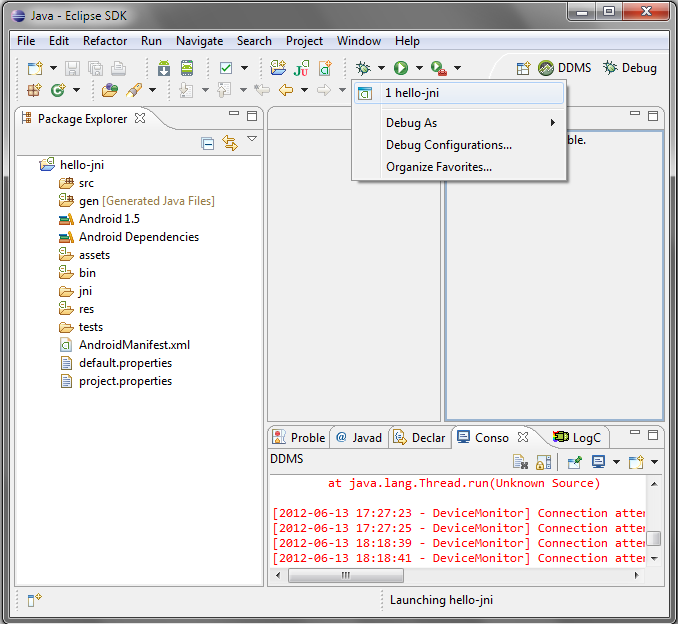
- Start debugging by clicking at the arrow to the right from the bug icon and selecting “hello-jni”:
- If everything goes well, the app will be installed to the simulator and your breakpoint will be trigerred.
 If anything goes wrong here, try restarting the debugging, rebuilding the app and restarting Eclipse.
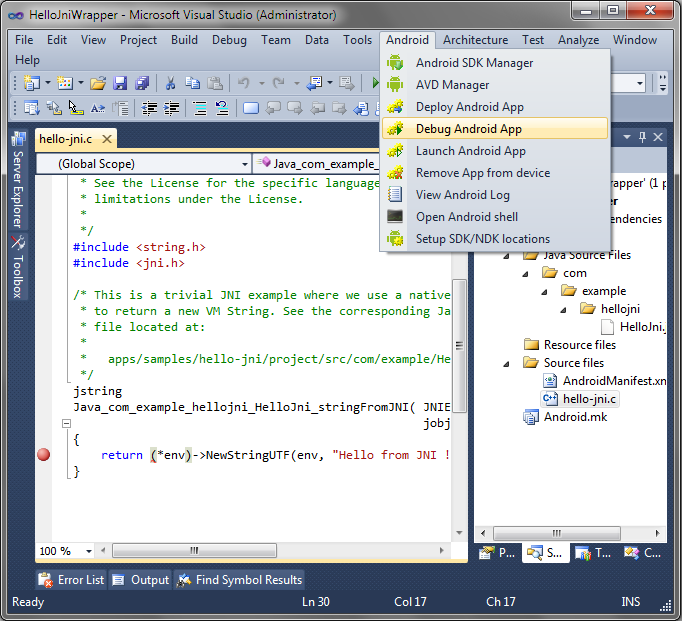
 - Now it’s the time to connect a native (C/C++) debugger. Go to Visual Studio, set a breakpoint on the line creating the string and select Android->Debug Android App.
- VisualGDB will notice that the app is already running (as it’s being debugged by Eclipse) and will show a prompt:
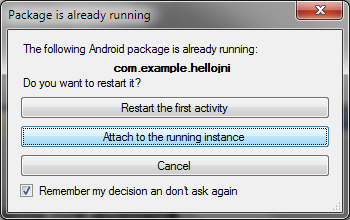
- As we want to co-debug the code with Eclipse, please select “Attach to the running instance“. You can also set the “Remember my decision” flag.
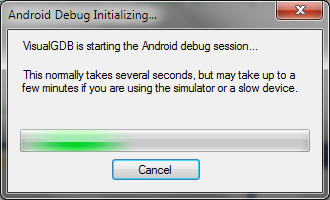
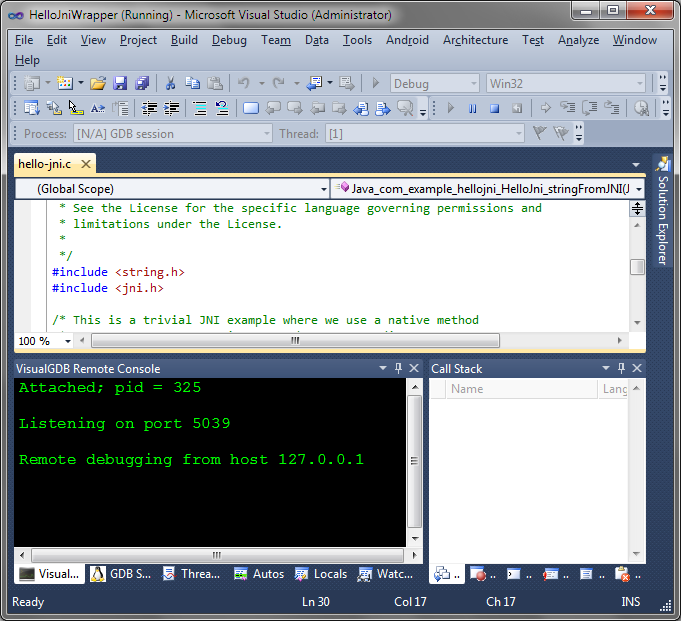
- If you are using the simulator, it might take some time for C/C++ debugger to attach. VisualGDB will show a progress window:
- Once the debugger is attached, your Visual Studio window will look similar to this:
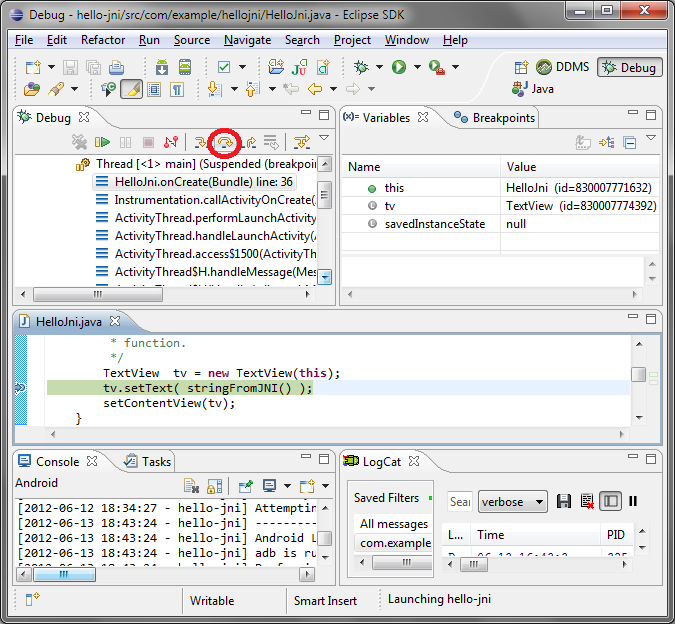
- Go back to Eclipse and select “Step over” so that the stringFromJNI() function gets executed.
- The Visual Studio breakpoint will be triggered:
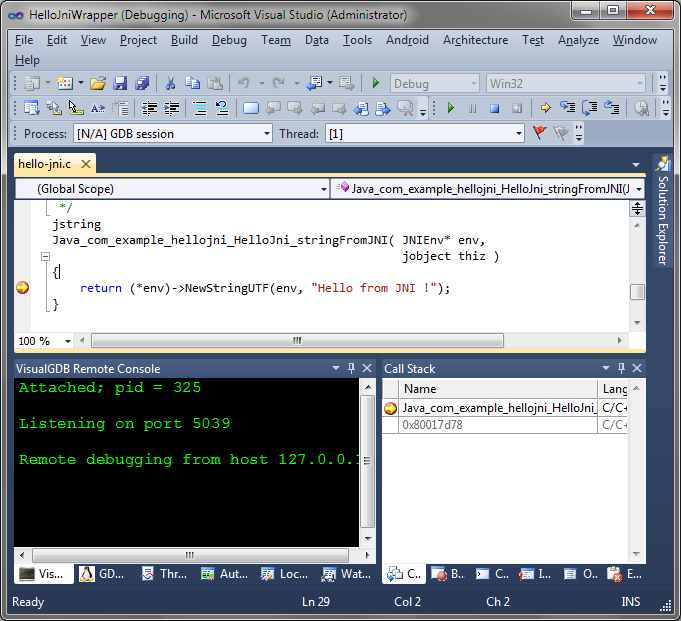
- You can use the Visual Studio debugger to explore local variable values (e.g. hover the mouse over thiz). When done, just press F5 to continue.
- Eclipse will complete the Step Over command and stop:
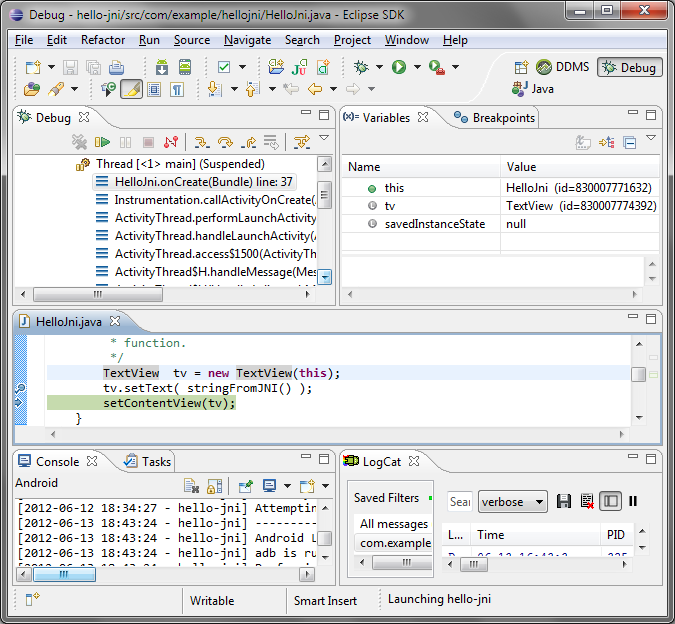
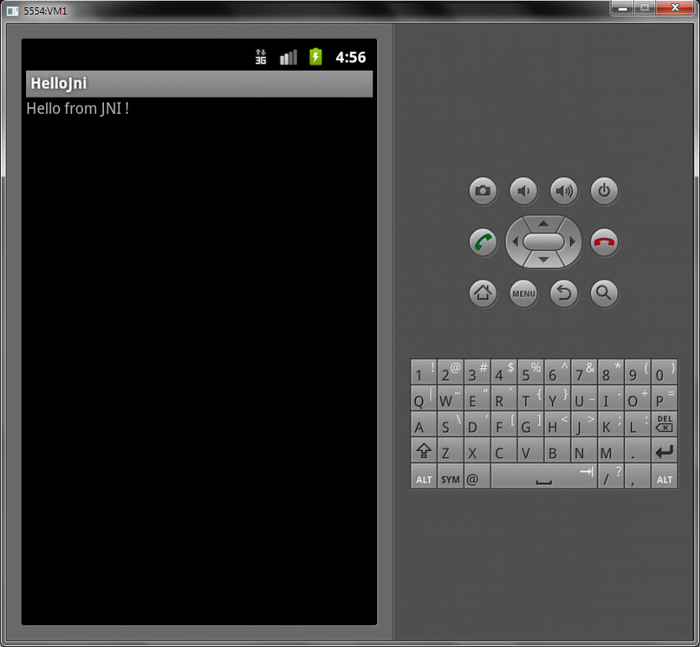
- Press Resume in Eclipse to continue program execution. You can switch to the simulator window and ensure that the string is displayed correctly:
- To stop debugging, disconnect the Eclipse debugging session and then terminate the Visual Studio session by pressing Shift+F5.


