Choosing a Debug Method
VisualGDB supports debugging embedded hardware through integration with third-party GDB stubs. Most popular devices can be configured by just selecting the debug method and the device settings in VisualGDB project wizard and project properties.
ARM devices
For ARM devices VisualGDB supports the following debug methods:
- Segger J-Link
- OpenOCD
- LPC-Link
For out-of-the-box debugging experience we recommend using Segger J-Link devices with the Segger debug method.
If you are using a different JTAG/SWD programmer, use OpenOCD as it provides the most functionality.
If you are using ST-Link and your device is not supported by OpenOCD or does not work with it, try the Texane ST-Link tool, however it supports fewer features than OpenOCD.
Segger J-Link
J-Link is a very high-quality hardware JTAG/USB probe that comes with its own debug stack (replacing OpenOCD). It usually works out-of-the-box in many corner cases where OpenOCD doesn’t, and requires minimal manual setup. The only thing to configure when using Segger J-Link is the location of your J-Link software package: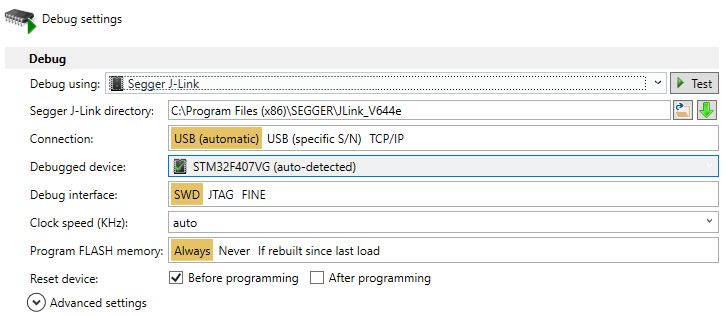
Make sure you download and install the latest J-Link software from the Segger website, as it is often updated to include support for new devices.
OpenOCD
If you are not using J-Link or LPC-Link, VisualGDB will use OpenOCD to interface with your debug probe. OpenOCD is an open-source debugging tool with a large community that supports most popular devices and USB programmers. VisualGDB provides easy configuration templates for most of them, so all you need to do is connect your JTAG/SWD programmer and select it in the “USB Devices” view: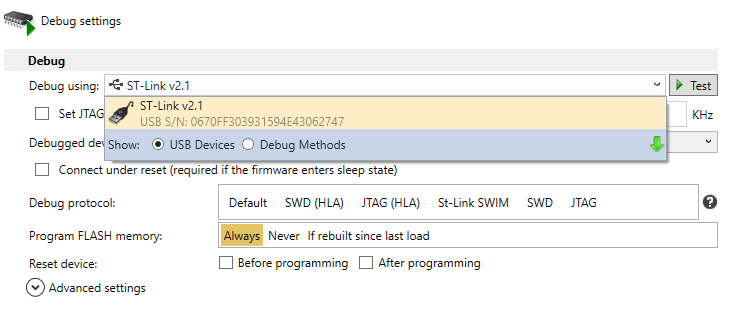 If your device is not listed, OpenOCD may still support it through one of 500+ scripts shipped with it. Simply select “Debug Methods” and search for a script for your device:
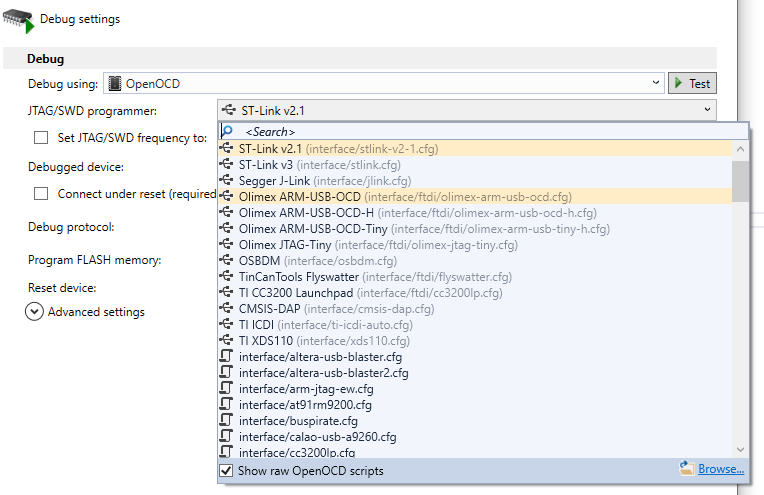
If you are using a very rare device, the OpenOCD community may still have a user-contributed script for it available online. Please search online for an OpenOCD script for your device or contact our support if you need help integrating the script with VisualGDB.
Warning: Although OpenOCD works out-of-the-box for many common scenarios, it is an open-source software and sometimes doesn’t work correctly. If you encounter cases where OpenOCD doesn’t work as intended, please consider building it from source to troubleshoot the issue, or simply switching to Segger J-Link that is usually more reliable.
LPC-Link/REDLink
As long as you have the Eclipse-based MCUXpresso IDE installed, VisualGDB can automatically import debug setups from it. Simply select “MCUXpresso RedLink” as the debug method and specify the location of your MCUXpresso IDE: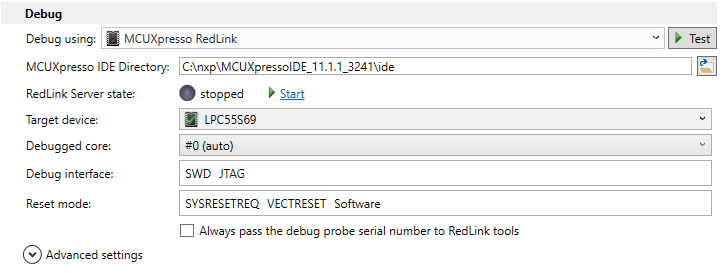 This setup will run the same underlying tools as the MCUXpresso IDE, so any device supported by MCUXpresso will also be debuggable with VisualGDB.
MSP430 Devices
The recommended debug method for MSP430 devices is the gdbproxy++. This is an open-source tool maintained by Sysprogs that allows debugging devices supported by the MSP430 debugging DLL: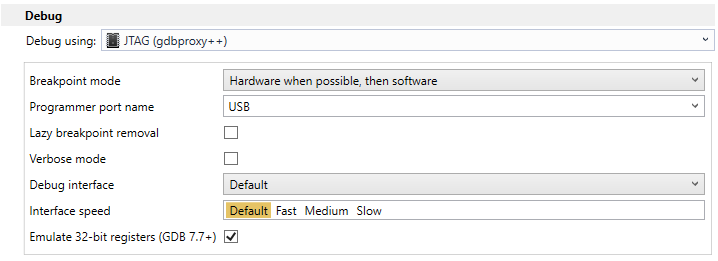 Note: the core debugging functionality is implemented in the msp430.dll file provided by TI. If your device does not work with msp430-gdbproxy++, please replace the msp430.dll file with a newer version from TI.
ESP8266/ESP32 Devices
The ESP8266/ESP32 devices can be debugged using special versions of OpenOCD. VisualGDB can automatically install these versions of OpenOCD when configuring ESP32 or ESP8266 projects, so the setup will be similar to the regular OpenOCD debugging.
RISC-V Devices
RISC-V devices require another special version of OpenOCD (Kendryte K210 uses its special one as well). VisualGDB will automatically install and configure a compatible OpenOCD build, depending on your project type.
AVR Devices
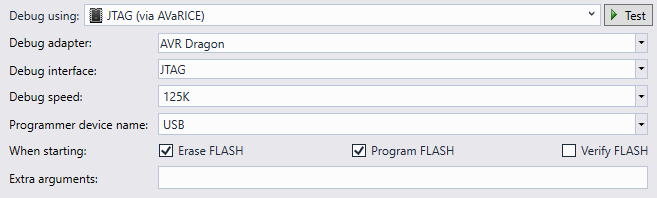
VisualGDB support debugging of AVR devices via the open-source AVaRICE tool. The following debug interfaces are supported:
- JTAG ICE mkI
- JTAG ICE mkII
- AVR Dragon
VisualGDB will automatically install AVaRICE when you create an AVR-based project and will let you configure its parameters using convenient GUI:
Other device families
If you are not using an ARM or msp430 device, then you need to download the GDB stub for your programmer. A GDB stub is a program provided by the programmer’s manufacturer that connects to the programmer and then accepts connections from GDB via a TCP port allowing it to communicate to your device. Once you download the GDB stub, select “Custom GDB stub” in VisualGDB debug settings: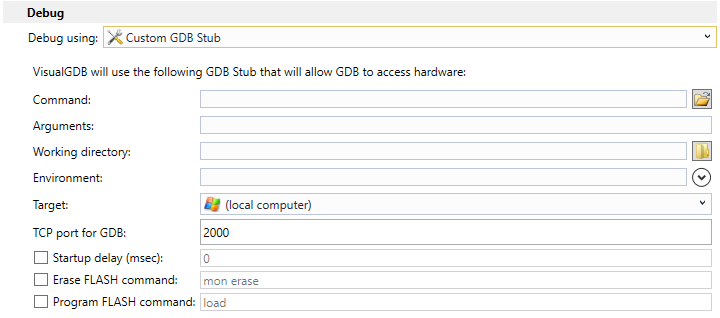
Then specify the following parameters from the GDB stub documentation:
- The path to the GDB stub program
- Any additional arguments (e.g. device name)
- TCP port where the stub will be listening for connections from GDB