Using Code Map to understand C++ Android code
This tutorial shows how to use the CodeMap feature of Visual Studio to understand the structure of complex C++ code. We will show it based on the san-angeles demo built using vs-android, however it will also work for all other VisualGDB project types.
- Install VisualGDB 5.0 or later (ensure that “Android Edition” is checked in the installer). This will add support for debugging and Clang-based IntelliSense to vs-android projects.
- Ensure you can build and debug the san-angeles project by following this tutorial.
- Open the san-angeles project and go to the drawModels function in demo.c:
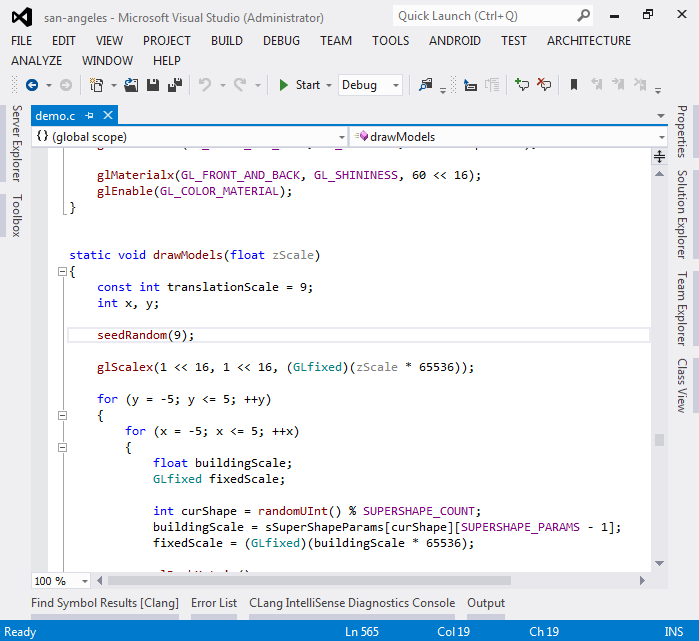
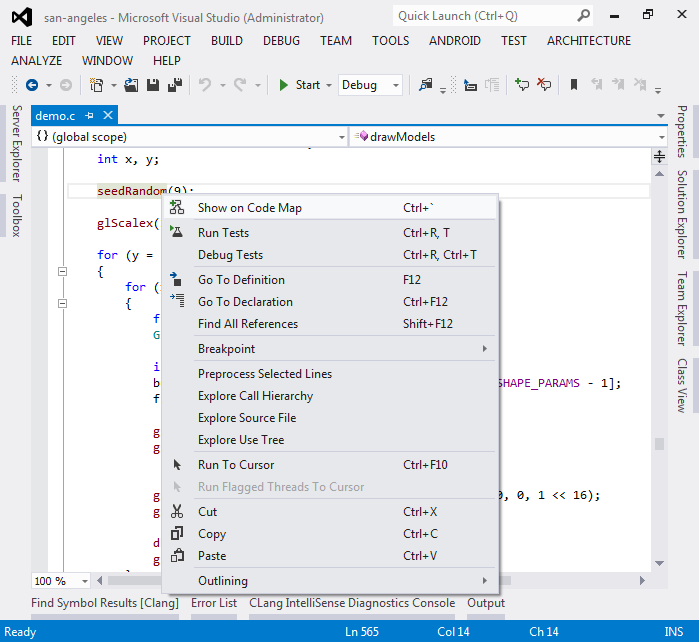
- The first thing we will investigate using code map is that drawModels() function that appears to be called repeatedly is calling seedRandom() each time with the same value. That supposedly resets the state of the random number generator. Let’s use the code map to understand what is affected by this. Right-click on seedRandom() and select “show on code map”:
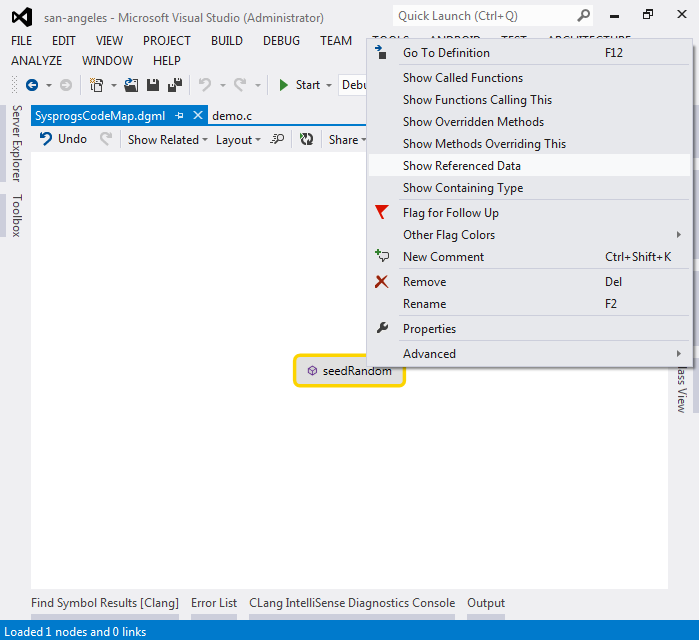
- A new Code Map window will appear. Right-click on seedRandom in that window and select “show referenced data”:
- You will see that seedRandom accesses the sRandomSeed variable. Right-click on it and select “Show functions referencing this”:
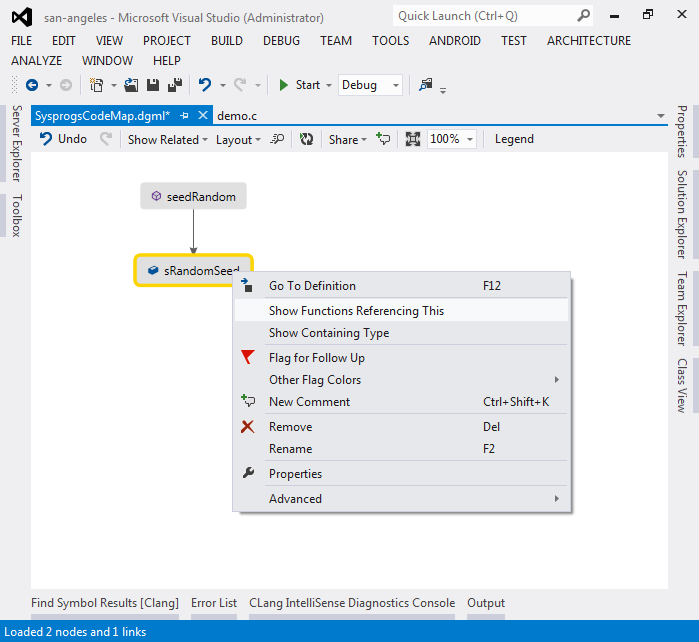
- Now you will see that sRandomSeed is also accessed by randomUInt():
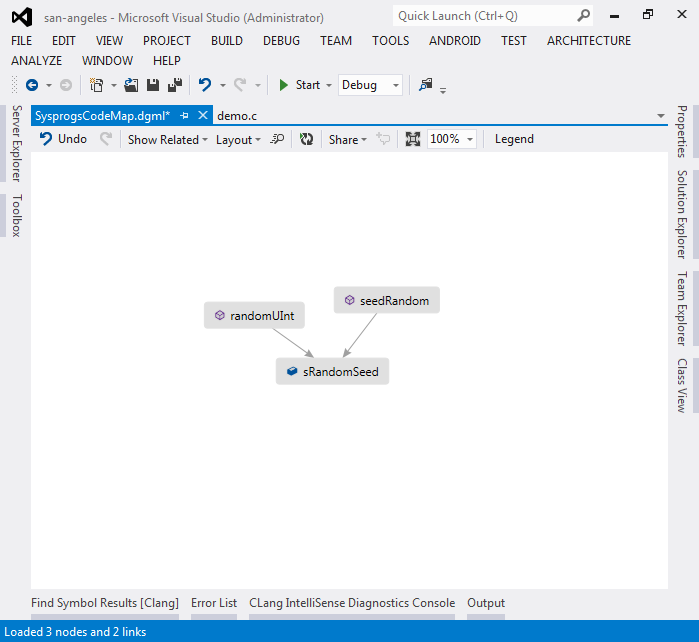
- Now we need to figure out the context in which both functions are called. Select both of them by holding the ctrl key, right-click and select “Show functions calling this”:
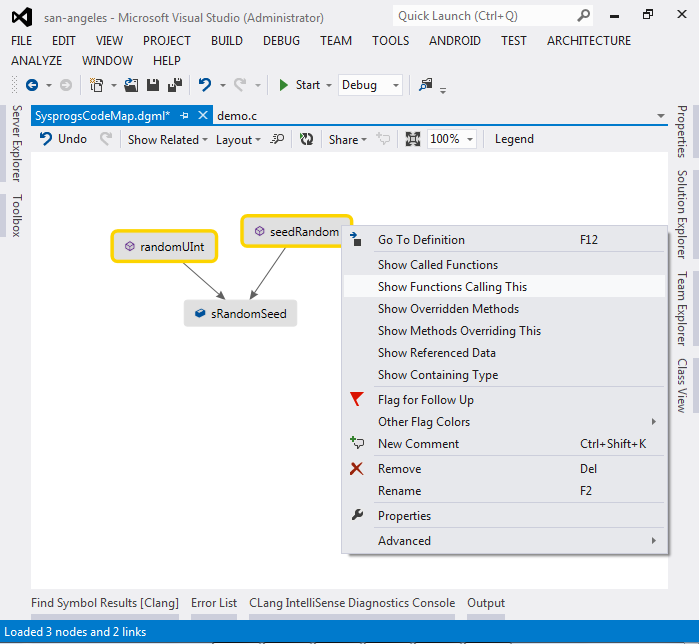
- Now you will see all functions in the project that call the two random number functions we found. However, this is not enough to see the big picture:
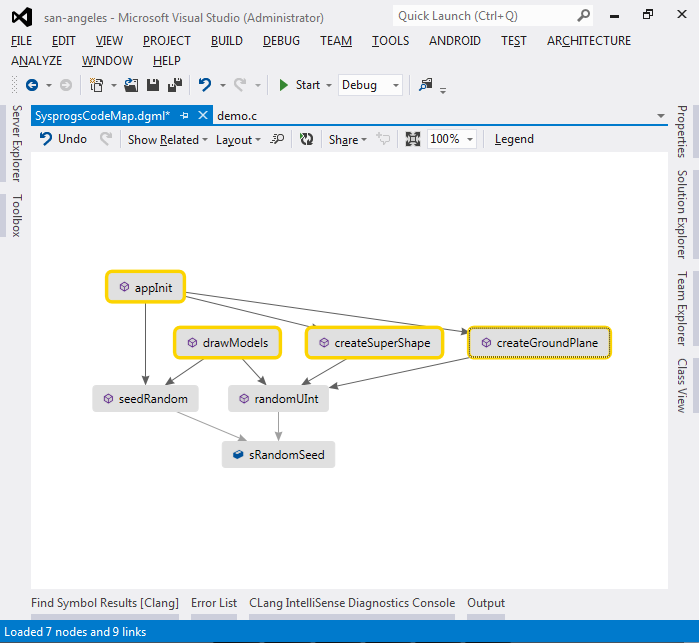
- Repeat the previous step (selecting newly found functions) twice more until you see the functions called by the Java framework (starting with Java_):
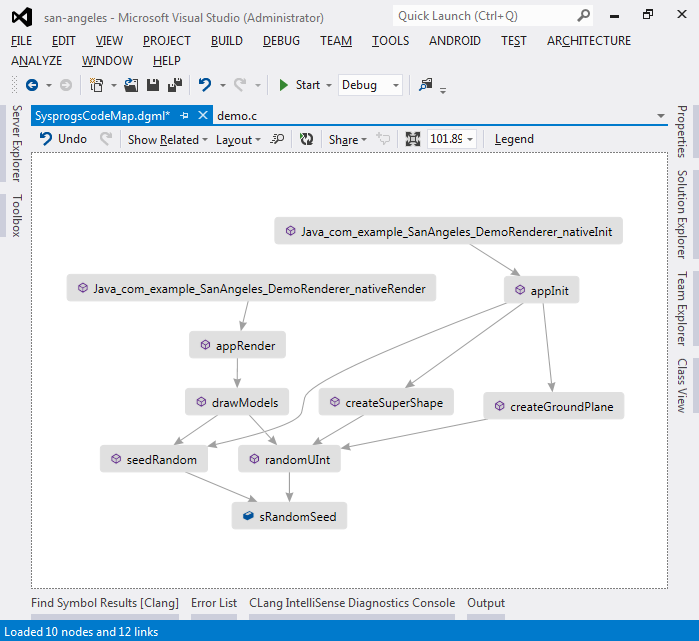 Now the big picture is clear: the random functions are mainly involved during app initialization and the only other place that calls them is the drawModels() function itself. Hence, resetting the random seed inside drawModels() does not affect the behavior of other functions.
 - Now let’s use Code Map to quickly find functions related to the GLObject struct. First of all, select any of the GLObject’s fields and select “Show on Code Map”:
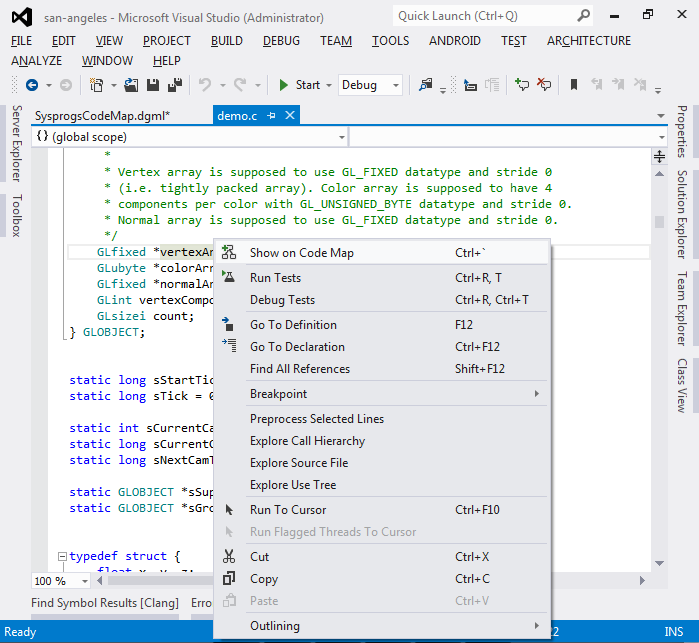
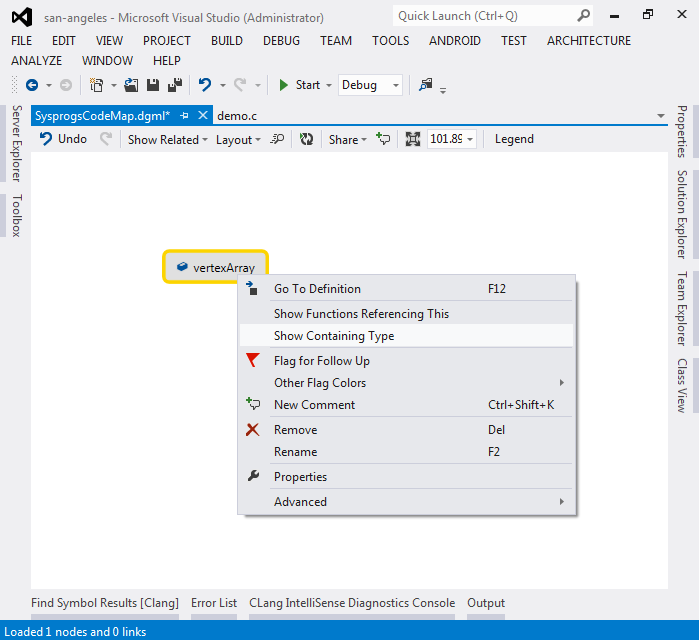
- Then right-click on it and select “Show containing type”:
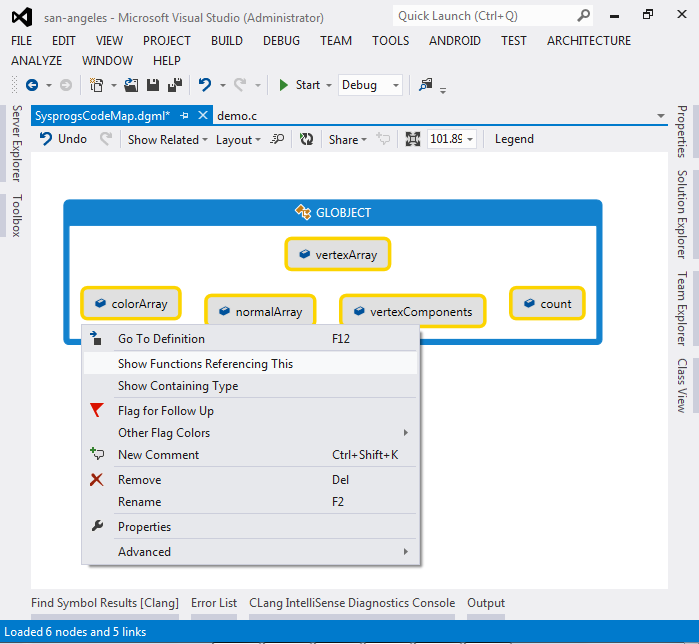
- Right-click on the type, select “Show type contents”, then select all fields, right-click select “Show functions referencing this”:
- You will now see all functions that directly reference fields of GLObject:
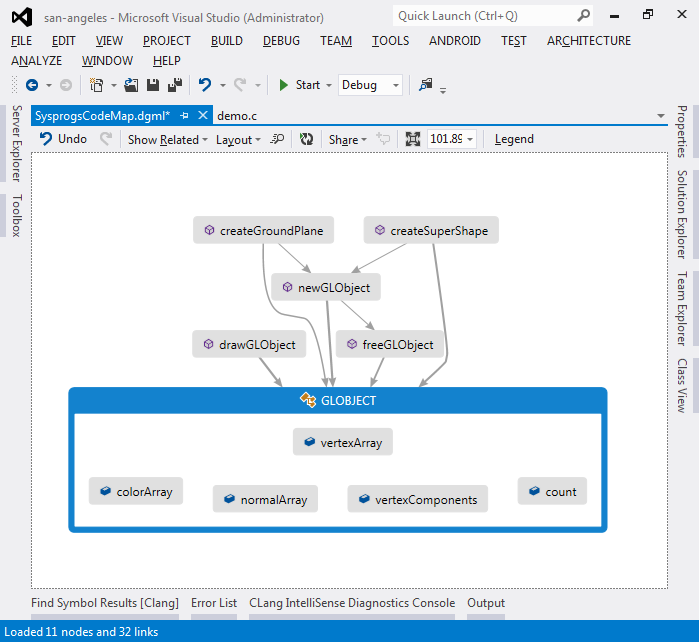
- By highlighting all objects and repeatedly selecting “Show functions calling this” you can easily see the big picture:
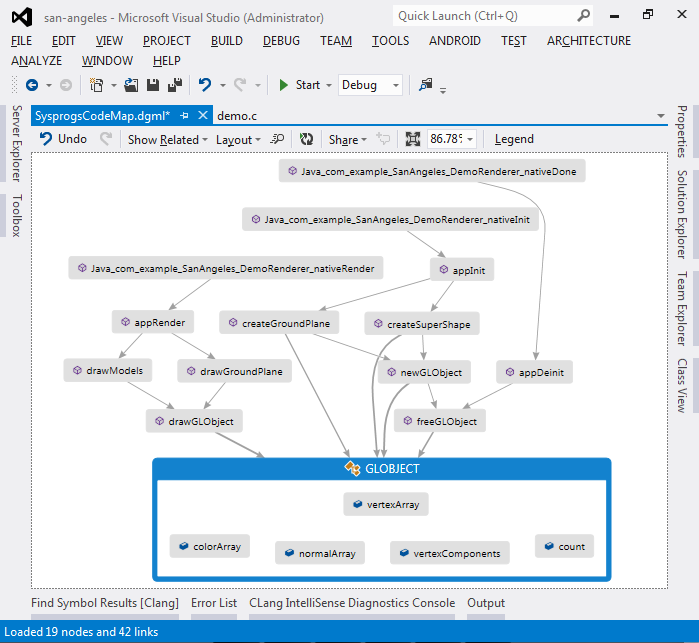 The Code Map now clearly shows how the objects are created during initialization, used during the render calls and destroyed during the de-initialization. You can double-click on any of the functions or fields to quickly jump to the code and examine the function contents.
