STM32 debugging with ST-Link, OpenOCD & VisualGDB
This tutorial shows how to debug your embedded STM32 projects using ST-Link hardware debugger, OpenOCD and Visual Studio with VisualGDB.
Before proceeding with the tutorial please ensure that VisualGDB 4.0 or later is installed.
-
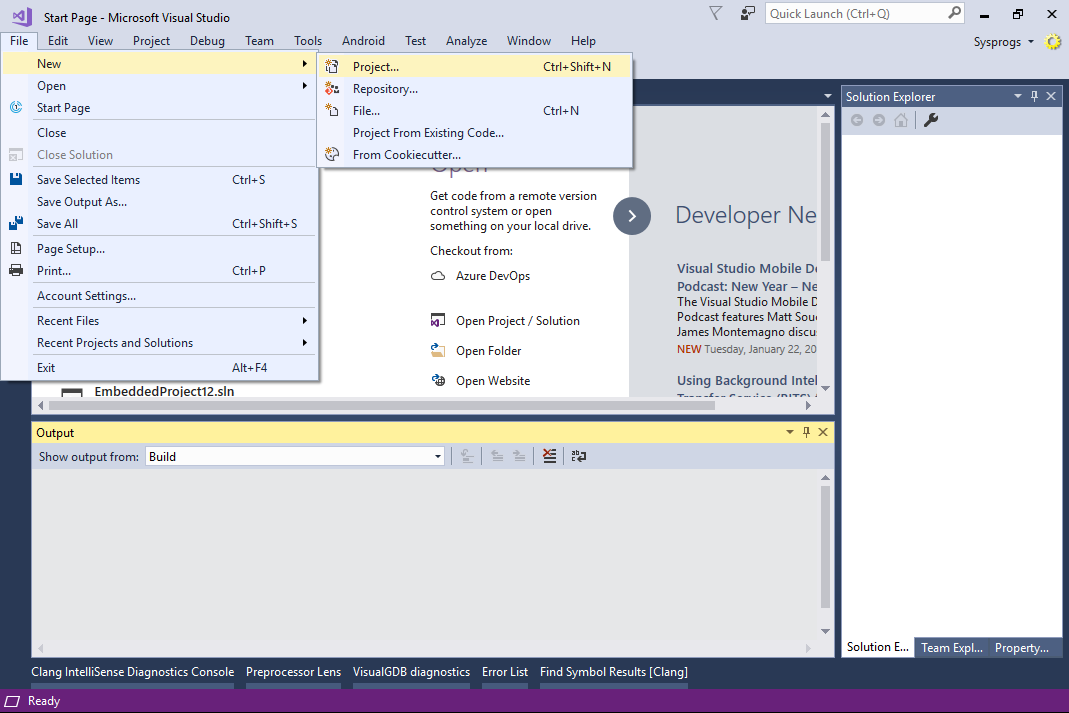
- Start Visual Studio. Create a new project by selecting File->New->Project:
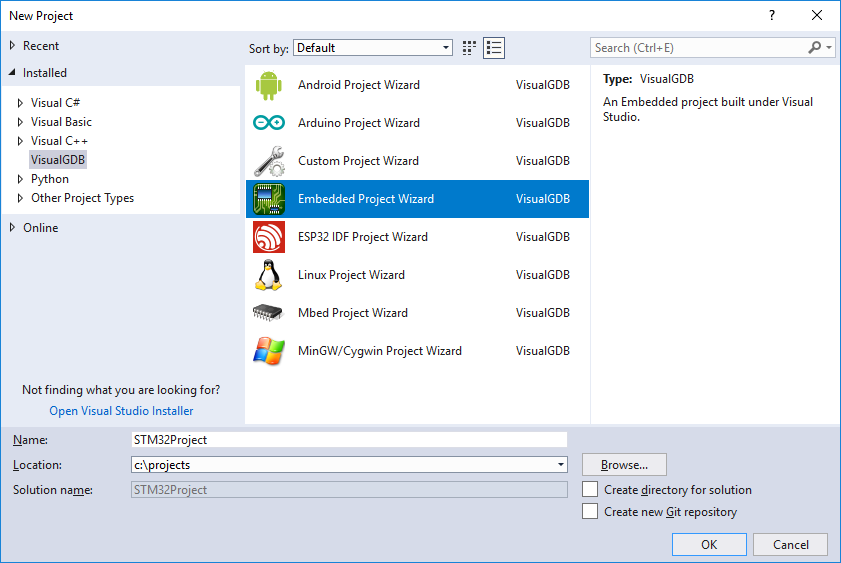
- Select VisualGDB -> Embedded Project Wizard. Specify project directory and enter project name:
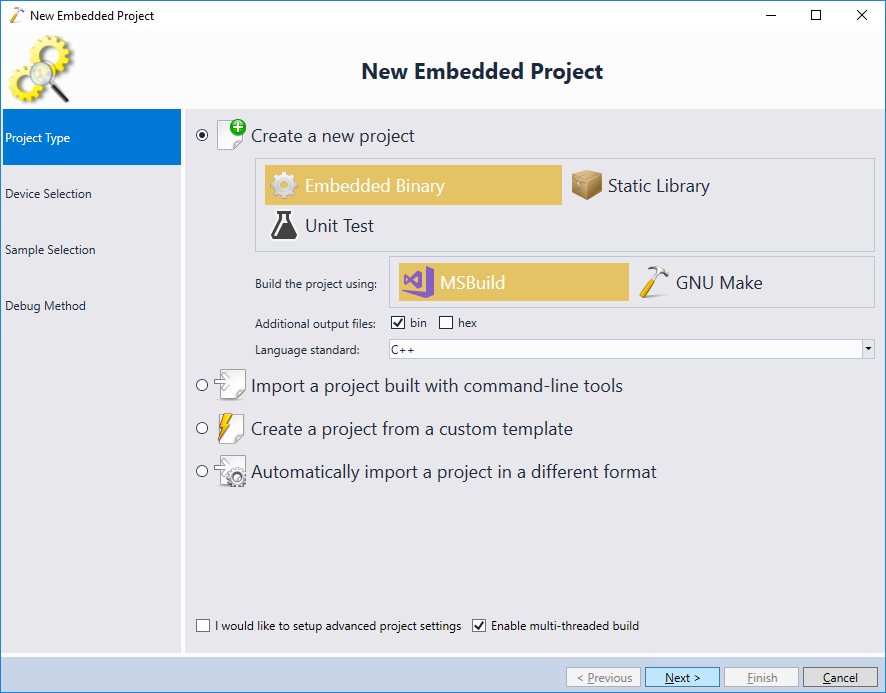
- Select “Create New Project” on the first wizard page:
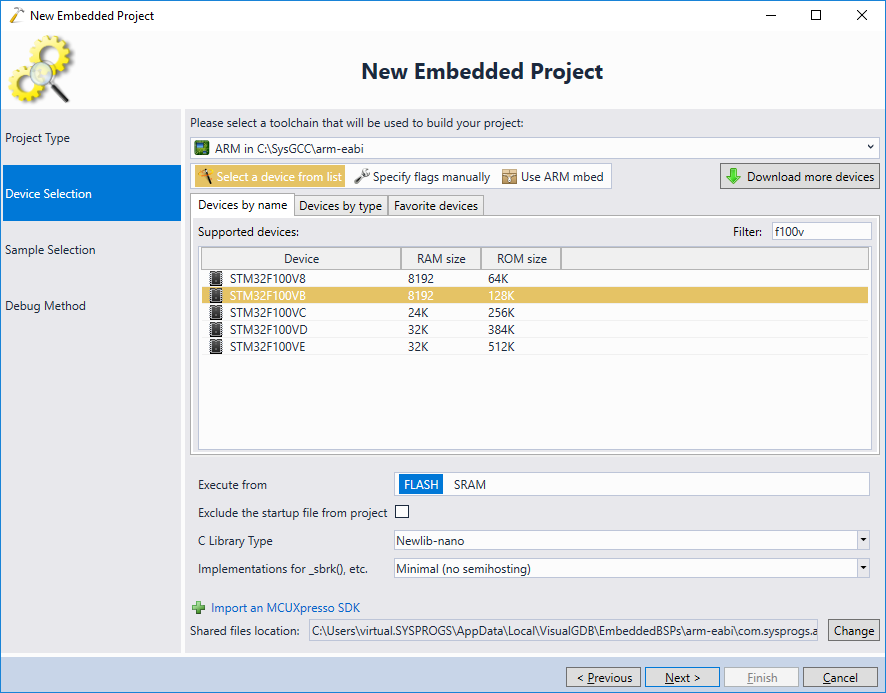
- On the toolchain selection page select “arm-eabi”. If you don’t have the arm-eabi toolchain installed, VisualGDB will install it automatically. Then select your device from the list:
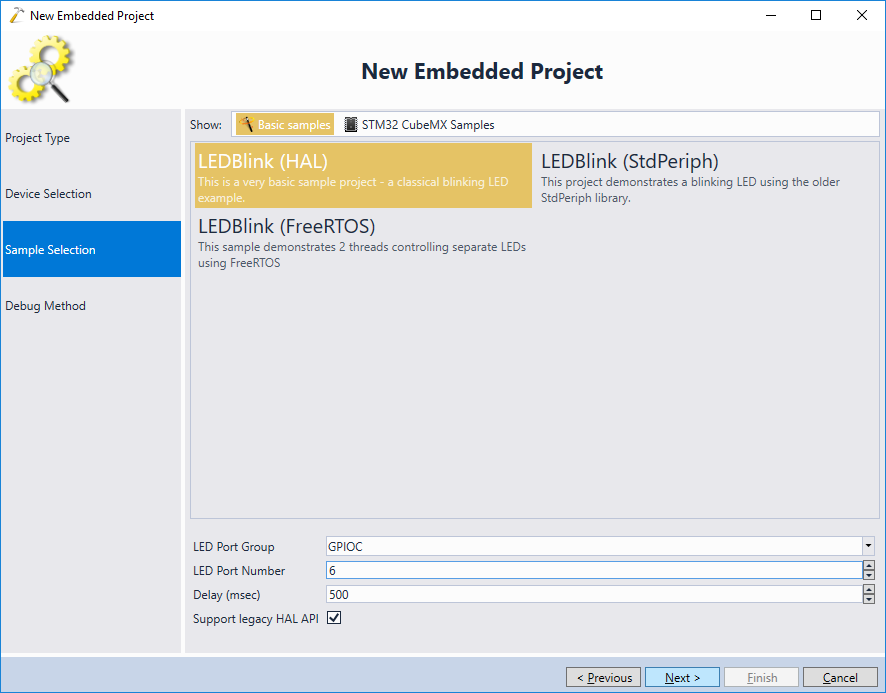
- On the next page confirm the “Blinking LED” sample by pressing “next”:
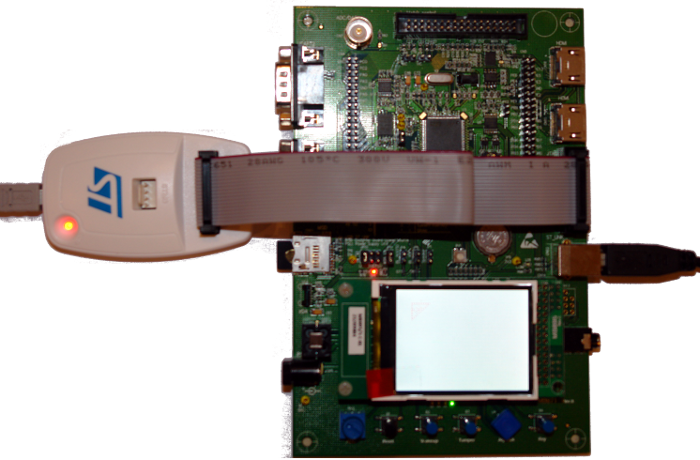
- Connect your ST-Link to the USB port and let VisualGDB detect it:
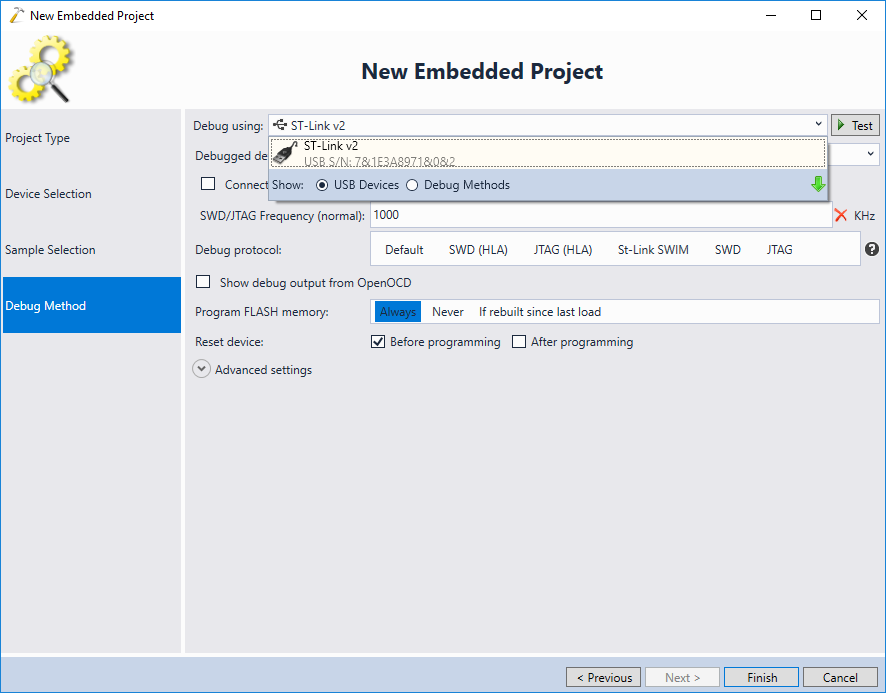
- VisualGDB will automatically download the latest OpenOCD package and will let you configure most common settings using convenient GUI:
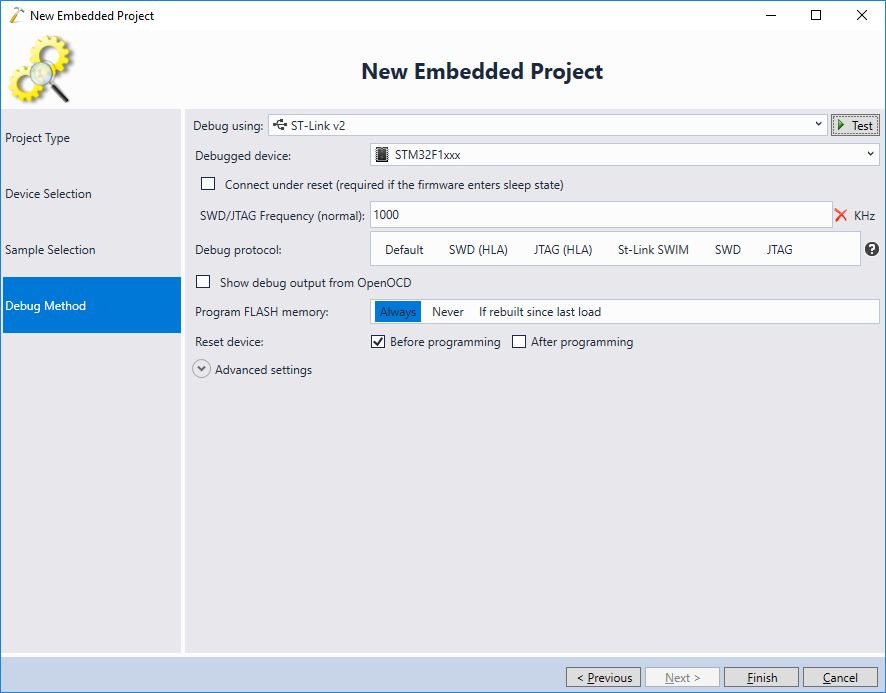
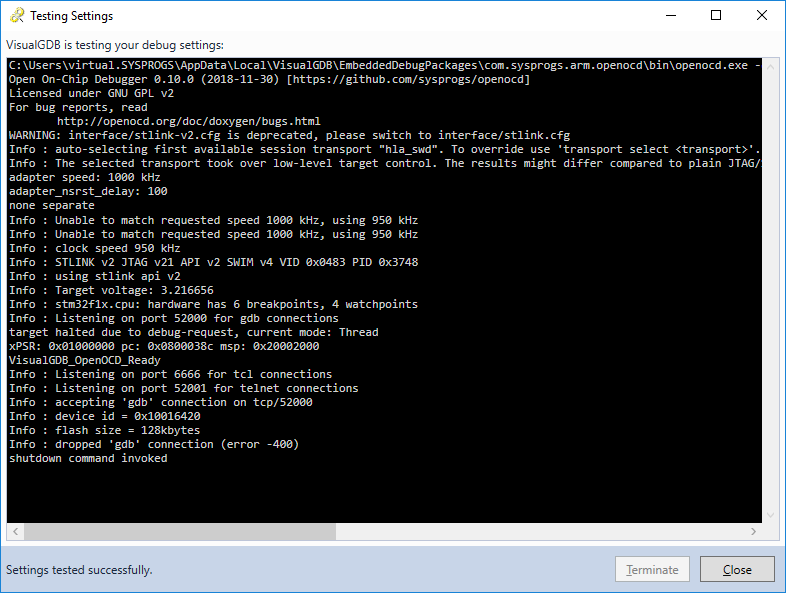
- Press “Test selected OpenOCD settings” in the VisualGDB project wizard to verify your settings:
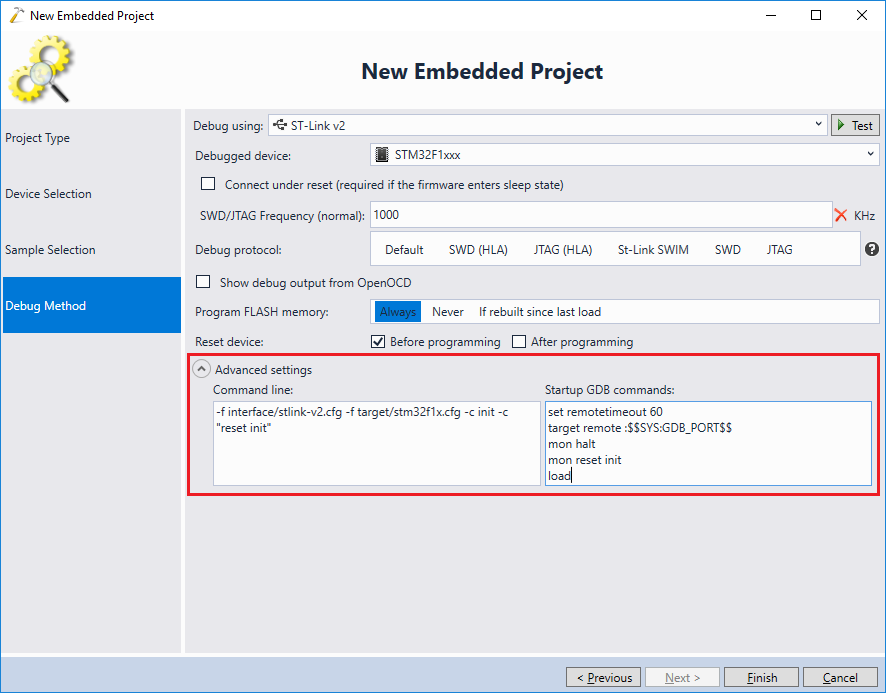
- If you are familiar with OpenOCD internals and would like to tweak the startup commands or the command line, use the Advanced Settings view to edit them directly:
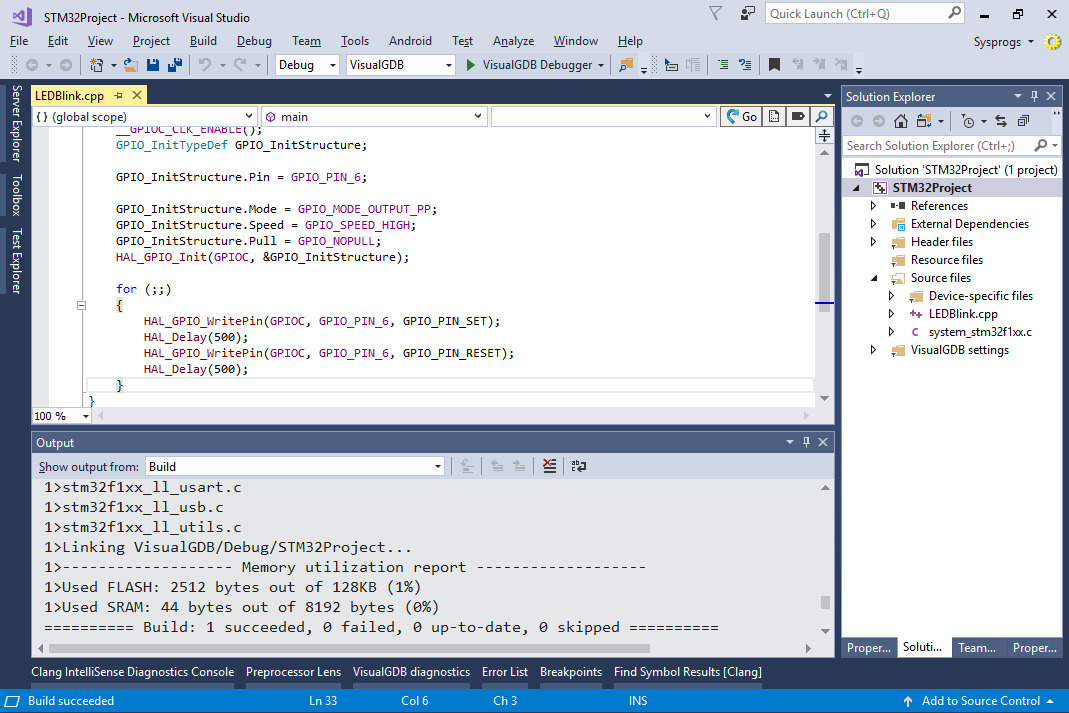
- Press “finish” to close the wizard. VisualGDB will generate a Visual Studio project. Press Ctrl-Shift-B to build it:
- Put a breakpoint on a line that turns on a LED and press F5 to start debugging. Once the breakpoint is hit, press F10 to step over a line:
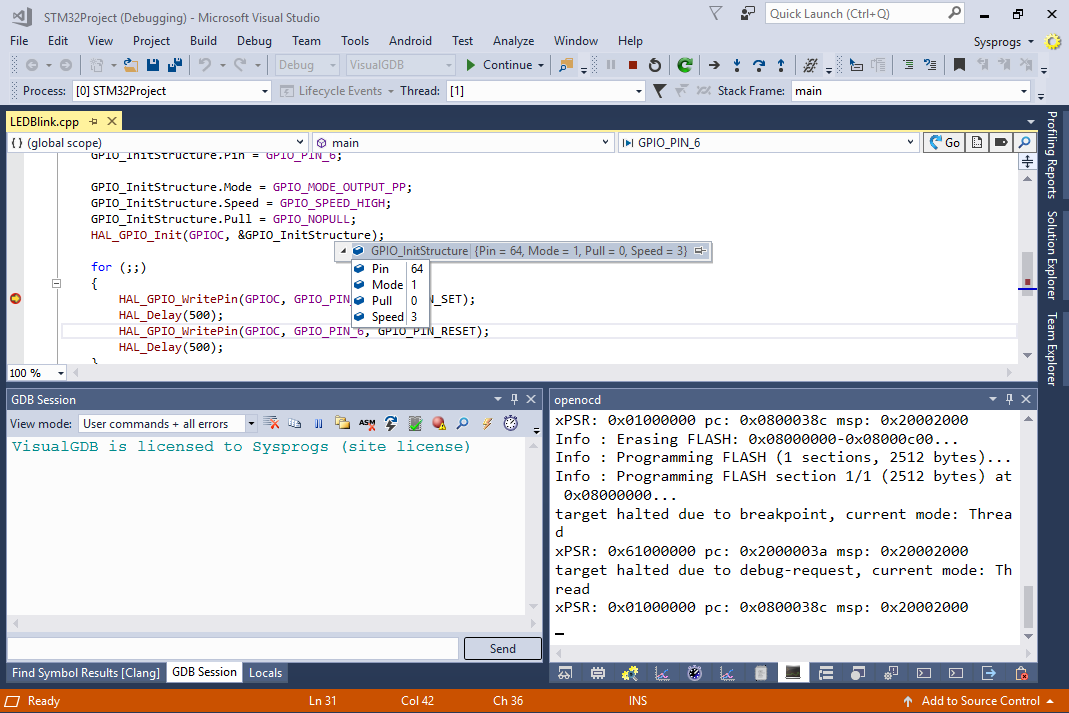
- Note how the LED on the board turns on and off as you step over the corresponding lines:
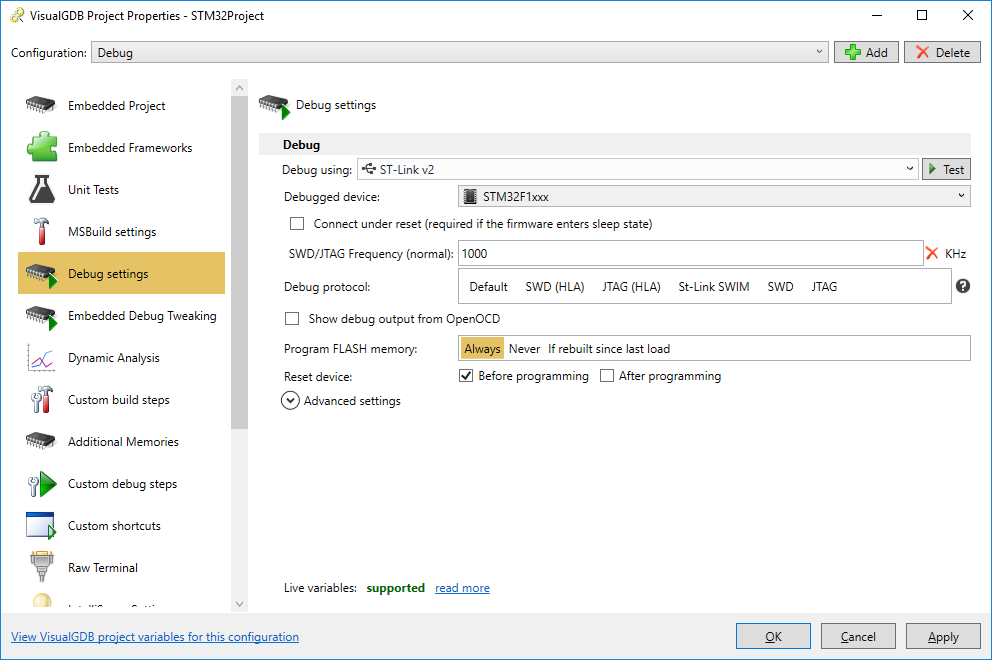
- When you are done debugging, you can modify various project properties by right-clicking in the project node in Solution Explorer and selecting “VisualGDB Project Properties”.
- VisualGDB will automatically index your sources (and the STM32 package sources) and will let you navigate through them using CodeJumps. Simply click the CodeJumps labels near the function declarations to view references, call trees, functions “implementing” specific function pointers and so on:

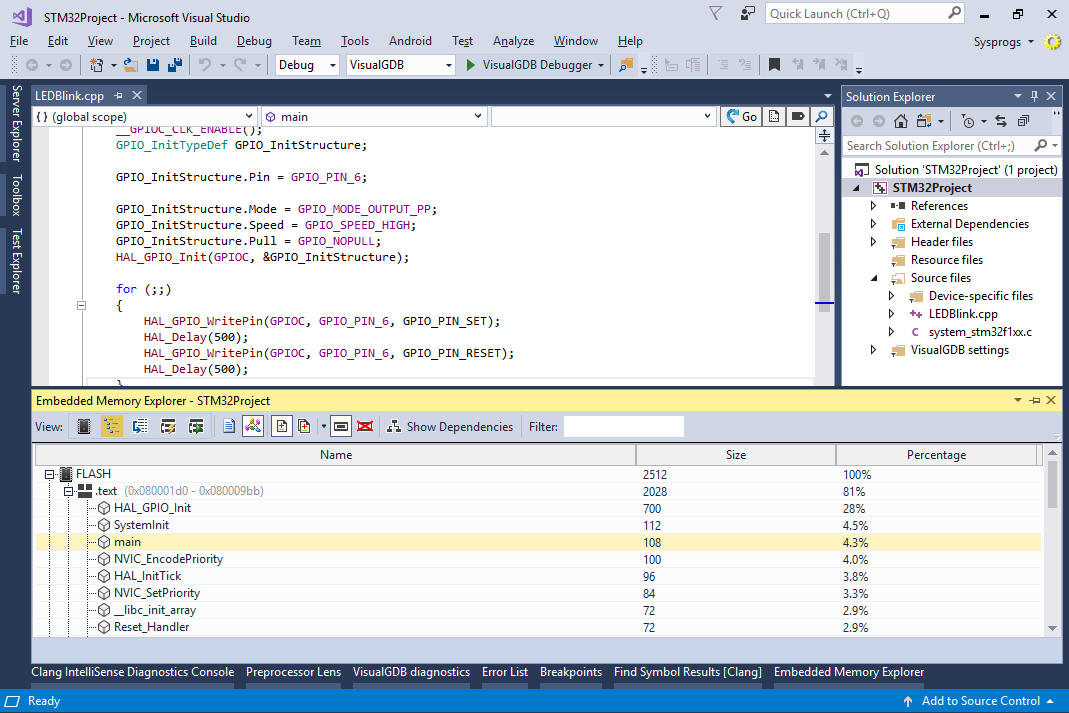
- Use the View->Embedded Memory Explorer to get a detailed report about the structure of your embedded binary, including the locations of sections in memory, sizes of individual functions, their disassembly view and worst-case stack analysis:
- Start Visual Studio. Create a new project by selecting File->New->Project:
