Configuring OpenOCD for JTAG debugging
This tutorial explains various OpenOCD settings and shows how to configure it to use your JTAG programmer and board.
Before you begin please follow this tutorial to setup a basic VisualGDB project with OpenOCD.
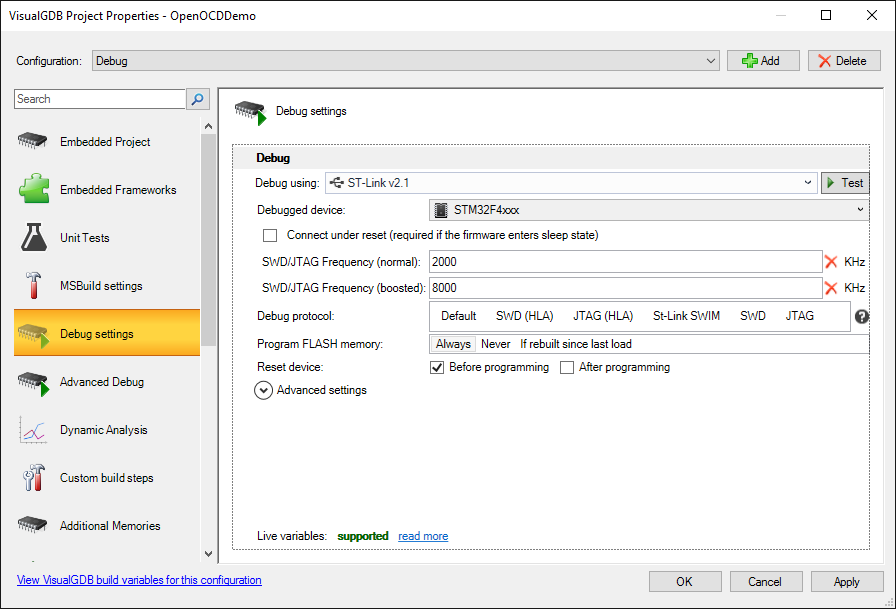
- Open your project, right-click on the project node in Solution Explorer select “VisualGDB Project Properties” and open the “Debug Settings” page:
- OpenOCD is configured by selecting device and interface configuration scripts (located under %LOCALAPPDATA%\VisualGDB\EmbeddedDebugPackages\com.sysprogs.arm.openocd\share\openocd\scripts) that contain the low-level device parameters. VisualGDB maintains a database of common device types and will automatically find the correct OpenOCD script for most of the common device types:
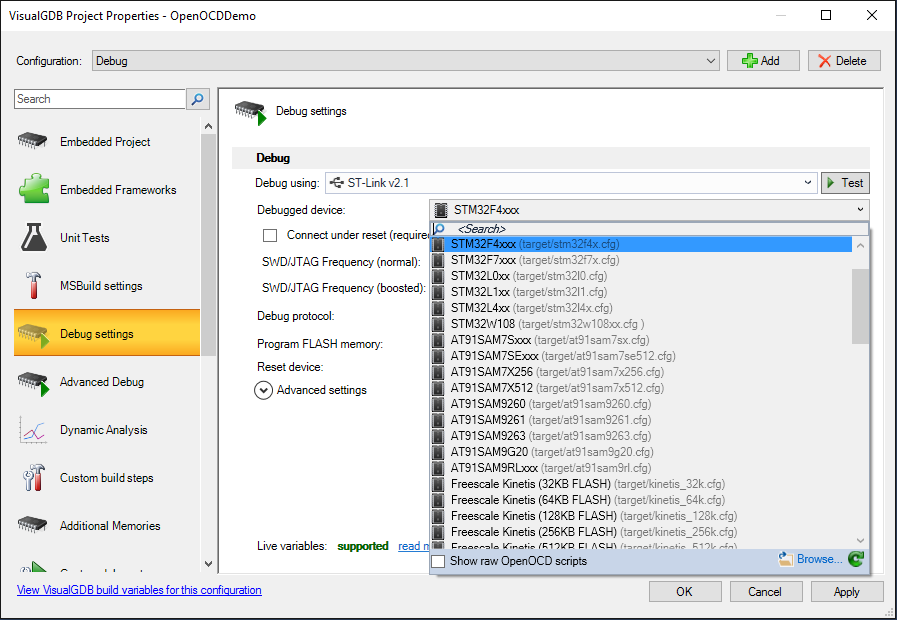
- If you are debugging a rare device that is not automatically recognized by VisualGDB, you can check the “Show raw OpenOCD scripts” checkbox and specify a script file manually:
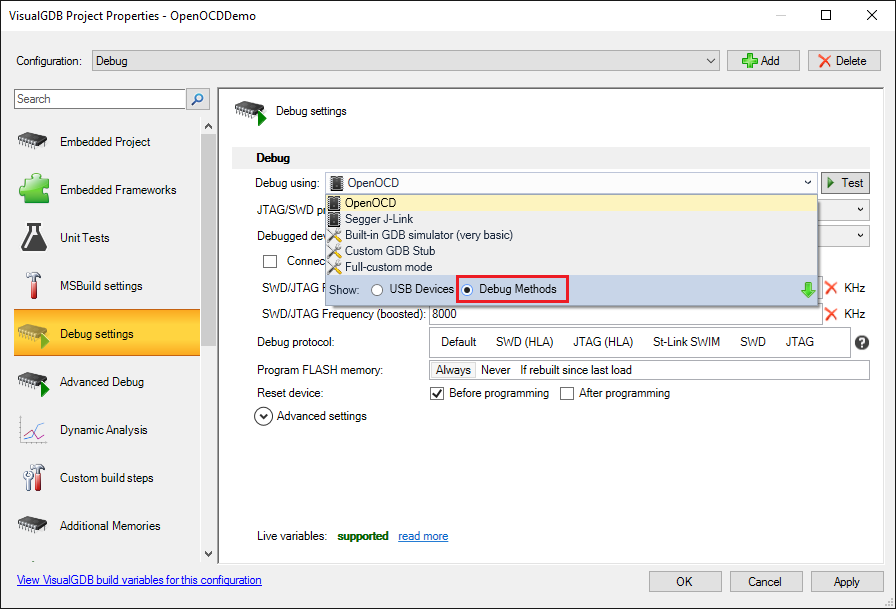
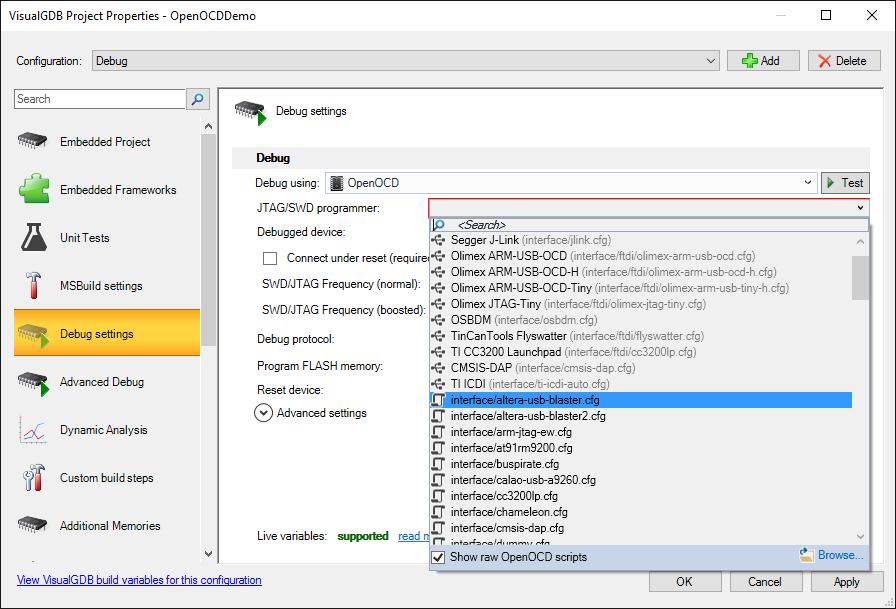
- If you are using one of the common debug adapters (e.g. ST-Link or Olimex FT2232-based adapters), VisualGDB will automatically recognize it once you plug it into the USB port, will install the necessary drivers and select the corresponding OpenOCD interface script. You can also configure the script manually by switching from Device View to Debug Method View:
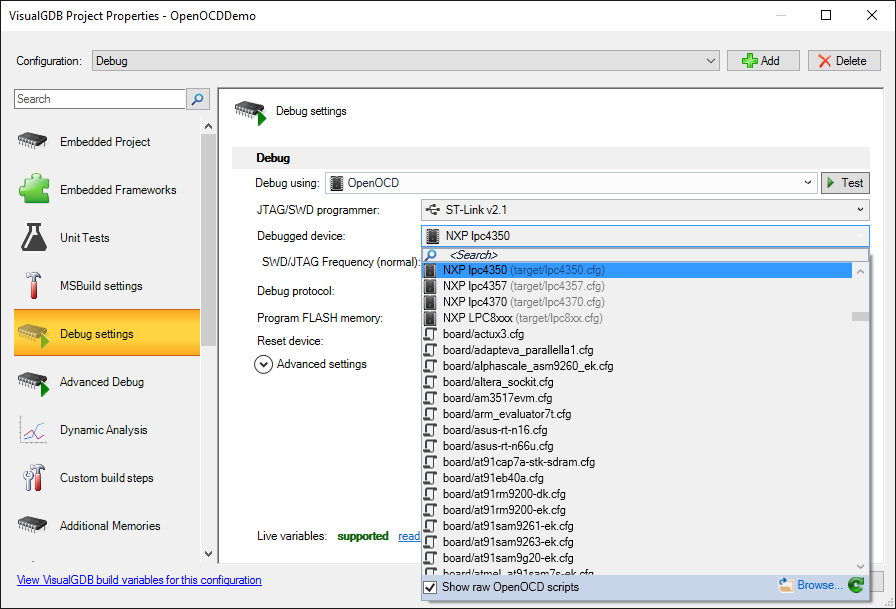
- Interface script selection works the same way as the device script selection letting you pick either a common debug interface, or a specific OpenOCD script:
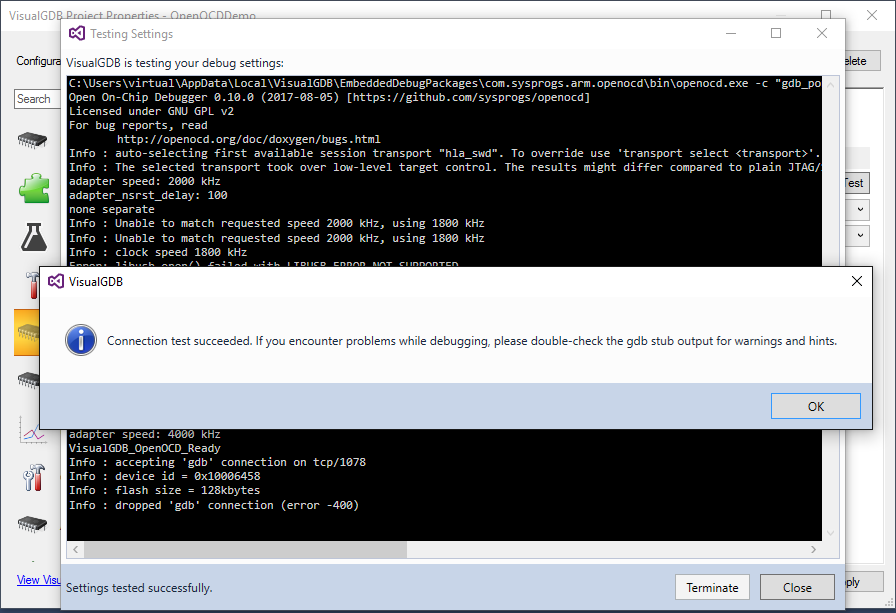
- If you are experimenting with OpenOCD settings, we recommend quickly testing them by pressing the “Test” button. VisualGDB will run OpenOCD without actually programming your project and will attempt connecting to it and querying the target registers:
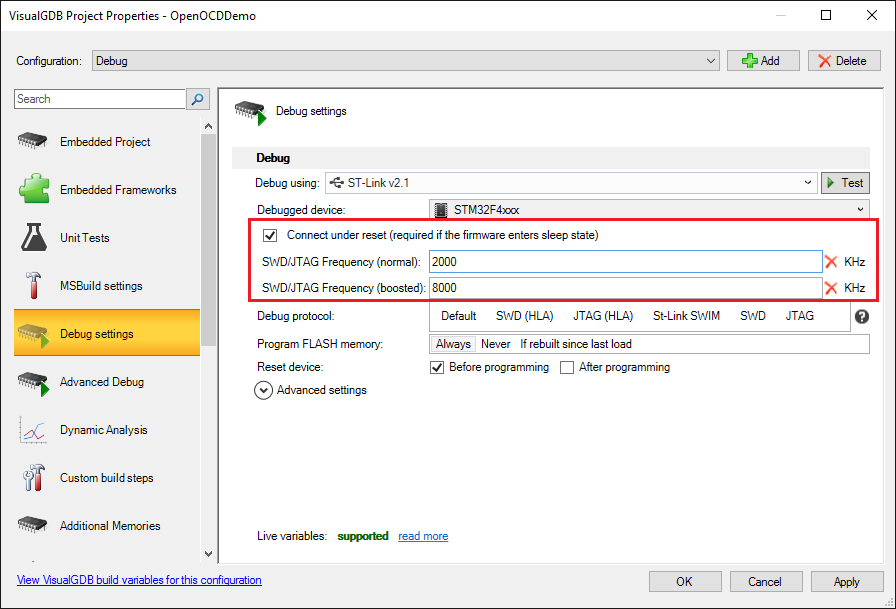
- VisualGDB can recognize common statements inside the OpenOCD scripts and let you edit them via GUI (a temporary copy of the script will be created when debugging). E.g. you can enable the “Connect under reset” mode or change the SWD/JTAG frequencies used before and after configuring the target clock:
- If you are familiar with OpenOCD commands, you can tweak the exact command line used by VisualGDB to launch OpenOCD by expanding the “Advanced settings” view:
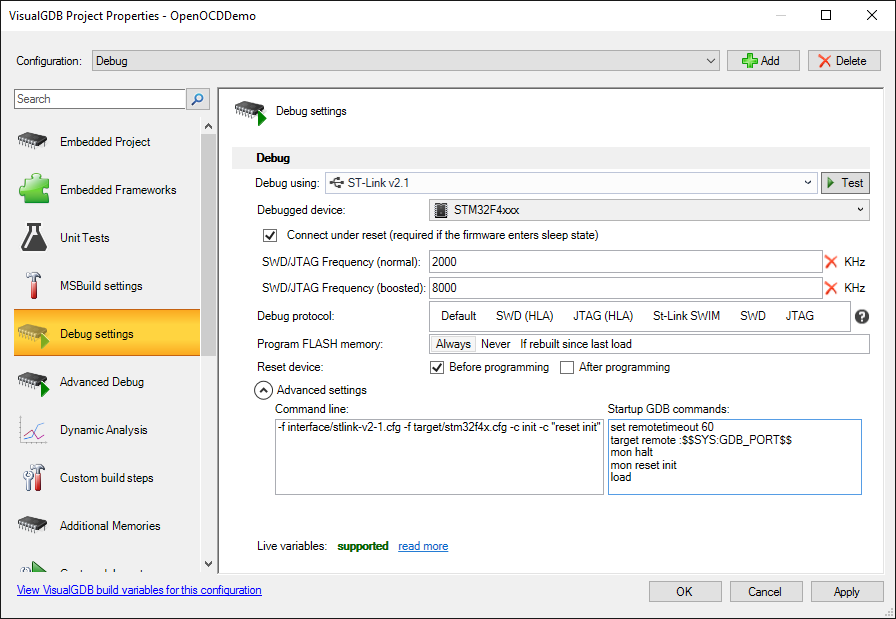 Any changes you make here will be preserved when you use the rest of the GUI. E.g. if you change the debugged device, VisualGDB will update the “-f target/…” command, but keep the rest of the commands before and after it unchanged.
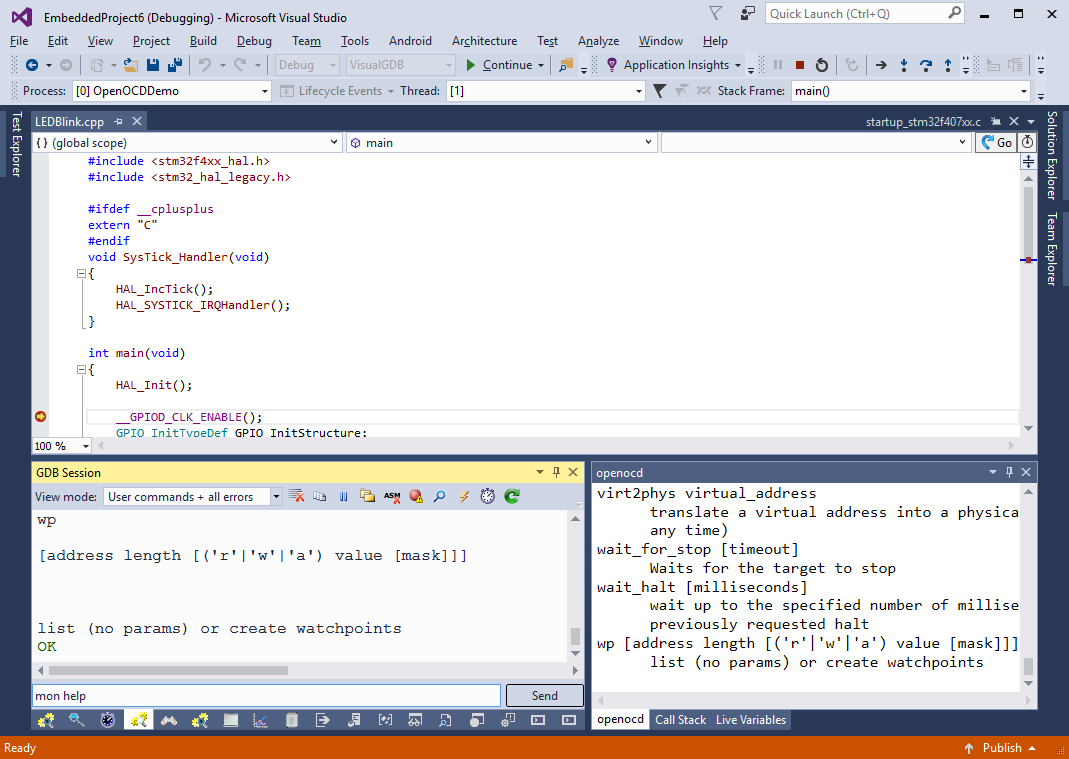
 - Once your debugging session is active you can execute various OpenOCD commands by typing “mon <command>” in the GDB Session window. E.g. type “mon help” to let OpenOCD print information about supported commands. Note that the information will be shown in both OpenOCD pane and the GDB Session pane:
- To learn more about OpenOCD please read the OpenOCD user manual.