Debugging ESP8266 firmware with the UART GDB Stub
This tutorial shows how to debug the ESP8266 firmware using the UART GDB stub provided by Espressif without any JTAG hardware.
Before you begin, connect the TXD and RXD signals on your ESP8266 board to a USB-to-UART circuit, however the RXD and TXD signals on the Olimex board have levels of 0 to 3.3V and connecting them to a normal UART signals without a level shifter could damage the ESP8266. On the Olimex ESP8266 module the RXD and TXD signals are available on pins 4 and 3 on the MOD-WIFI-ESP8266-DEV module and on pins 4 and 3 on the UEXT connector on the ESP8266-EVB board: 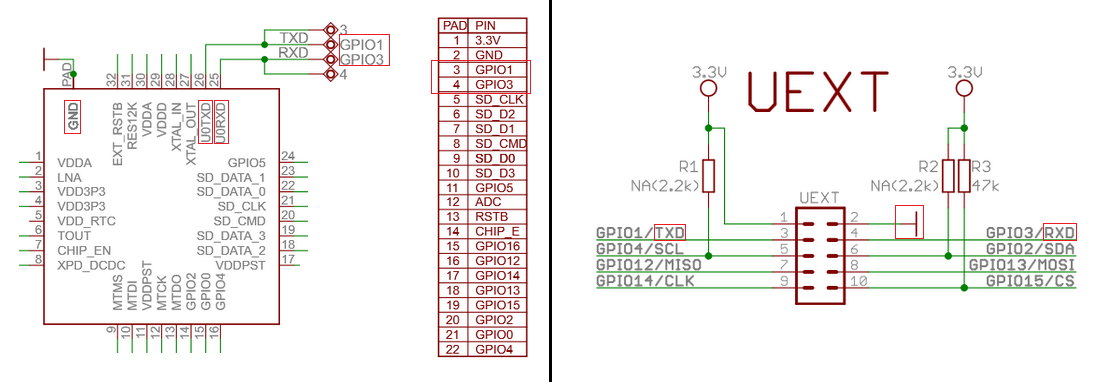 Once the connection is established, follow the steps below to build and debug a simple HTTP server:
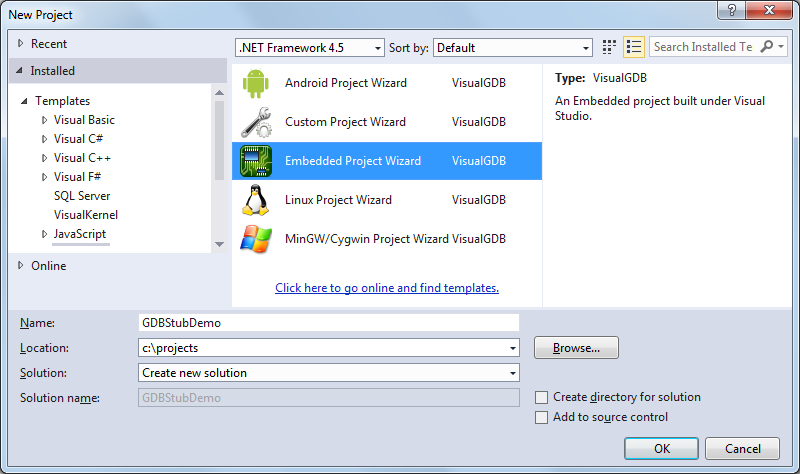
- Start Visual Studio and launch the VisualGDB Embedded project Wizard:
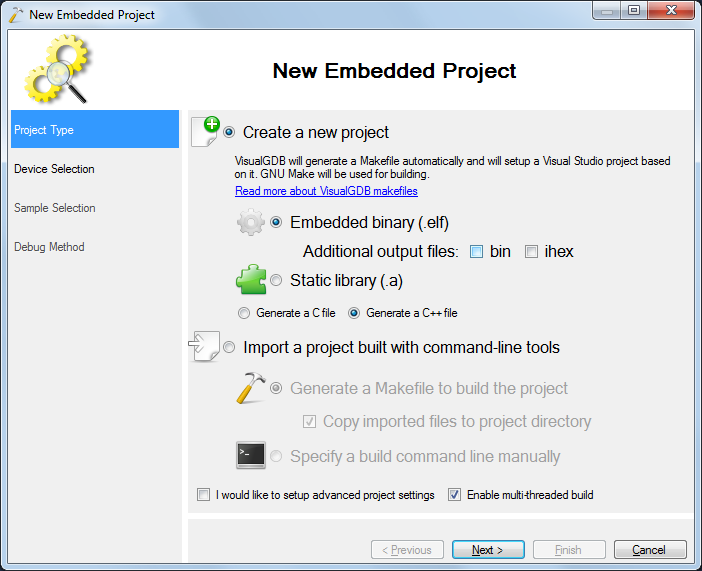
- On the first page uncheck the “bin” checkbox as the ESP8266 projects use their own binary format:
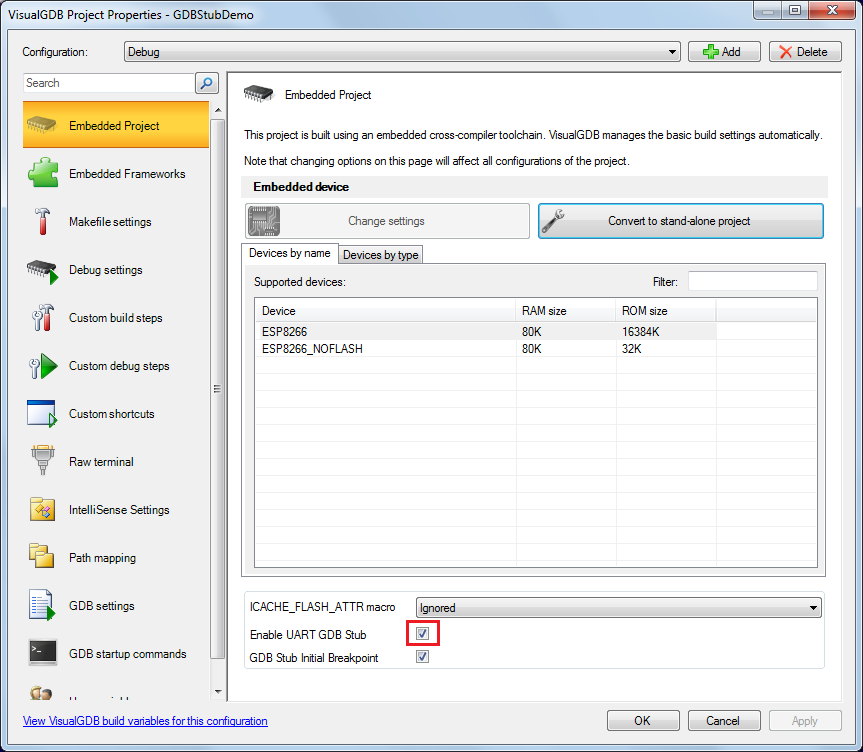
- On the next page select the ESP8266 toolchain, the normal ESP8266 device and enable the UART GDB stub. If the GDB stub checkbox is not shown, install the latest version of the toolchain via VisualGDB Embedded Tools Manager or directly from gnutoolchains.com:
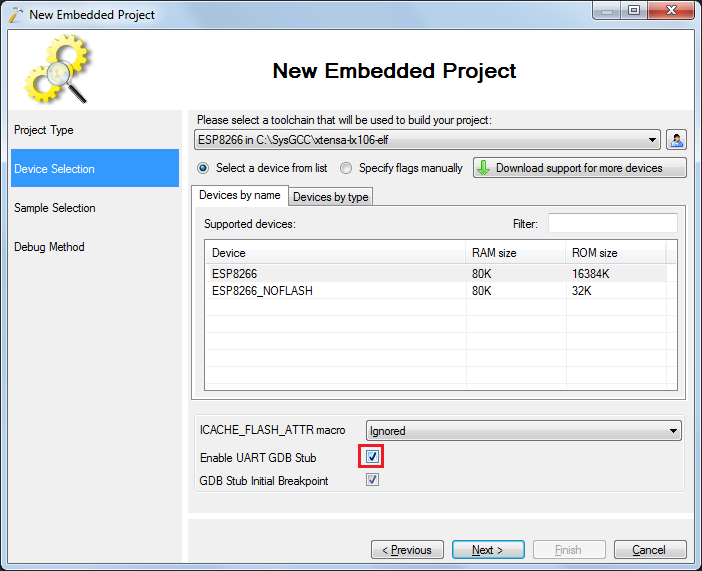 If the “Enable UART GDB Stub” checkbox it not displayed, please update your ESP8266 toolchain via Tools->Embedded Tools Manager.
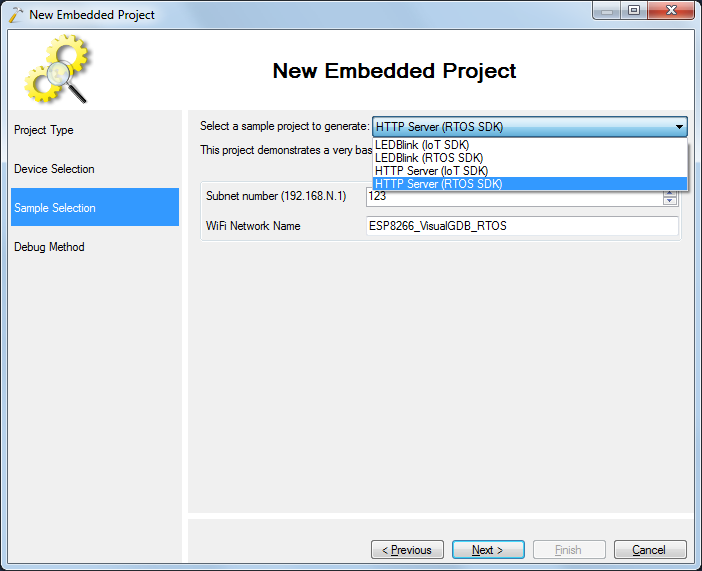
 - Select the HTTP Server (RTOS SDK) sample. As the on-board LED is multiplexed with the TxD signal used by the GDB stub to communicate to GDB, it won’t be possible to debug the LEDBlink samples with the stub:
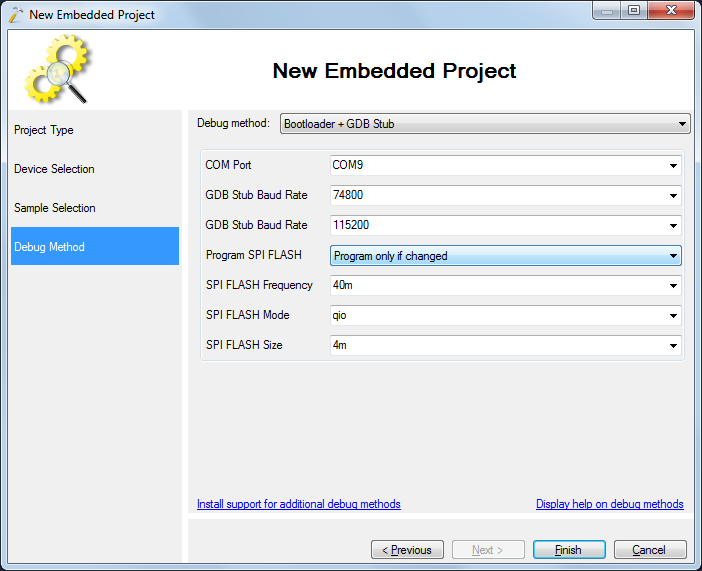
- On the Debug Method page select “Bootloader + GDB Stub” and specify the COM port number where the ESP8266 UART is connected. As uploading the image over UART takes longer than over JTAG, you can select “Program SPI FLASH only if changed” to skip re-uploading it when the project is not changed. However if you program a different project into your ESP8266, VisualGDB won’t detect it and will still skip uploading until you change the project or switch back to “Program Always”:
- Press Finish to create the project and build it with Ctrl-Shift-B:
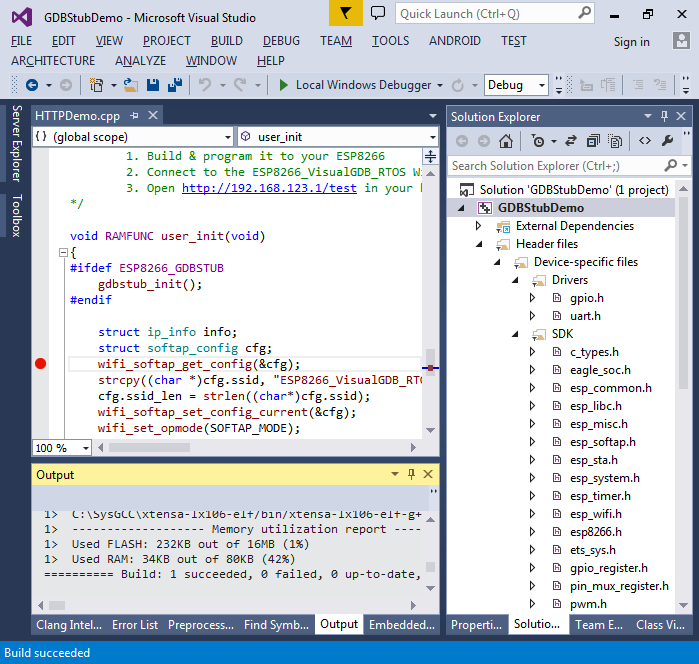
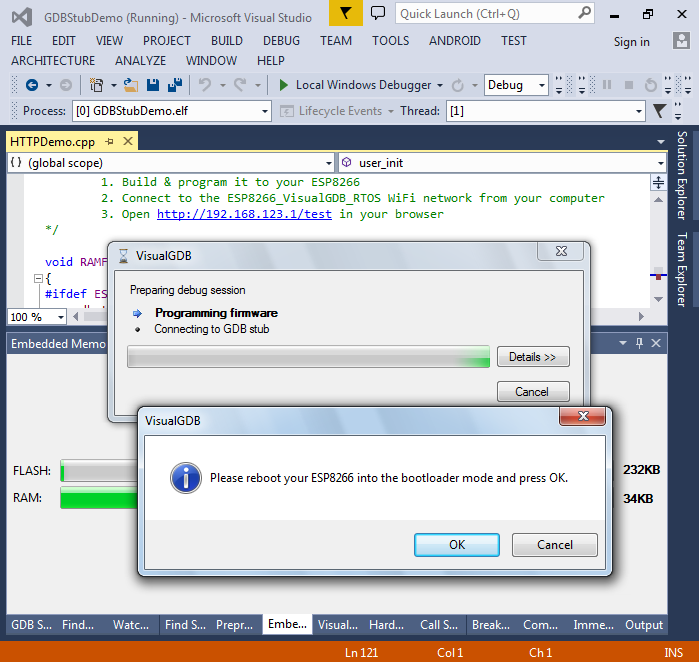
- Set a breakpoint somewhere in the user_init() function after the call to gdbstub_inif() and press F5 to start debugging. VisualGDB will ask you to boot the ESP8266 board into the bootloader mode:
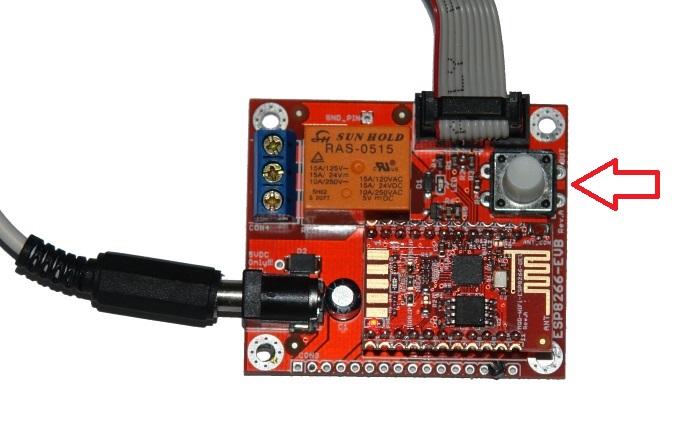
- On the Olimex board this is done by holding the bootloader button, unplugging the power connector and plugging it back:
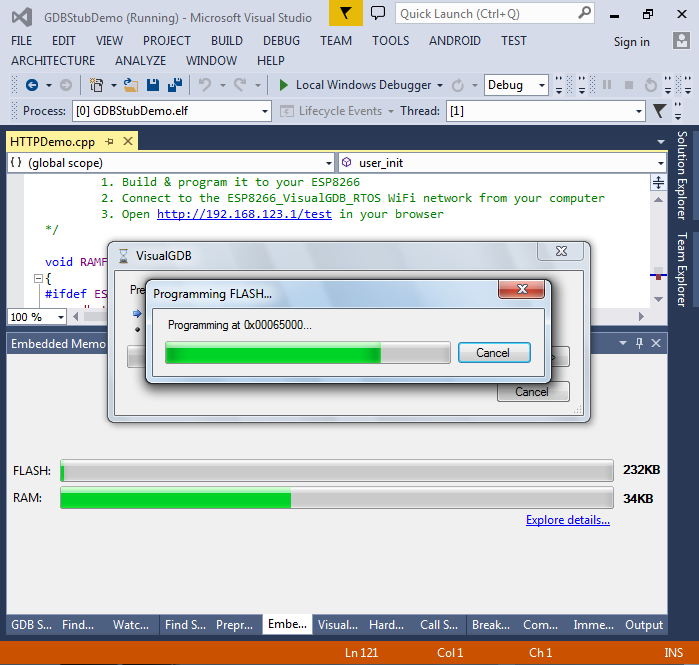
- Once you boot the board into the bootloader mode, press OK. VisualGDB will start uploading the image:
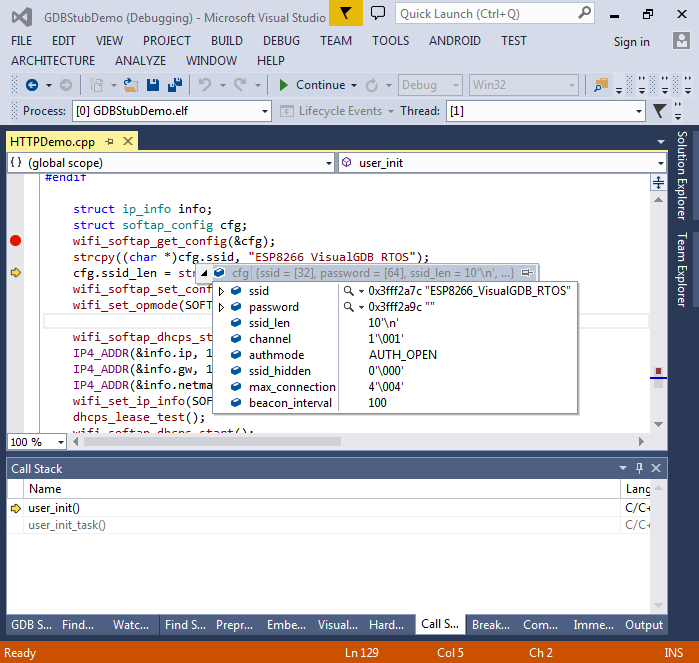
- When the upload is complete, the program will automatically start and your breakpoint will be hit:
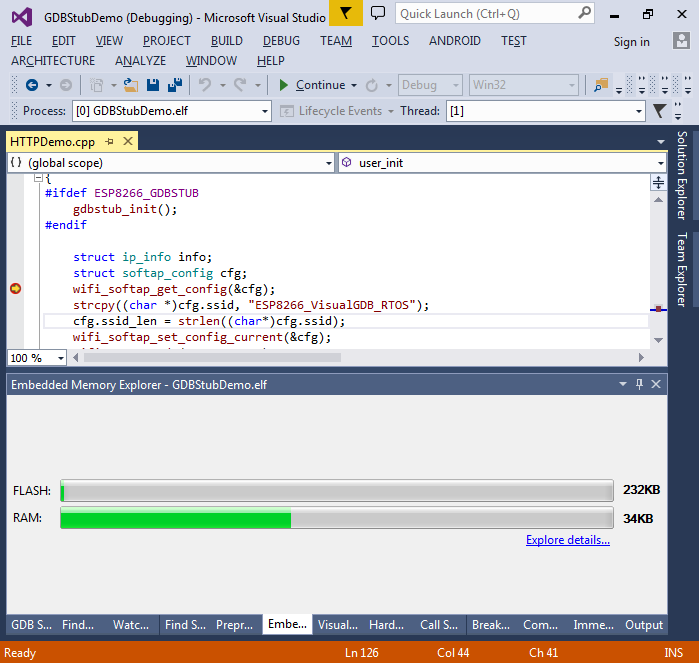
- You can step through the code normally and use tools like Watch and Call Stack to explore the state of your program:
 Follow this tutorial for an example of controlling a relay on the Olimex ESP8266 evaluation board. Note that as the GDB stub is using the pin that is multiplexed with the LED pin, trying to control the LED manually will disrupt the GDB stub communication. The relay uses a different pin and should not interfere with the GDB stub.
 - You can use VisualGDB project properties to enable/disable and configure the GDB stub: