Profiling a basic STM32 application with Visual Studio
This tutorial shows how to analyze the performance of an embedded application running on the STM32 board using the sampling profiler included in the Custom and Ultimate editions of VisualGDB 5.1 Preview 1. Before you begin, install the latest preview version of VisualGDB. Also check for updates via the Embedded Tools Manager as the profiling functionality requires the latest versions of the debug method packages.
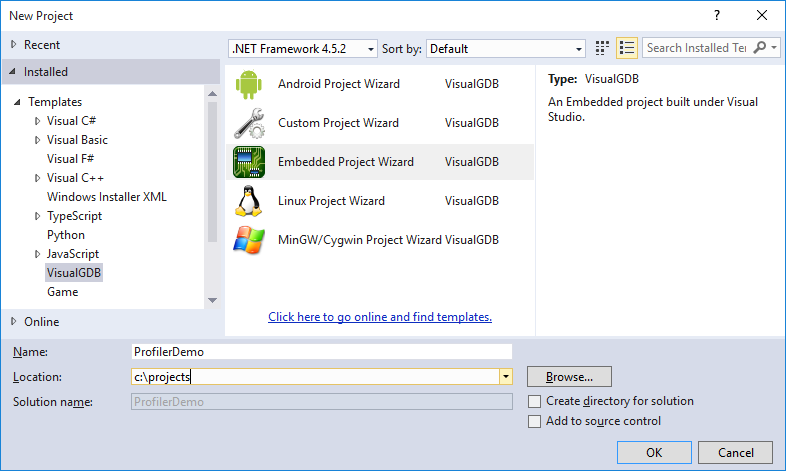
- Start creating a new Embedded project using the VisualGDB Embedded Project Wizard:
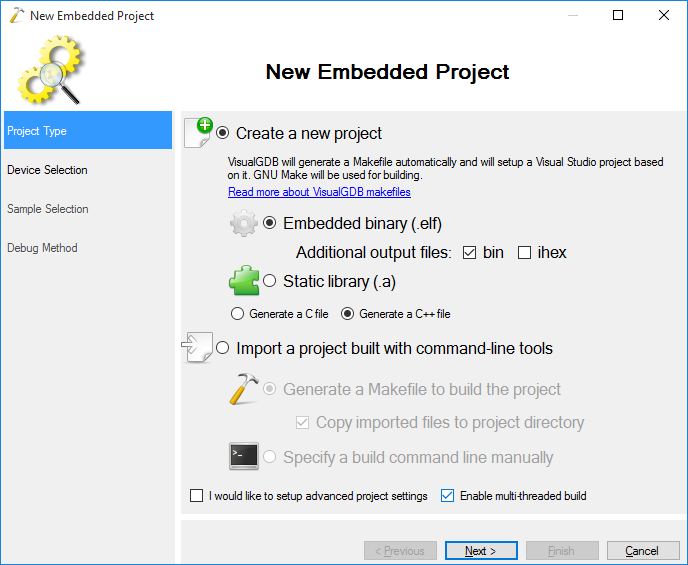
- Select “Create a new project” -> “Embedded binary”:
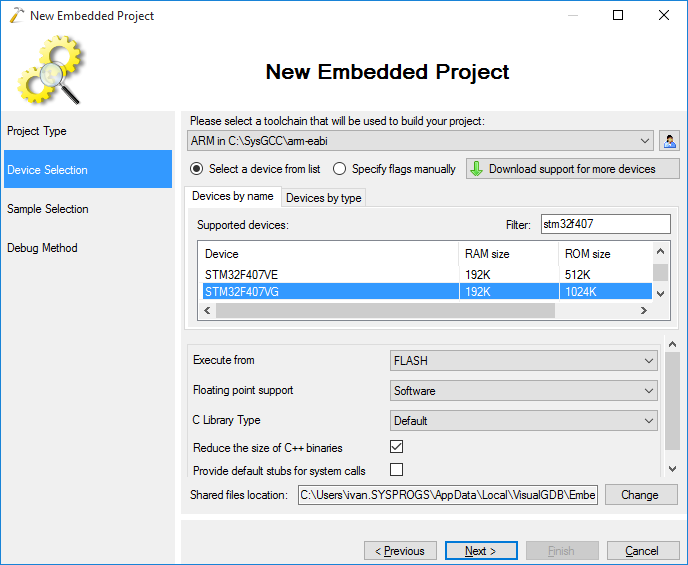
- On the next page select the ARM toolchain and choose your device from the list. In this tutorial we will use the STM32F4-discovery board that has the STM32F407VG device:
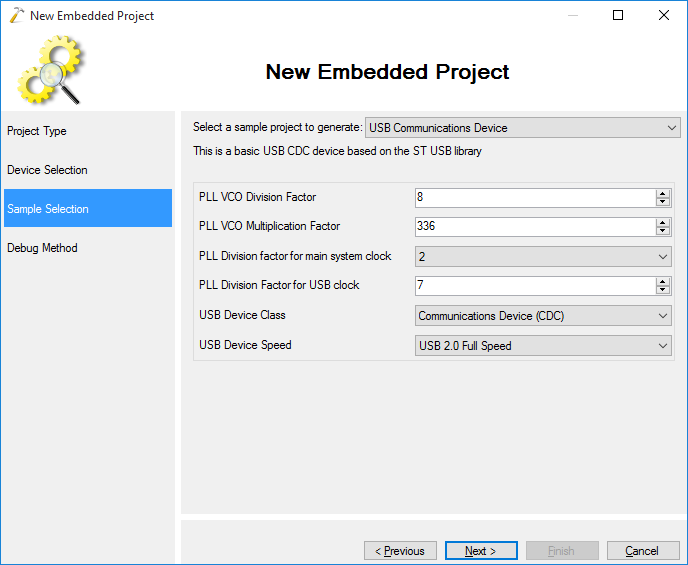
- In this tutorial we will demonstrate profiling by studying the time spent on various tasks of a basic USB device, so we select the USB Communications Device. However the profiler will work with any other sample as well:
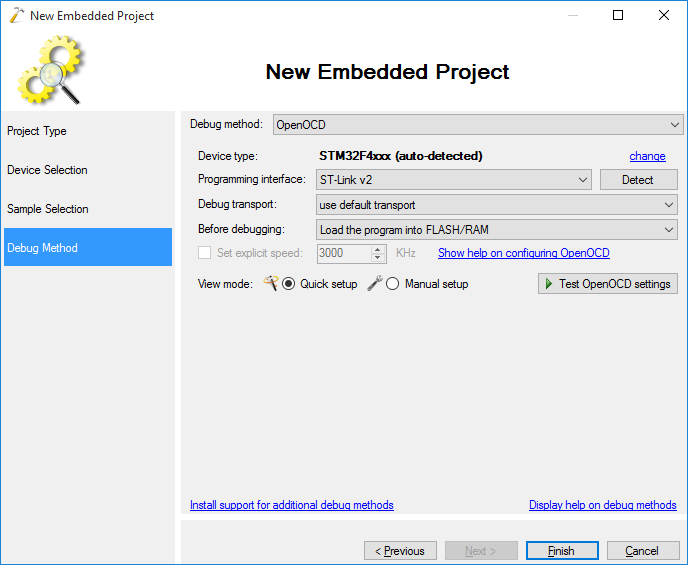
- Select the OpenOCD as your debug method. Note that the profiler will only work with the debug methods that support live memory evaluation (OpenOCD and Segger J-Link):
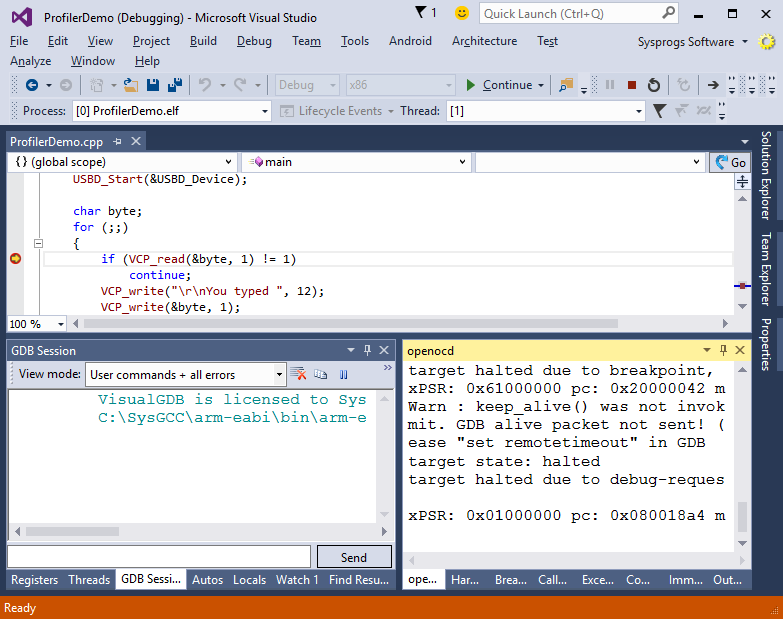
- Press Finish to create your project. Then put a breakpoint somewhere in main() and hit F5 to build and start it. Ensure that the project can be debugged:
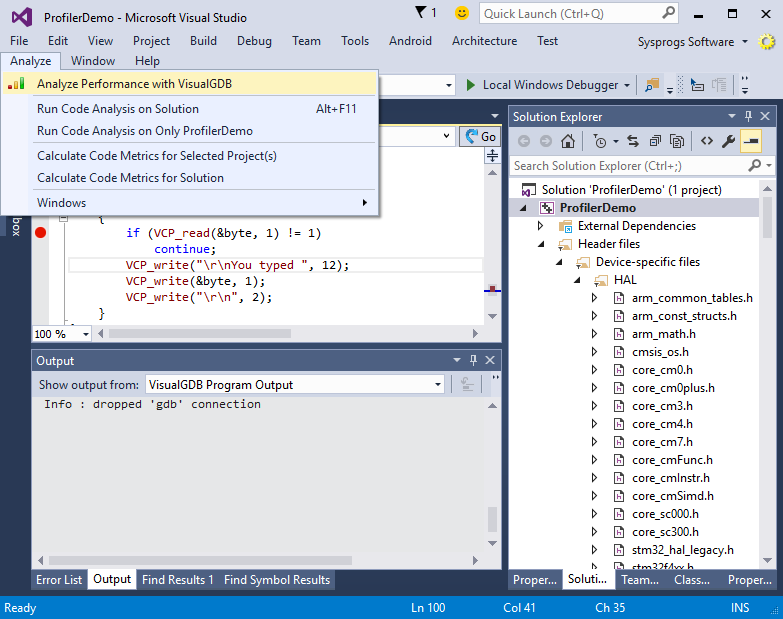
- Now we will start analyzing the performance. Select Analyze->Analyze Performance with VisualGDB (in VS2005-2008 the command will be in the Debug menu instead):
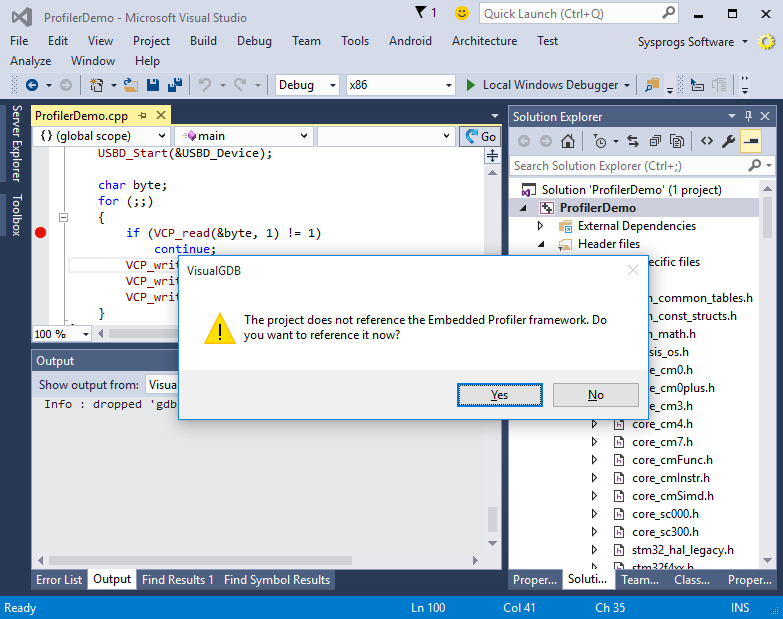
- VisualGDB will suggest installing and referencing the embedded profiling framework. Click “Yes”:
- Before you can actually begin profiling is to initialize the profiler from your code. Include the <SysprogsProfiler.h> file from your main file and call the InitializeSamplingProfiler() function after the call to SystemClock_Config():
#include <SysprogsProfiler.h>

int main(void)
{
    HAL_Init();

    SystemClock_Config();
    InitializeSamplingProfiler();
    //...
}
Note that the InitializeSamplingProfiler() will not do anything unless you explicitly begin profiling using the corresponding command. Hence you can keep it in your code even when you are not profiling.
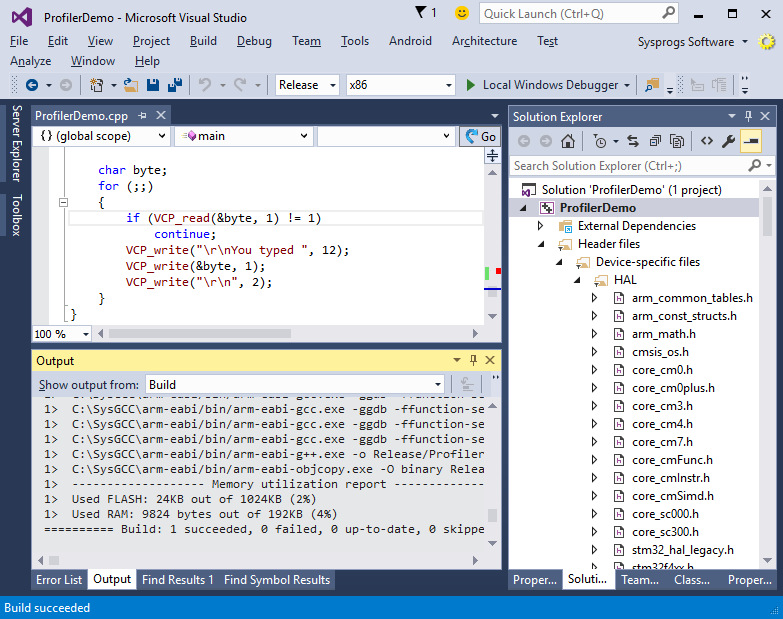
- Since it makes more sense to profile optimized release code, select the release configuration in the configuration manager and build your project:
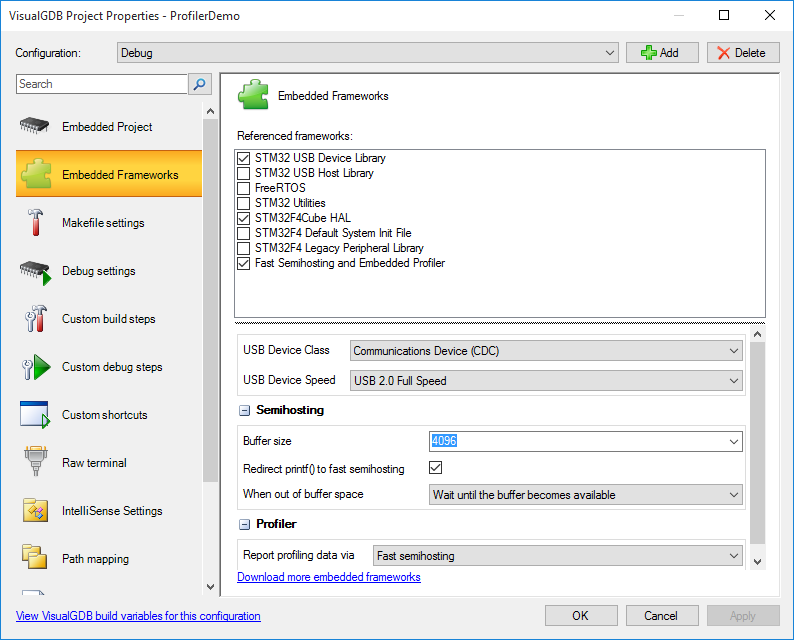
- If you encounter any build errors, open VisualGDB Project Properties and ensure that the profiler framework is referenced:
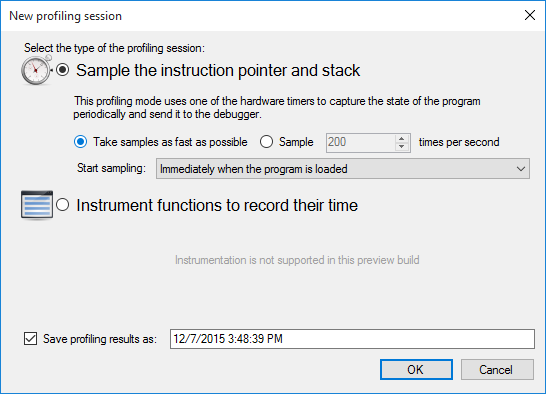
- Now you can start your profiling session by selecting Analyze->Analyze Performance with VisualGDB. Proceed with the default settings:
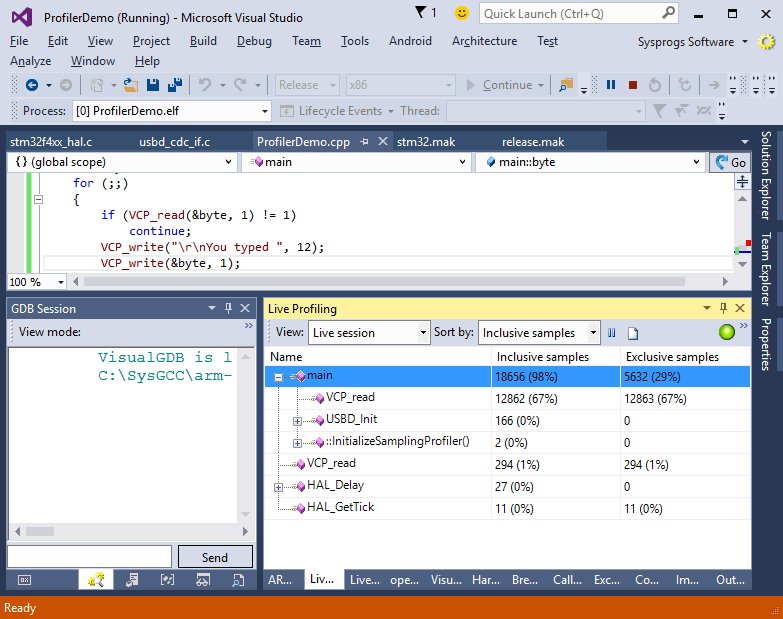
- VisualGDB will load your program into the device and begin profiling. Observe the Live Profiling window showing the most frequently encountered functions:
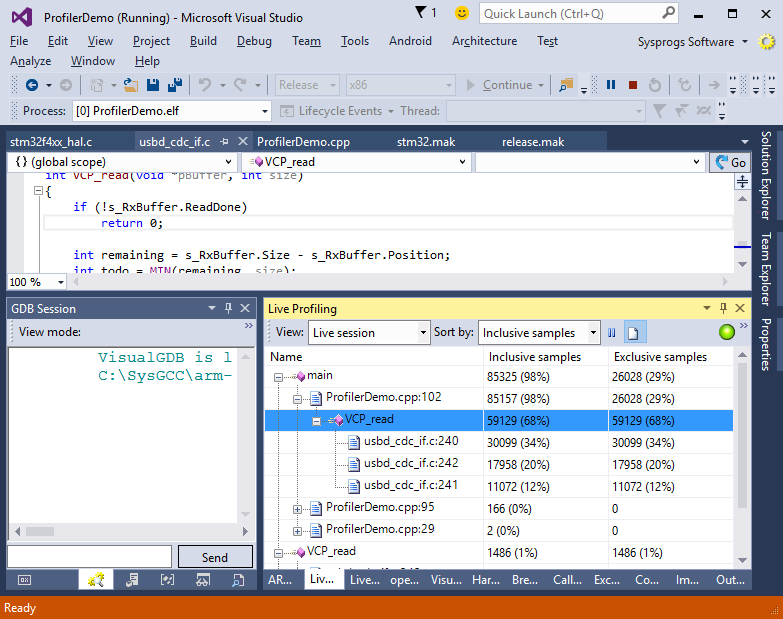
- You can click the file icon on the toolbar to switch from the function-level view to the line-level view. Then VisualGDB will show specific lines in your source code that take the most time:
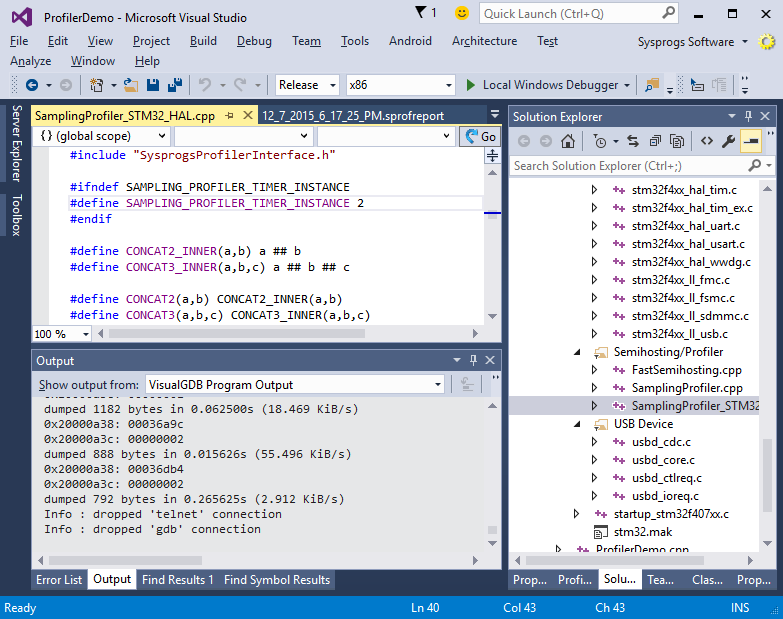
- The sampling profiler works by configuring one of your hardware timers to fire periodic interrupts. At each interrupt it quickly determines the currently executing line of code and searches the stack for clues about the previous frames. Then it compresses this information and stores in an internal buffer that is later read by the debugger without stopping your program. The rate is automatically adjusted to minimize buffer overruns. The default implementation uses the TIM2 timer, however you can easily adjust it by changing the SAMPLING_PROFILER_TIMER_INSTANCE definition in the SamplingProfiler_<platform name>.cpp file:
- Now we will do some more meaningful exploration using the profiler. Modify your main() function as follows:
    char byte;
    while (VCP_read(&byte, 1) != 1)
    {
    }

    for (;;)
    {
        static char buf[512];
        memset(buf, 'Z', sizeof(buf));
        VCP_write(buf, sizeof(buf));
    }
We will use the profiler to see whether running memset() takes considerable time compared to sending the data via USB.
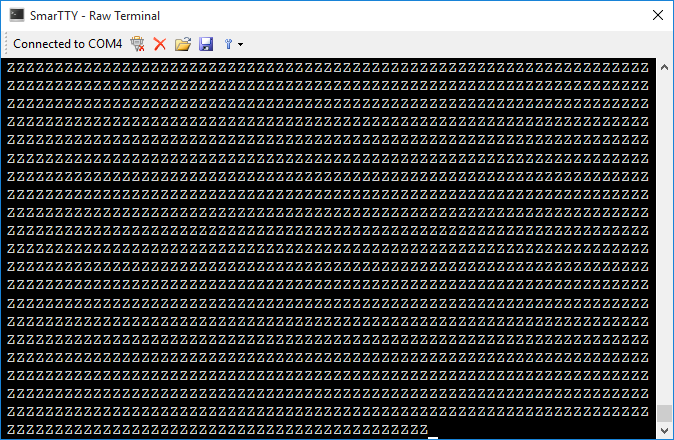
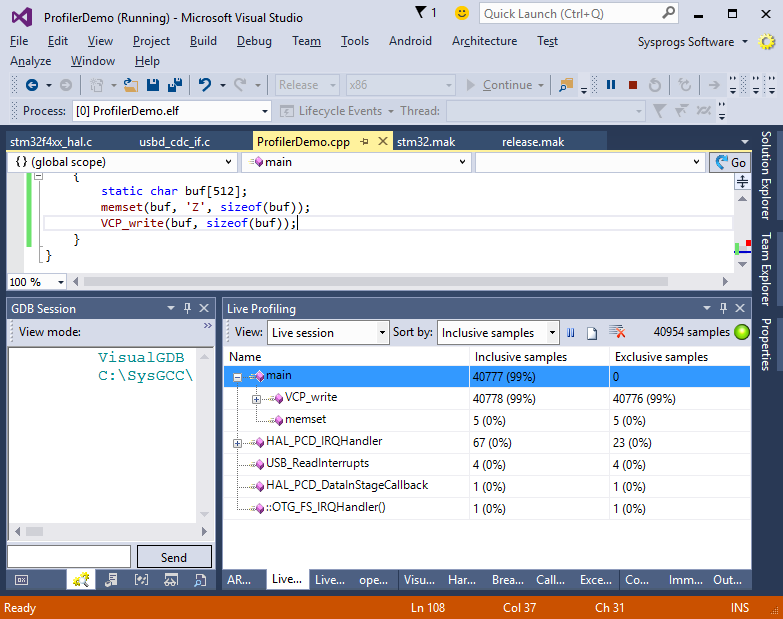
- Begin a profiling session, connect to the virtual COM port created by our device using SmarTTY and type some character. The device will reply with a stream of ‘Z’-s:
- Once that happens, click the “reset content” button in the Live Profiler window to remove the previous records. You will see that memset() is running much less than 1% of the time and is by no means a bottleneck:
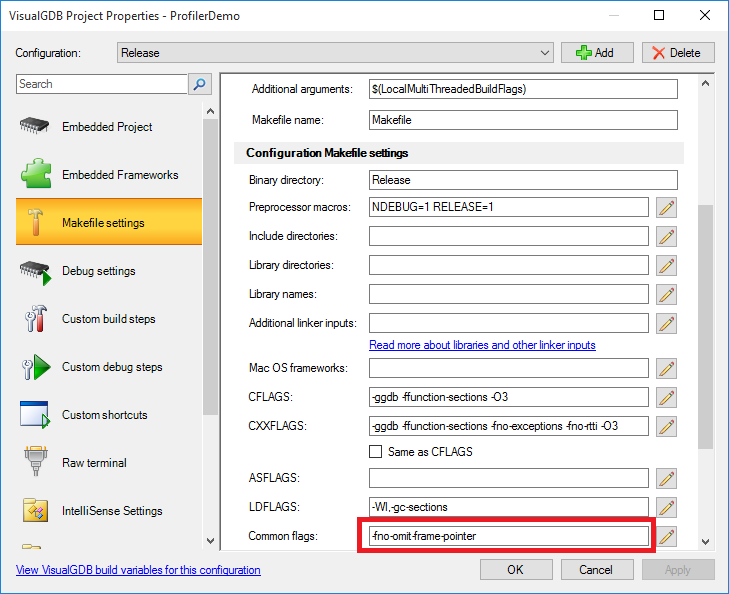
- If some of the stack frames you see in the Live Profiling window do not make sense, try adding the -fno-omit-frame-pointer flag to common flags. This will give more context to the stack unwinding logic resulting in more consistent stack frame records:
- Now let’s see what happens if we run memset() 1000 times per cycle and not just once. Add the for() loop before memset(), build your project and start another session:
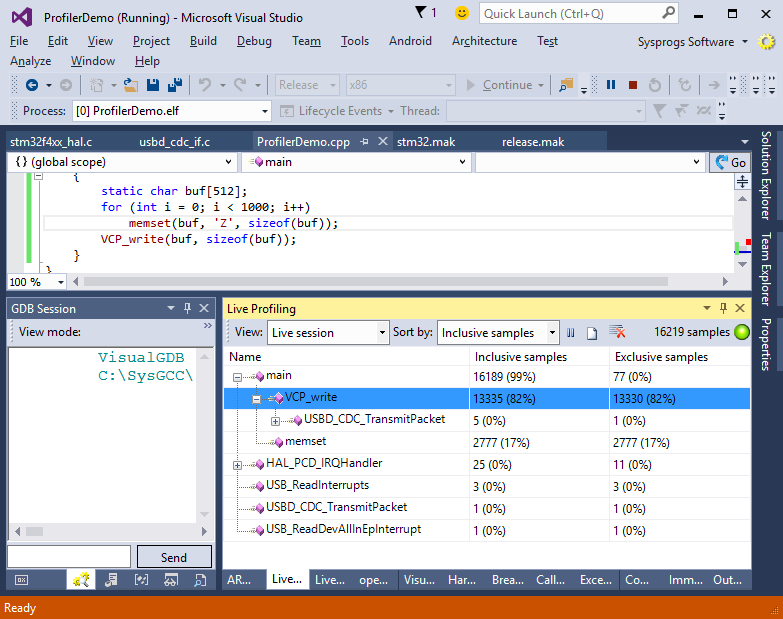
- You will see that memset() now takes around 17% of time and is becoming to affect performance.
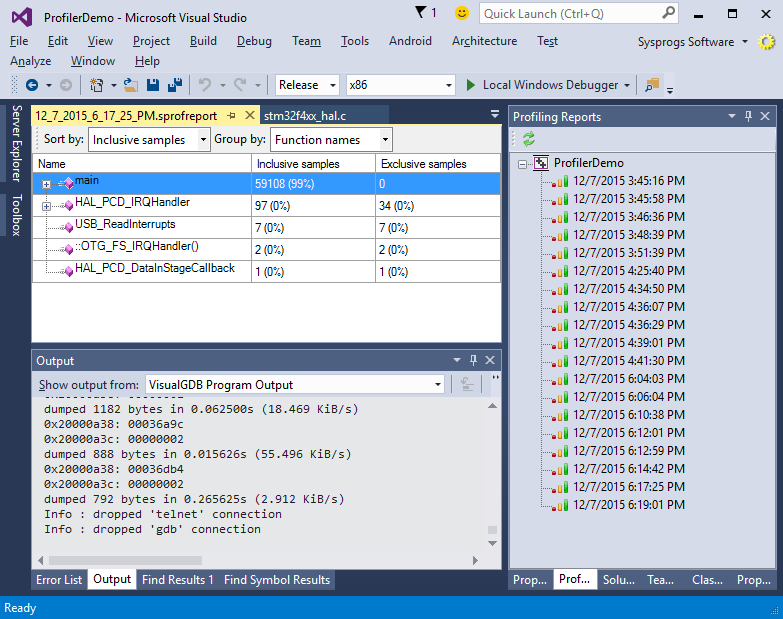
- You can view the history of the profiling sessions for each project via the View->Profiling reports command:
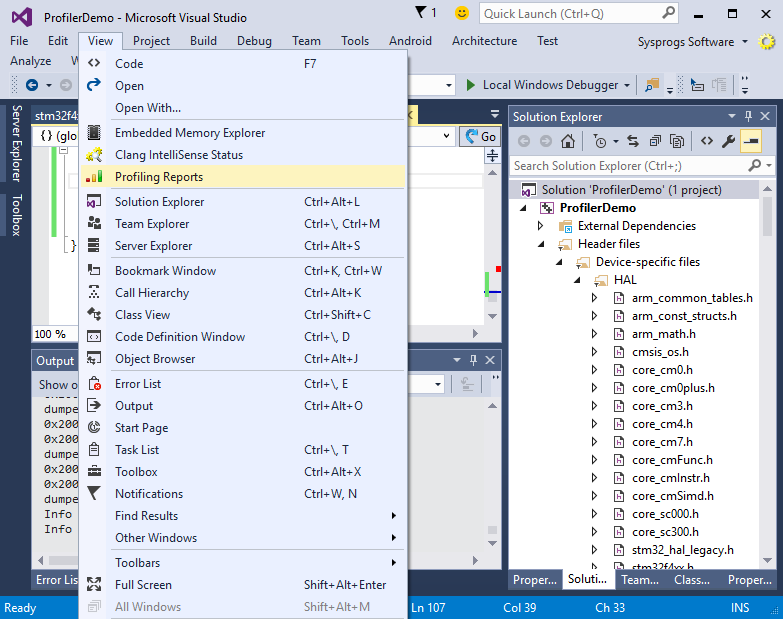
- Simply double-click on a report in the Profiling Reports window and VisualGDB will open it in a separate tab: